

- Executive Summary
- Global Automotive Composites Market Snapshot 2026 and 2033
- Market Opportunity Assessment, 2026-2033, US$ Bn
- Key Market Trends
- Industry Developments and Key Market Events
- Demand Side and Supply Side Analysis
- PMR Analysis and Recommendations
- Market Overview
- Market Scope and Definitions
- Value Chain Analysis
- Macro-Economic Factors
- Global GDP Outlook
- Global Prison Growth Outlook
- Global Crime Rates by Country
- Global Prison Population by Country
- Global Private Prison Market Growth Outlook
- Other Macro-economic Factors
- Forecast Factors - Relevance and Impact
- COVID-19 Impact Assessment
- PESTLE Analysis
- Porter's Five Forces Analysis
- Geopolitical Tensions: Market Impact
- Regulatory and Technology Landscape
- Market Dynamics
- Drivers
- Restraints
- Opportunities
- Trends
- Price Trend Analysis, 2020 - 2033
- Region-wise Price Analysis
- Price by Segments
- Price Impact Factors
- Global Automotive Composites Market Outlook: Historical (2020 - 2025) and Forecast (2026 - 2033)
- Key Highlights
- Global Automotive Composites Market Outlook: Fiber Type
- Introduction/Key Findings
- Historical Market Size (US$ Bn) Analysis by Fiber Type, 2020-2025
- Current Market Size (US$ Bn) Forecast, by Fiber Type, 2026-2033
- Glass Fiber
- Carbon Fiber
- Natural Fiber
- PTZ Cameras
- Market Attractiveness Analysis: Fiber Type
- Global Automotive Composites Market Outlook: Resin
- Introduction/Key Findings
- Historical Market Size (US$ Bn) Analysis by Resin, 2020-2025
- Current Market Size (US$ Bn) Forecast, by Resin, 2026-2033
- Thermoset
- Thermoplastic
- Market Attractiveness Analysis: Resin
- Global Automotive Composites Market Outlook: Matrix Material
- Introduction/Key Findings
- Historical Market Size (US$ Bn) Analysis by Matrix Material, 2020-2025
- Current Market Size (US$ Bn) Forecast, by Matrix Material, 2026-2033
- Polymer Matrix Composites (PMC)
- Metal Matrix Composites (MMC)
- Ceramic Matrix Composites (CMC)
- Market Attractiveness Analysis: Matrix Material
- Global Automotive Composites Market Outlook: Application
- Introduction/Key Findings
- Historical Market Size (US$ Bn) Analysis by Application, 2020-2025
- Current Market Size (US$ Bn) Forecast, by Application, 2026-2033
- Exterior
- Interior
- Structural
- Market Attractiveness Analysis: Application
- Global Automotive Composites Market Outlook: Vehicle Type
- Introduction/Key Findings
- Historical Market Size (US$ Bn) Analysis by Vehicle Type, 2020-2025
- Current Market Size (US$ Bn) Forecast, by Vehicle Type, 2026-2033
- Passenger Vehicles
- Commercial Vehicles
- Electric Vehicles (EVs)
- Other Vehicles
- Market Attractiveness Analysis: Vehicle Type
- Global Automotive Composites Market Outlook: Region
- Key Highlights
- Historical Market Size (US$ Bn) Analysis by Region, 2020-2025
- Current Market Size (US$ Bn) Forecast, by Region, 2026-2033
- North America
- Europe
- East Asia
- South Asia & Oceania
- Latin America
- Middle East & Africa
- Market Attractiveness Analysis: Region
- North America Automotive Composites Market Outlook: Historical (2020 - 2025) and Forecast (2026 - 2033)
- Key Highlights
- Pricing Analysis
- North America Market Size (US$ Bn) Forecast, by Country, 2026-2033
- U.S.
- Canada
- North America Market Size (US$ Bn) Forecast, by Fiber Type, 2026-2033
- Glass Fiber
- Carbon Fiber
- Natural Fiber
- PTZ Cameras
- North America Market Size (US$ Bn) Forecast, by Resin, 2026-2033
- Thermoset
- Thermoplastic
- North America Market Size (US$ Bn) Forecast, by Matrix Material, 2026-2033
- Polymer Matrix Composites (PMC)
- Metal Matrix Composites (MMC)
- Ceramic Matrix Composites (CMC)
- North America Market Size (US$ Bn) Forecast, by Application, 2026-2033
- Exterior
- Interior
- Structural
- North America Market Size (US$ Bn) Forecast, by Vehicle Type, 2026-2033
- Passenger Vehicles
- Commercial Vehicles
- Electric Vehicles (EVs)
- Other Vehicles
- Europe Automotive Composites Market Outlook: Historical (2020 - 2025) and Forecast (2026 - 2033)
- Key Highlights
- Pricing Analysis
- Europe Market Size (US$ Bn) Forecast, by Country, 2026-2033
- Germany
- Italy
- France
- U.K.
- Spain
- Russia
- Rest of Europe
- Europe Market Size (US$ Bn) Forecast, by Fiber Type, 2026-2033
- Glass Fiber
- Carbon Fiber
- Natural Fiber
- PTZ Cameras
- Europe Market Size (US$ Bn) Forecast, by Resin, 2026-2033
- Thermoset
- Thermoplastic
- Europe Market Size (US$ Bn) Forecast, by Matrix Material, 2026-2033
- Polymer Matrix Composites (PMC)
- Metal Matrix Composites (MMC)
- Ceramic Matrix Composites (CMC)
- Europe Market Size (US$ Bn) Forecast, by Application, 2026-2033
- Exterior
- Interior
- Structural
- Europe Market Size (US$ Bn) Forecast, by Vehicle Type, 2026-2033
- Passenger Vehicles
- Commercial Vehicles
- Electric Vehicles (EVs)
- Other Vehicles
- East Asia Automotive Composites Market Outlook: Historical (2020 - 2025) and Forecast (2026 - 2033)
- Key Highlights
- Pricing Analysis
- East Asia Market Size (US$ Bn) Forecast, by Country, 2026-2033
- China
- Japan
- South Korea
- East Asia Market Size (US$ Bn) Forecast, by Fiber Type, 2026-2033
- Glass Fiber
- Carbon Fiber
- Natural Fiber
- PTZ Cameras
- East Asia Market Size (US$ Bn) Forecast, by Resin, 2026-2033
- Thermoset
- Thermoplastic
- East Asia Market Size (US$ Bn) Forecast, by Matrix Material, 2026-2033
- Polymer Matrix Composites (PMC)
- Metal Matrix Composites (MMC)
- Ceramic Matrix Composites (CMC)
- East Asia Market Size (US$ Bn) Forecast, by Application, 2026-2033
- Exterior
- Interior
- Structural
- East Asia Market Size (US$ Bn) Forecast, by Vehicle Type, 2026-2033
- Passenger Vehicles
- Commercial Vehicles
- Electric Vehicles (EVs)
- Other Vehicles
- South Asia & Oceania Automotive Composites Market Outlook: Historical (2020 - 2025) and Forecast (2026 - 2033)
- Key Highlights
- Pricing Analysis
- South Asia & Oceania Market Size (US$ Bn) Forecast, by Country, 2026-2033
- India
- Southeast Asia
- ANZ
- Rest of SAO
- South Asia & Oceania Market Size (US$ Bn) Forecast, by Fiber Type, 2026-2033
- Glass Fiber
- Carbon Fiber
- Natural Fiber
- PTZ Cameras
- South Asia & Oceania Market Size (US$ Bn) Forecast, by Resin, 2026-2033
- Thermoset
- Thermoplastic
- South Asia & Oceania Market Size (US$ Bn) Forecast, by Matrix Material, 2026-2033
- Polymer Matrix Composites (PMC)
- Metal Matrix Composites (MMC)
- Ceramic Matrix Composites (CMC)
- South Asia & Oceania Market Size (US$ Bn) Forecast, by Application, 2026-2033
- Exterior
- Interior
- Structural
- South Asia & Oceania Market Size (US$ Bn) Forecast, by Vehicle Type, 2026-2033
- Passenger Vehicles
- Commercial Vehicles
- Electric Vehicles (EVs)
- Other Vehicles
- Latin America Automotive Composites Market Outlook: Historical (2020 - 2025) and Forecast (2026 - 2033)
- Key Highlights
- Pricing Analysis
- Latin America Market Size (US$ Bn) Forecast, by Country, 2026-2033
- Brazil
- Mexico
- Rest of LATAM
- Latin America Market Size (US$ Bn) Forecast, by Fiber Type, 2026-2033
- Glass Fiber
- Carbon Fiber
- Natural Fiber
- PTZ Cameras
- Latin America Market Size (US$ Bn) Forecast, by Resin, 2026-2033
- Thermoset
- Thermoplastic
- Latin America Market Size (US$ Bn) Forecast, by Matrix Material, 2026-2033
- Polymer Matrix Composites (PMC)
- Metal Matrix Composites (MMC)
- Ceramic Matrix Composites (CMC)
- Latin America Market Size (US$ Bn) Forecast, by Application, 2026-2033
- Exterior
- Interior
- Structural
- Latin America Market Size (US$ Bn) Forecast, by Vehicle Type, 2026-2033
- Passenger Vehicles
- Commercial Vehicles
- Electric Vehicles (EVs)
- Other Vehicles
- Middle East & Africa Automotive Composites Market Outlook: Historical (2020 - 2025) and Forecast (2026 - 2033)
- Key Highlights
- Pricing Analysis
- Middle East & Africa Market Size (US$ Bn) Forecast, by Country, 2026-2033
- GCC Countries
- South Africa
- Northern Africa
- Rest of MEA
- Middle East & Africa Market Size (US$ Bn) Forecast, by Fiber Type, 2026-2033
- Glass Fiber
- Carbon Fiber
- Natural Fiber
- PTZ Cameras
- Middle East & Africa Market Size (US$ Bn) Forecast, by Resin, 2026-2033
- Thermoset
- Thermoplastic
- Middle East & Africa Market Size (US$ Bn) Forecast, by Matrix Material, 2026-2033
- Polymer Matrix Composites (PMC)
- Metal Matrix Composites (MMC)
- Ceramic Matrix Composites (CMC)
- Middle East & Africa Market Size (US$ Bn) Forecast, by Application, 2026-2033
- Exterior
- Interior
- Structural
- Middle East & Africa Market Size (US$ Bn) Forecast, by Vehicle Type, 2026-2033
- Passenger Vehicles
- Commercial Vehicles
- Electric Vehicles (EVs)
- Other Vehicles
- Competition Landscape
- Market Share Analysis, 2025
- Market Structure
- Competition Intensity Mapping
- Competition Dashboard
- Company Profiles
- Toray Industries, Inc.
- Company Overview
- Product Portfolio/Offerings
- Key Financials
- SWOT Analysis
- Company Strategy and Key Developments
- Teijin Limited
- Mitsubishi Chemical Group
- Solvay S.A.
- SGL Carbon SE
- Hexcel Corporation
- Owens Corning
- Gurit Holding AG
- IDI Composites International
- Formaplex Technologies Ltd
- RTP Company
- Plasan Carbon Composites
- UFP Technologies, Inc.
- Huntsman International LLC
- Quantum Composites
- Sika AG
- Covestro AG
- Scott Bader Company Ltd
- Cytec Industries Inc. (Solvay)
- Porcher Industries
- Toray Industries, Inc.
- Appendix
- Research Methodology
- Research Assumptions
- Acronyms and Abbreviations


- Advanced Materials
- Automotive Composites Market
Automotive Composites Market Size, Share, and Growth Forecast 2026 - 2033
Automotive Composites Market by Fiber Type (Glass Fiber, Carbon Fiber, Natural Fiber), by Resin (Thermoset, Thermoplastic), by Matrix Material (Polymer Matrix Composites, Metal Matrix Composites, Ceramic Matrix Composites), Application (Exterior, Interior, Structural), Vehicle Type (Passenger Vehicles, Commercial Vehicles, Electric Vehicles, Other Vehicles), and Regional Analysis, 2026 - 2033
Automotive Composites Market Size and Trend Analysis
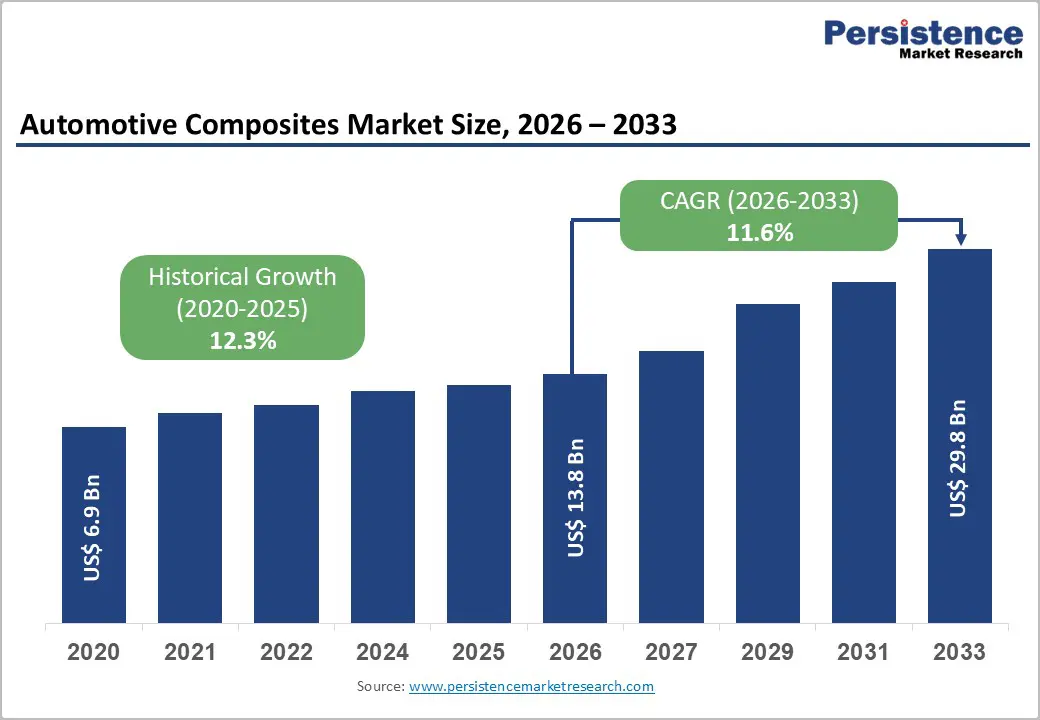
The global automotive composites market size is expected to be valued at US$ 13.8 billion in 2026 and projected to reach US$ 29.8 billion by 2033, growing at a CAGR of 11.6% between 2026 and 2033.
This robust growth trajectory is primarily propelled by the accelerating global transition toward electric vehicles (EVs) and increasingly stringent fuel economy regulations that compel automakers to integrate lightweight materials. Automotive composites offer a compelling combination of high strength-to-weight ratios, design flexibility, and corrosion resistance, enabling vehicle manufacturers to achieve significant weight savings of up to 50% compared to traditional steel components. Concurrent advancements in manufacturing processes such as resin transfer molding (RTM) and automated fiber placement (AFP) are further reducing production cycle times, making composites increasingly cost-competitive for high-volume automotive applications.
Key Industry Highlights:
- Key Region: Europe leads the global Automotive Composites Market, holding approximately 33% of global market share in 2025, driven by the EU’s stringent CO2 emission regulations, premium OEM leadership from Germany, and strong regional composite material manufacturing infrastructure.
- Fastest Growing Region: Asia Pacific is the fastest-growing regional market, projected to expand at a CAGR of approximately 13.5% through 2033, fueled by China’s explosive NEV production growth, India’s expanding automotive manufacturing base, and significant investment by Japanese composite material leaders.
- Dominant Segment: Glass fiber dominates the fiber type segment with approximately 62% market share in 2025, supported by its cost advantage over carbon fiber, established supply chain, and broad applicability across high-volume exterior, interior, and underbody automotive components.
- Fastest Growing Segment: Electric Vehicles represent the fastest-growing vehicle type segment, expected to expand at a CAGR exceeding 17% through 2033, as EV manufacturers integrate composites in battery enclosures, body structures, and chassis systems to offset battery weight and extend driving range.
- Key Opportunity: Structural composite applications present the most significant market opportunity, as advances in HP-RTM, thermoplastic overmolding, and structural bonding technologies enable cost-competitive integration of composites into safety-critical vehicle components, including pillars, floor pans, and crash structures.
| Key Insights | Details |
|---|---|
| Automotive Composites Market Size (2026E) | US$ 13.8 Billion |
| Market Value Forecast (2033F) | US$ 29.8 Billion |
| Projected Growth CAGR (2026 - 2033) | 11.6% |
| Historical Market Growth (2020 - 2025) | 12.3% |
Market Dynamics
Drivers - Tightening Emission Regulations and Fuel Economy Standards Accelerating Lightweight Material Adoption
Global regulatory pressure is one of the most compelling catalysts for automotive composites adoption. The European Union’s CO2 emission targets mandate passenger car fleet averages of 93.6 g CO2/km by 2030, a reduction of approximately 55% from 2021 levels, pushing automakers aggressively toward lightweighting solutions. In the United States, the National Highway Traffic Safety Administration (NHTSA) and the Environmental Protection Agency (EPA) have reinstated ambitious Corporate Average Fuel Economy (CAFE) standards, targeting approximately 49 miles per gallon by 2026 for new passenger cars. Automotive composites, by replacing conventional steel and aluminum with carbon fiber-reinforced polymers (CFRPs) and glass fiber-reinforced polymers (GFRPs), enable vehicle weight reductions of 25-50%, directly translating into reduced emissions and improved fuel economy. This regulatory impetus is expected to sustain compound annual growth across the forecast period.
Surging Electric Vehicle Production Creating Unprecedented Demand for Composite Components
The global electric vehicle market is experiencing exponential growth, with the International Energy Agency (IEA) reporting that global EV sales surpassed 14 million units in 2023, accounting for nearly 18% of total global car sales. As EVs rely on battery packs that add significant weight, typically 400-800 kg, automakers are increasingly turning to composites for body panels, battery enclosures, chassis reinforcements, and structural components to offset battery mass and extend driving range. China, the world’s largest EV market, produced over 9 million EVs in 2023 according to the China Association of Automobile Manufacturers (CAAM), driving substantial regional demand for lightweight composites. Battery enclosure components made from glass and carbon fiber composites are gaining significant traction, as they offer both the necessary structural integrity and thermal management properties critical for EV performance. This megatrend is expected to be the single most influential growth driver through 2033.
Restraints - High Production Costs and Limitations in High-Volume Manufacturing
Despite their superior mechanical properties, the widespread adoption of advanced composites, particularly carbon fiber-reinforced polymers, remains constrained by significantly high raw material and processing costs. The average cost of carbon fiber ranges between US$ 15-30 per kilogram for industrial-grade material, compared to steel at less than US$ 1 per kilogram, creating a substantial cost barrier for mass-market vehicle segments. Furthermore, conventional composite manufacturing processes such as autoclave curing involve long cycle times, often exceeding 60-90 minutes per part, making them ill-suited for high-volume automotive production lines that demand cycle times of under 5 minutes. While high-pressure resin transfer molding (HP-RTM) is improving throughput, investment costs for tooling and equipment remain prohibitive for many mid-tier suppliers, thereby limiting market penetration beyond premium and performance vehicle segments.
Recycling and End-of-Life Management Challenges
Thermoset-based composites, which currently dominate the automotive composites market, present significant sustainability and circular economy challenges. Unlike thermoplastics or metals, thermoset composites cannot be re-melted or reshaped after curing, making conventional mechanical recycling the only commercially viable option, a process that degrades fiber length and reduces mechanical performance by up to 30-40%. The European Union’s End-of-Life Vehicle (ELV) Directive mandates that 95% of vehicle weight must be recoverable or recyclable, placing composite-heavy vehicle architectures under increasing regulatory scrutiny. The lack of established, cost-effective recycling infrastructure for composite materials is deterring some OEMs from committing to widespread composite integration, particularly in markets with mature sustainability reporting requirements.
Opportunity - Rising Adoption of Natural Fiber Composites Aligned with Sustainability Mandates
The growing global emphasis on sustainable manufacturing and bio-based materials is opening a significant growth avenue for natural fiber composites (NFCs) in automotive applications. Natural fibers such as flax, hemp, jute, and kenaf offer a viable, cost-effective alternative to glass and carbon fibers, delivering a 25-45% lower environmental footprint in terms of CO2 emissions per kilogram of fiber produced, according to assessments supported by the European Bioplastics Association. Several leading automakers, including BMW, Mercedes-Benz, and Toyota, have already incorporated natural fiber composite panels in door linings, trunk liners, and seat back panels. The European automotive sector’s alignment with the EU Green Deal and the push for bio-based content in vehicles is expected to stimulate significant investment in natural fiber composite R&D. Moreover, developments in the Bioadhesives Market are complementing NFC adoption, as bio-based bonding solutions enable stronger fiber-to-matrix interfaces, enhancing overall composite performance while aligning with sustainability objectives. This segment is poised for accelerated growth through 2033.
Expanding Application in Structural Components Driven by Advanced Manufacturing Technologies
Structural composites represent one of the fastest-growing application segments, particularly as high-pressure resin transfer molding (HP-RTM), thermoplastic composite overmolding, and continuous fiber 3D printing reach commercial maturity. BMW’s i-series vehicles demonstrated the viability of carbon fiber-reinforced polymer (CFRP) life modules at a semi-mass-production scale, with the BMW i3 incorporating approximately 150 kg of CFRP structural components. As these manufacturing technologies scale, structural applications, including A-pillars, B-pillars, floor panels, and crash management systems, are becoming economically viable beyond the premium segment. The growing sophistication of the Automotive Adhesives & Sealants Market is further enabling structural composite integration, as modern two-component structural adhesives can bond dissimilar materials with tensile strengths exceeding 30 MPa, eliminating the need for mechanical fasteners and reducing assembly weight. With structural composite parts offering crashworthiness improvements of up to 20% over equivalent steel structures per unit weight, this application domain represents a compelling revenue opportunity for composite manufacturers through the forecast period.
Category-wise Analysis
Fiber Type Insights
Glass fiber emerged as the leading segment in the Automotive Composites Market by fiber type, commanding approximately 62% of the total market share in 2025. This dominance is attributable to glass fiber’s well-established cost advantage, priced at roughly US$ 2-5 per kilogram compared to US$ 15-30 per kilogram for carbon fiber, making it the material of choice for cost-sensitive, high-volume automotive applications such as body panels, underbody shields, engine covers, and interior trim components. According to Owens Corning, one of the world’s largest glass fiber producers, global glass fiber demand from the transportation sector continues to grow steadily, supported by expanding production of light commercial vehicles and passenger cars in Asia Pacific and Latin America. The segment also benefits from a mature and well-distributed global supply chain, established processing infrastructure, and broad compatibility with thermoset resins. Carbon fiber, meanwhile, is the fastest-growing fiber segment, supported by declining precursor costs and expanding EV adoption.
Resin Insights
Thermoset resins held the dominant position in the Automotive Composites Market by resin type, accounting for approximately 65% of market share in 2025. Thermoset composites, primarily epoxy, polyester, and vinyl ester-based systems, remain the preferred choice for structural and exterior automotive applications due to their superior mechanical performance, high temperature resistance, excellent chemical resistance, and proven long-term durability. Epoxy-based systems, in particular, are extensively used in high-performance and EV applications owing to their outstanding fiber-to-matrix adhesion properties. The maturity of thermoset processing technologies, including RTM, vacuum-assisted RTM (VARTM), and wet lay-up, further reinforces their dominance. However, thermoplastic resins represent the fastest-growing segment, driven by recyclability, shorter cycle times, and growing suitability for automated, high-volume production environments.
Matrix Material Insights
Polymer Matrix Composites (PMC) dominated the Automotive Composites Market by matrix material, representing approximately 73% of the total market share in 2025. PMCs, encompassing both thermoset and thermoplastic polymer matrices reinforced with glass, carbon, or natural fibers, are the cornerstone of automotive composite applications due to their exceptional balance of low density, design flexibility, and cost-effectiveness. They enable significant vehicle weight savings without compromising structural integrity, making them the standard material platform for exterior panels, interior trim, underbody components, and increasingly, structural elements. The global polymer composites sector benefits from continuous innovation by leading companies such as Toray Industries, Hexcel Corporation, and Teijin Limited, who are investing heavily in next-generation prepreg and out-of-autoclave PMC technologies. Metal Matrix Composites (MMC) are the fastest-growing segment, gaining traction in brake systems, engine components, and EV motor housings where high thermal conductivity and wear resistance are critical.
Application Insights
Exterior applications led the automotive composites market by application segment, accounting for approximately 40% of the total market share in 2025. Exterior composite components, including hoods, fenders, door panels, bumper fascias, roof panels, and tailgates, represent the most mature and widespread application domain for automotive composites. The aesthetic versatility of composites, allowing complex geometries, class-A surface finishes, and design differentiation, has made them particularly attractive to OEMs seeking to brand premium and performance vehicles. BMW, Audi, and Lamborghini have extensively utilized exterior composites as part of their lightweight design philosophies, with carbon fiber hoods offering weight savings of up to 50% over steel equivalents. Structural applications represent the fastest-growing segment driven by rising safety demands and EV lightweighting requirements.
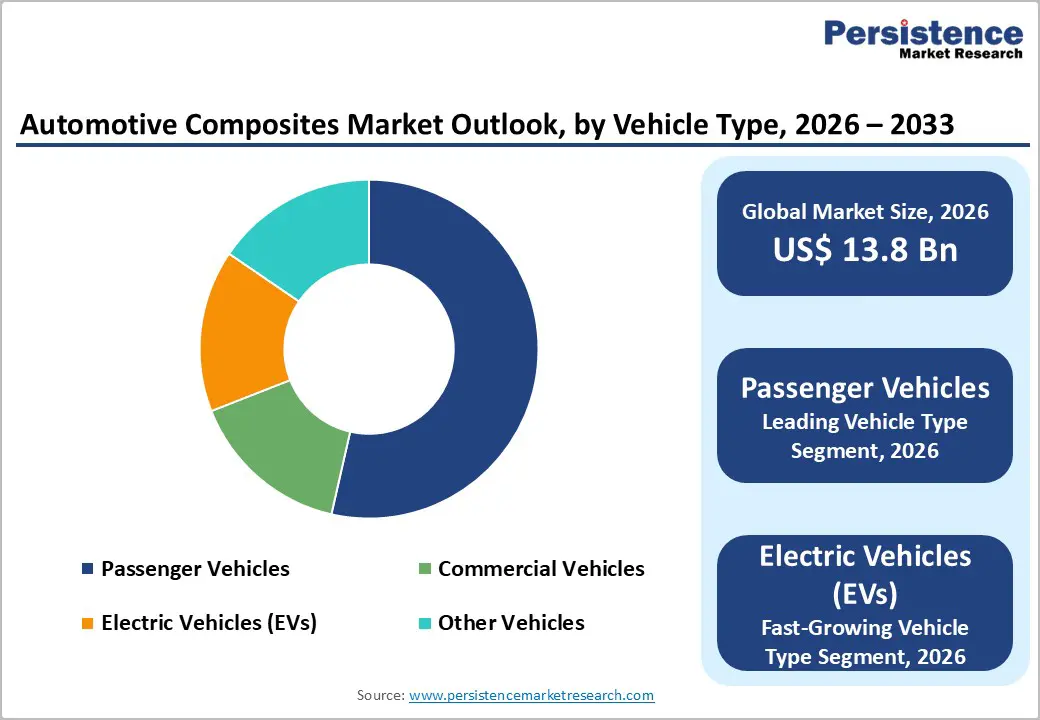
Vehicle Type Insights
Passenger vehicles dominated the Automotive Composites Market by vehicle type, holding approximately 57% of the total market share in 2025. The passenger vehicle segment’s leadership is underpinned by the sheer volume of global production, with the International Organization of Motor Vehicle Manufacturers (OICA) reporting global passenger car production of approximately 67 million units in 2023, and the intensifying pressure on automakers to reduce vehicle weight to meet emissions and fuel economy targets. Composites are integrated across a wide range of passenger vehicle applications, from exterior body panels and interior door modules to structural reinforcements and underbody aero shields. The premium and performance passenger car sub-segments, including electric sedans and SUVs from Tesla, BMW, and Mercedes-Benz, are accelerating adoption of carbon fiber and hybrid composite systems. Electric Vehicles (EVs) represent the fastest-growing vehicle type segment, with EV-specific composite demand expected to grow at a significantly higher CAGR of approximately 17-18% through 2033 as battery enclosure and chassis lightweighting become engineering imperatives.
Regional Insights
North America Automotive Composites Market Trends and Insights
North America held approximately 28% of the global Automotive Composites Market share in 2025, with the United States serving as the regional engine of demand. The U.S. market benefits from a robust automotive manufacturing ecosystem centered in the Midwest, including Michigan, home to the Big Three automakers General Motors, Ford, and Stellantis, all of which have made significant commitments to electrification and lightweight vehicle architectures. The U.S. Department of Energy’s (DOE) Vehicle Technologies Office has actively funded composite research through programs such as the Institute for Advanced Composites Manufacturing Innovation (IACMI), which has catalyzed collaboration between universities, national laboratories, and industry to accelerate composite adoption and reduce CFRP costs.
The regulatory landscape under the EPA’s revised CAFE standards and the Inflation Reduction Act’s (IRA) EV incentive provisions is compelling OEMs and Tier-1 suppliers to accelerate composite integration into both ICE and electric vehicle platforms. North American composite suppliers, including Hexcel Corporation and UFP Technologies, are expanding production capacities and developing faster-cure composite systems specifically tailored for high-volume automotive production.
Europe Automotive Composites Market Trends and Insights
Europe led the global Automotive Composites Market with approximately 33% market share in 2025, underpinned by the region’s premium automotive manufacturing heritage and stringent environmental regulatory framework. Germany remains the epicenter of European composite automotive activity, with BMW, Mercedes-Benz, Audi (Volkswagen Group), and Porsche consistently integrating advanced composite technologies into their vehicle lineups. The EU’s CO2 fleet emission regulation requiring 93.6 g CO2/km by 2030 is a structural driver compelling all European automakers to adopt lightweighting solutions, with composites being central to these strategies. SGL Carbon SE and Solvay S.A. are among the key regional producers investing in scalable carbon fiber and high-performance thermoset systems catering to both premium and mainstream automotive platforms.
In the United Kingdom, France, and Spain, automotive composites demand is being supported by growing EV production investments and supply chain localization efforts under national industrial strategies. France’s EV manufacturing incentive framework and UK’s Zero Emission Vehicle (ZEV) mandate, requiring 22% of new car sales to be zero-emission by 2024, are directly stimulating composite demand. The region is also witnessing growing interest in bio-based composites as European OEMs seek to align with the EU Green Deal and circular economy targets, with natural fiber composites gaining ground particularly in interior trim applications. Regulatory harmonization across the European Single Market further streamlines composite adoption by reducing fragmented compliance burdens for multi-country supply chains.
Asia Pacific Automotive Composites Market Trends and Insights
Asia Pacific is the fastest-growing regional market for automotive composites, expected to register a CAGR of approximately 13.5% between 2026 and 2033, driven by explosive EV production growth, rapidly expanding automotive manufacturing capacity, and increasing domestic investment in advanced materials. China is the dominant force in the region, having produced over 30 million motor vehicles in 2023 according to the China Association of Automobile Manufacturers (CAAM), with a significant and growing proportion being new energy vehicles (NEVs). Chinese automakers including BYD, NIO, Li Auto, and SAIC are increasingly integrating composites, particularly glass fiber-reinforced thermoplastics, into their EV platforms for body panels, battery enclosures, and structural components. Toray Industries and Mitsubishi Chemical Group, both headquartered in Japan, are major global composite suppliers investing in next-generation carbon fiber production technologies to serve both domestic and international automotive demand.
India represents an important emerging market, with the Society of Indian Automobile Manufacturers (SIAM) projecting sustained growth in domestic vehicle production supported by government policies under the Production Linked Incentive (PLI) Scheme for the Automotive Sector. The cost-competitive manufacturing environment in India, Thailand, and Vietnam is attracting composite component manufacturing investment from both global Tier-1 suppliers and domestic players. Asia Pacific’s combination of volume-driven demand, cost-efficient production, and EV leadership positions it as the most dynamic growth frontier for automotive composites through 2033.
Competitive Landscape
The global Automotive Composites Market demonstrates a moderately consolidated structure, characterized by the presence of vertically integrated material suppliers alongside specialized composite part manufacturers. Upstream participants primarily control carbon fiber production, resin chemistries, and engineered reinforcement systems, while midstream and downstream players focus on component fabrication, module assembly, and systems integration. Competitive positioning is largely influenced by technological capabilities, scale of operations, and long-term supply agreements with automotive OEMs.
Strategically, market participants are investing heavily in automated, high-throughput manufacturing processes such as HP-RTM and thermoplastic compression molding to enable cost-efficient mass production. Companies are also strengthening their portfolios through R&D in recyclable thermosets, bio-based matrices, and hybrid composite structures to align with sustainability mandates. Partnerships and co-development agreements with OEMs are increasingly common, allowing risk-sharing, faster product commercialization, and improved integration of composites into structural and battery-related vehicle platforms.
Key Developments:
- November, 2024: Toray Advanced Composites expanded its continuous fiber reinforced thermoplastic composite product portfolio by acquiring Gordon Plastics’ assets, technologies, and IP to boost development, testing, and production capacity in Colorado.
- June, 2025: BMW Group announced it will introduce Bcomp’s high-performance natural fiber composites in series-production vehicles to replace some carbon fiber parts and reduce CO2e emissions in future models.
- August, 2025: SGL Carbon announced it is manufacturing natural-fiber prepregs from flax for motorsports use, supplying these sustainable composite materials for a Toyota Hilux body competing in the Asia Cross Country Rally.
Companies Covered in Automotive Composites Market
- Toray Industries, Inc.
- Teijin Limited
- Mitsubishi Chemical Group
- Solvay S.A.
- SGL Carbon SE
- Hexcel Corporation
- Owens Corning
- Gurit Holding AG
- IDI Composites International
- Formaplex Technologies Ltd
- RTP Company
- Plasan Carbon Composites
- UFP Technologies, Inc.
- Huntsman International LLC
- Quantum Composites
- Sika AG
- Covestro AG
- Scott Bader Company Ltd
- Cytec Industries Inc. (Solvay)
- Porcher Industries
Frequently Asked Questions
The automotive composites market is projected to reach US$ 13.8 billion in 2026, growing from US$ 6.9 billion in 2020 at a historical CAGR of 12.3% between 2020 and 2025.
Demand is driven by stringent fuel economy and CO2 emission regulations, including EU and U.S. CAFE standards, along with rapid electric vehicle production and the need for 25-50% vehicle weight reduction versus steel.
Europe leads the market with around 33% share in 2025, supported by strong premium OEM presence, strict EU emission regulations, and a well-established regional composite manufacturing base.
Key opportunities lie in structural applications such as pillars, crash systems, and battery enclosures, supported by scalable technologies like HP-RTM and thermoplastic molding, alongside rising demand for bio-based composites.
Major players include Toray Industries, Teijin Limited, Mitsubishi Chemical Group, Solvay S.A., SGL Carbon SE, Hexcel Corporation, Owens Corning, Gurit Holding AG, IDI Composites International, and others competing on performance, scale, cost, and sustainability.


