

- Executive Summary
- Global Artificial Food Color Market Snapshot, 2026 and 2033
- Market Opportunity Assessment, 2026 – 2033, US$ Bn
- Key Market Trends
- Future Market Projections
- Premium Market Insights
- Industry Developments and Key Market Events
- PMR Analysis and Recommendations
- Market Overview
- Market Scope and Definition
- Market Dynamics
- Drivers
- Restraints
- Opportunity
- Key Trends
- Macro-economic Factors
- Global Sectoral Outlook
- Global GDP Growth Outlook
- COVID-19 Impact Analysis
- Forecast Factors – Relevance and Impact
- Value Added Insights
- Tool Adoption Analysis
- Regulatory Landscape
- Value Chain Analysis
- PESTLE Analysis
- Porter’s Five Force Analysis
- Price Analysis, 2026A
- Key Highlights
- Key Factors Impacting Deployment Costs
- Pricing Analysis, By Application
- Global Artificial Food Color Market Outlook
- Key Highlights
- Market Volume (Units) Projections
- Market Size (US$ Bn) and Y-o-Y Growth
- Absolute $ Opportunity
- Market Size (US$ Bn) and Volume (Units) Analysis and Forecast
- Historical Market Size (US$ Bn) Analysis, 2026-2026
- Market Size (US$ Bn) Analysis and Forecast, 2026 – 2033
- Global Artificial Food Color Market Outlook: Product Type
- Introduction / Key Findings
- Historical Market Size (US$ Bn) and Volume (Units) Analysis, By Product Type, 2026 – 2026
- Market Size (US$ Bn) and Volume (Units) Analysis and Forecast, By Product Type, 2026 – 2033
- Pigments
- Dyes
- Market Attractiveness Analysis: Product Type
- Global Artificial Food Color Market Outlook: Color
- Introduction / Key Findings
- Historical Market Size (US$ Bn) Analysis, By Color, 2026 – 2026
- Market Size (US$ Bn) Analysis and Forecast, By Color, 2026 – 2033
- Red
- Blue
- Yellow
- Green
- Others
- Market Attractiveness Analysis: Color
- Global Artificial Food Color Market Outlook: Application
- Introduction / Key Findings
- Historical Market Size (US$ Bn) Analysis, By Application, 2026 – 2026
- Market Size (US$ Bn) Analysis and Forecast, By Application, 2026 – 2033
- Beverages
- Bakery
- Confectionery
- Dairy
- Meat Products
- Processed Foods
- Others
- Market Attractiveness Analysis: Application
- Key Highlights
- Global Artificial Food Color Market Outlook: Region
- Key Highlights
- Historical Market Size (US$ Bn) and Volume (Units) Analysis, By Region, 2026 – 2026
- Market Size (US$ Bn) and Volume (Units) Analysis and Forecast, By Region, 2026 – 2033
- North America
- Europe
- East Asia
- South Asia and Oceania
- Latin America
- Middle East & Africa
- Market Attractiveness Analysis: Region
- North America Artificial Food Color Market Outlook
- Key Highlights
- Historical Market Size (US$ Bn) Analysis, By Market, 2026 – 2026
- By Country
- By Product Type
- By Color
- By Application
- Market Size (US$ Bn) Analysis and Forecast, By Country, 2026 – 2033
- U.S.
- Canada
- Market Size (US$ Bn) and Volume (Units) Analysis and Forecast, By Product Type, 2026 – 2033
- Pigments
- Dyes
- Market Size (US$ Bn) Analysis and Forecast, By Color, 2026 – 2033
- Red
- Blue
- Yellow
- Green
- Others
- Market Size (US$ Bn) Analysis and Forecast, By Application, 2026-2033
- Beverages
- Bakery
- Confectionery
- Dairy
- Meat Products
- Processed Foods
- Others
- Market Attractiveness Analysis
- Europe Artificial Food Color Market Outlook
- Key Highlights
- Historical Market Size (US$ Bn) Analysis, By Market, 2026 – 2026
- By Country
- By Product Type
- By Color
- Application
- Market Size (US$ Bn) Analysis and Forecast, By Country, 2026 – 2033
- Germany
- France
- U.K.
- Italy
- Spain
- Russia
- Türkiye
- Rest of Europe
- Market Size (US$ Bn) and Volume (Units) Analysis and Forecast, By Product Type, 2026 – 2033
- Pigments
- Dyes
- Market Size (US$ Bn) Analysis and Forecast, By Color, 2026 – 2033
- Red
- Blue
- Yellow
- Green
- Others
- Market Size (US$ Bn) Analysis and Forecast, By Application, 2026-2033
- Beverages
- Bakery
- Confectionery
- Dairy
- Meat Products
- Processed Foods
- Others
- Market Attractiveness Analysis
- East Asia Artificial Food Color Market Outlook
- Key Highlights
- Historical Market Size (US$ Bn) Analysis, By Market, 2026 – 2026
- By Country
- By Product Type
- By Color
- By Application
- Market Size (US$ Bn) Analysis and Forecast, By Country, 2026 – 2033
- China
- Japan
- South Korea
- Market Size (US$ Bn) and Volume (Units) Analysis and Forecast, By Product Type, 2026 – 2033
- Pigments
- Dyes
- Market Size (US$ Bn) Analysis and Forecast, By Color, 2026 – 2033
- Red
- Blue
- Yellow
- Green
- Others
- Market Size (US$ Bn) Analysis and Forecast, By Application, 2026-2033
- Beverages
- Bakery
- Confectionery
- Dairy
- Meat Products
- Processed Foods
- Others
- Market Attractiveness Analysis
- South Asia & Oceania Artificial Food Color Market Outlook
- Key Highlights
- Historical Market Size (US$ Bn) Analysis, By Market, 2026 – 2026
- By Country
- By Product Type
- By Color
- By Application
- Market Size (US$ Bn) Analysis and Forecast, By Country, 2026 – 2033
- India
- Southeast Asia
- ANZ
- Rest of South Asia & Oceania
- Market Size (US$ Bn) and Volume (Units) Analysis and Forecast, By Product Type, 2026 – 2033
- Pigments
- Dyes
- Market Size (US$ Bn) Analysis and Forecast, By Color, 2026 – 2033
- Red
- Blue
- Yellow
- Green
- Others
- Market Size (US$ Bn) Analysis and Forecast, By Application, 2026-2033
- Beverages
- Bakery
- Confectionery
- Dairy
- Meat Products
- Processed Foods
- Others
- Market Attractiveness Analysis
- Latin America Artificial Food Color Market Outlook
- Key Highlights
- Historical Market Size (US$ Bn) Analysis, By Market, 2026 – 2026
- By Country
- By Product Type
- By Color
- By Application
- Market Size (US$ Bn) Analysis and Forecast, By Country, 2026 – 2033
- Brazil
- Mexico
- Rest of Latin America
- Market Size (US$ Bn) and Volume (Units) Analysis and Forecast, By Product Type, 2026 – 2033
- Pigments
- Dyes
- Market Size (US$ Bn) Analysis and Forecast, By Color, 2026 – 2033
- Red
- Blue
- Yellow
- Green
- Others
- Market Size (US$ Bn) Analysis and Forecast, By Application, 2026-2033
- Beverages
- Bakery
- Confectionery
- Dairy
- Meat Products
- Processed Foods
- Others
- Market Attractiveness Analysis
- Middle East & Africa Artificial Food Color Market Outlook
- Key Highlights
- Historical Market Size (US$ Bn) Analysis, By Market, 2026 – 2026
- By Country
- By Product Type
- By Color
- By Application
- Market Size (US$ Bn) Analysis and Forecast, By Country, 2026 – 2033
- GCC Countries
- Egypt
- South Africa
- Northern Africa
- Rest of Middle East & Africa
- Market Size (US$ Bn) and Volume (Units) Analysis and Forecast, By Product Type, 2026 – 2033
- Pigments
- Dyes
- Market Size (US$ Bn) Analysis and Forecast, By Color, 2026 – 2033
- Red
- Blue
- Yellow
- Green
- Others
- Market Size (US$ Bn) Analysis and Forecast, By Application, 2026-2033
- Beverages
- Bakery
- Confectionery
- Dairy
- Meat Products
- Processed Foods
- Others
- Market Attractiveness Analysis
- Competition Landscape
- Market Share Analysis, 2026
- Market Structure
- Competition Intensity Mapping By Market
- Competition Dashboard
- Company Profiles (Details – Overview, Financials, Strategy, Recent Developments)
- Sensient Technologies
- Overview
- Segments and Deployments
- Key Financials
- Market Developments
- Market Strategy
- ADM
- Givaudan
- BASF SE
- Chr. Hansen
- DSM-Firmenich
- Kalsec Inc.
- Roha Group
- San-Ei Gen F.F.I.
- DIC Corporation
- IFC Solutions
- Vinayak Ingredients
- Aarkay Food Products
- Sensient Technologies
- Appendix
- Research Methodology
- Research Assumptions
- Acronyms and Abbreviations


- Food Ingredients & Additives
- Artificial Food Color Market
Artificial Food Color Market Size, Share, and Growth Forecast, 2026-2033
Artificial Food Color Market by Product type (Pigment, Dyes), Color (Yellow, Blue, Red, Green, Others), Application (Dairy, Beverage, Bakery, Confectionery, Meat Products, Processed Food, Others), and Regional Analysis for 2026-2033
Key Industry Highlights
- Dominant Product Type: Pigments are projected to account for approximately 55% of revenue in 2026, owing to their stability in processed foods, whereas dyes are expected to grow the fastest at a 6.1% CAGR during 2026–2033, driven by beverage and dairy drink applications.
- Leading Color: Red colors are projected to dominate, with an estimated 30% share in 2026, reflecting their broad usage across beverages and confectionery, whereas blue colors are forecast to experience the highest growth during 2026-2033, supported by energy and sports drink demand.
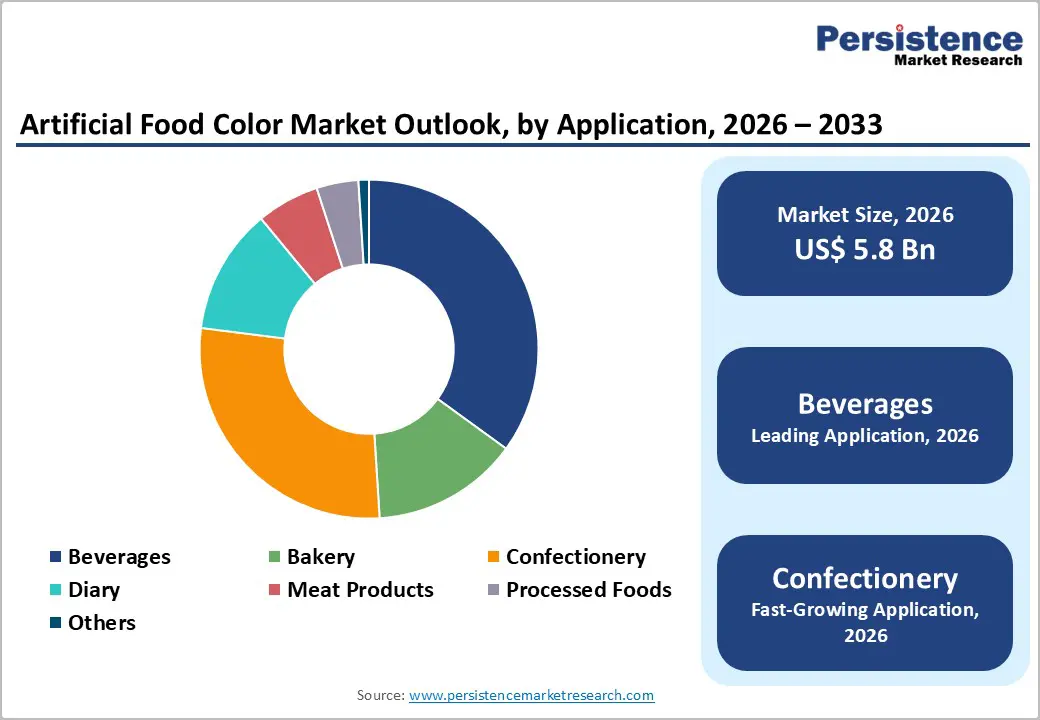
- Dominant Application Area: Beverages are set to remain the largest application segment, accounting for approximately 35% of market revenue in 2026, while confectionery is expected to be the fastest-growing application at a 6.3% CAGR during 2026–2033.
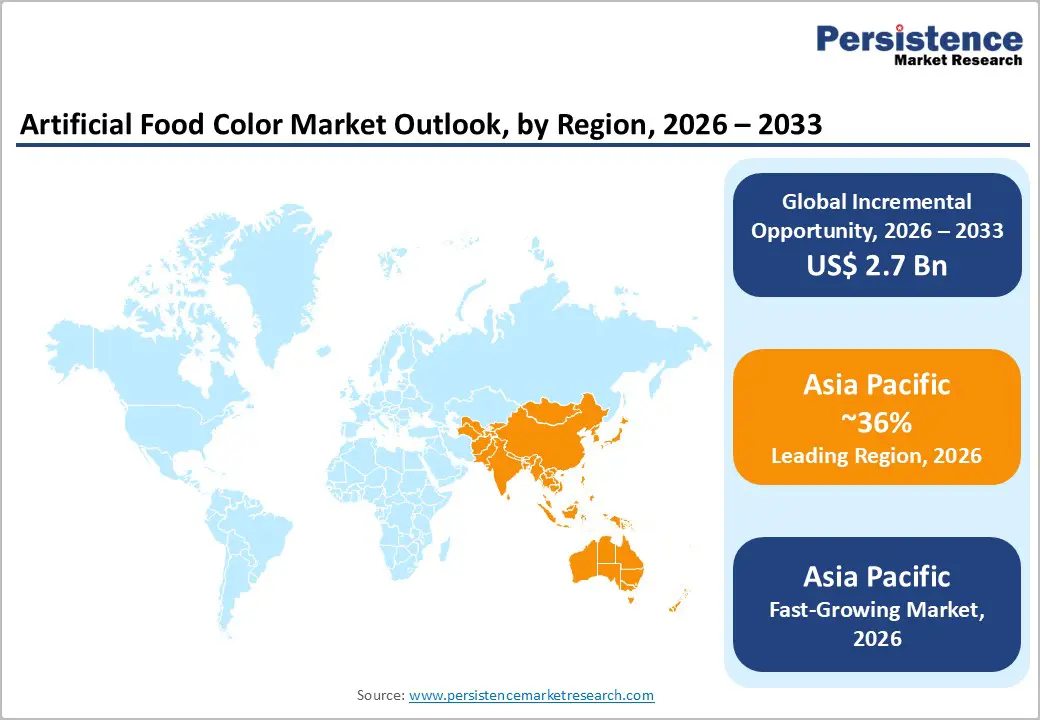
- Regional Growth Leadership: Asia-Pacific is expected to be the fastest-growing market, with a CAGR of approximately 6.7% through 2033, driven by food-processing expansion in China, India, and Southeast Asia.
- Competitive and Innovation Landscape: Competition increasingly centers on regulatory-compliant synthetic color innovations, alongside capacity expansions in the Asia Pacific.
| Key Insights | Details |
|---|---|
|
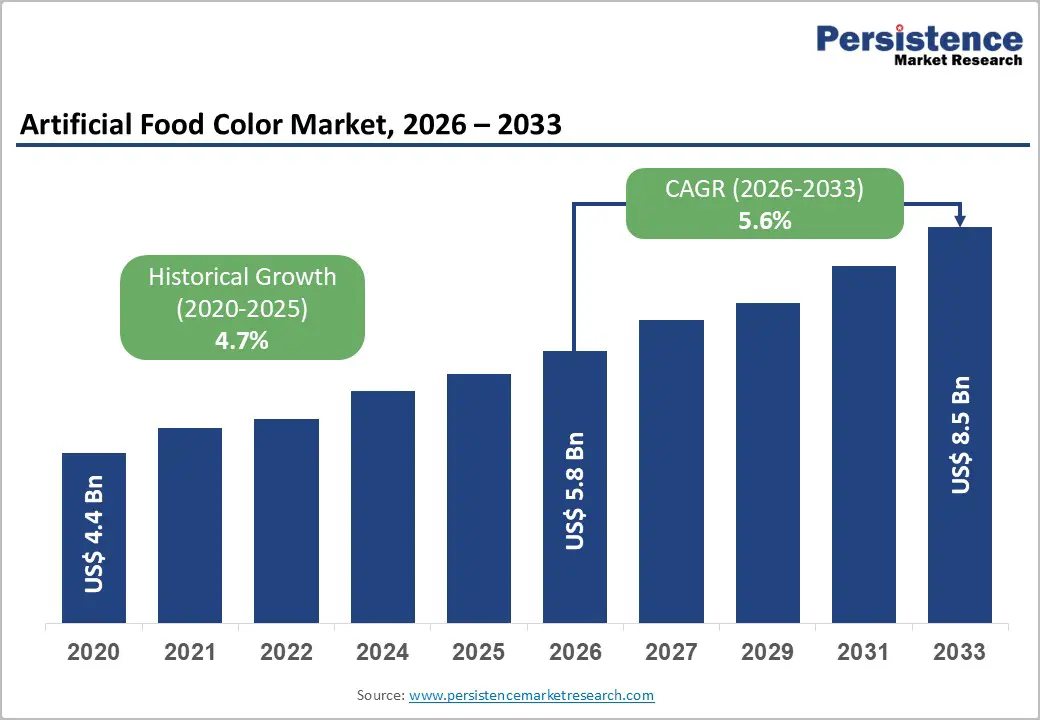
Artificial Food Color Market Size (2026E) |
US$ 5.8 Bn |
|
Market Value Forecast (2033F) |
US$ 8.5 Bn |
|
Projected Growth (CAGR 2026 to 2033) |
5.6% |
|
Historical Market Growth (CAGR 2020 to 2025) |
4.7% |
Market Factors – Growth, Barriers, and Opportunity Analysis
Expansion of Processed Food and Beverage Consumption Supported by Cost-Efficient Color Solutions
The consumption of processed and packaged foods continues to rise, driven by urbanization, busier lifestyles, and increasing demand for convenience products. Artificial food colors are extensively used in bakery items, dairy desserts, confectionery, and ready-to-eat meals due to their thermal stability, uniform appearance, and reliability during large-scale processing. Companies such as Nestlé, Mondelez International, PepsiCo, and General Mills expanded or optimized production lines for packaged snacks, frozen foods, and desserts across Asia and Latin America, thereby reinforcing demand for color solutions that remain stable during baking, freezing, and extended storage.
The beverage industry further amplifies this driver through frequent product launches and high-volume manufacturing requirements. Carbonated soft drinks, energy drinks, flavored waters, and functional beverages rely heavily on artificial colors because of their high solubility, visual intensity, and resistance to light and temperature degradation. Beverage manufacturers, including The Coca-Cola Company, PepsiCo, Red Bull, and Suntory, introduced new flavour variants and limited-edition products across the U.S., India, and Southeast Asia, where synthetic dyes ensured consistent color reproduction across markets. Additionally, artificial colors remain widely used in price-sensitive beverage categories because they offer cost-efficient formulations and predictable performance, thereby supporting scalable production while maintaining a brand-consistent visual appeal.
Regulatory Pressure and Accelerating Shift toward Clean-Label Food Products
Food safety authorities such as the European Food Safety Authority (EFSA) and the U.S. Food and Drug Administration (FDA) have tightened permissible limits and labeling requirements for specific artificial colors, including Red 40 and Yellow 5. These changes led to compliance-related reformulation costs rising by 8–12% for mid-sized manufacturers in Europe, increasing operational and regulatory burdens. Mandatory warning labels introduced in select European Union (EU) markets have also elevated reputational risk for food brands, particularly those positioned in premium or health-oriented categories, thereby constraining the use of artificial colors in certain applications.
At the same time, consumer preferences are increasingly shifting toward clean-label and minimally processed foods. Nearly 62% of consumers actively avoided artificial additives when alternatives were available, prompting manufacturers to reassess ingredient strategies. This trend has led to partial substitution of artificial colors with natural alternatives, particularly in premium dairy, infant nutrition, and wellness-focused products. While demand for artificial colors remains stable in mass-market segments, this structural shift limits pricing flexibility and slows adoption in developed markets, creating longer-term substitution risks for synthetic color suppliers.
Expansion of Food Manufacturing and Adoption of Cost-Optimized Color Solutions
Food manufacturing capacity is expanding rapidly across the Asia Pacific, Latin America, and Africa, creating strong incremental demand for artificial food colors. In the Asia Pacific, food manufacturing output grew at a rapid pace, reflecting rising urban consumption and investment in local processing infrastructure. Artificial colors are widely adopted in these markets due to their affordability, consistent quality, and reliable supply chains, which are critical for high-volume production. According to the Ministry of Food Processing Industries, India alone added more than 42,000 new food processing units between 2021 and 2025, thereby significantly increasing downstream demand for scalable and cost-efficient color solutions across bakery, beverages, and processed foods.
Advances in synthetic color technology and shifts in retail dynamics are creating new growth opportunities. Manufacturers introduced low-residue and higher-purity synthetic dyes aligned with updated safety thresholds, thereby reducing health-related concerns while preserving performance benefits. These next-generation formulations are gaining traction in reformulated beverages and confectionery products. In parallel, the expansion of private-label brands and mass retail formats, which accounted for 22% of global packaged food sales, is increasing demand for cost-optimized ingredients, strengthening long-term volume visibility for artificial food color suppliers operating at scale.
Category-wise Analysis
Product Type Insights
Pigments are projected to remain the dominant product type, accounting for approximately 55% of artificial food color market revenues in 2026, owing to their extensive use in bakery, confectionery, and processed food applications that require opacity, heat stability, and consistent color retention. Forecast trends suggest pigments will continue to anchor market volumes, particularly in products subjected to high-temperature processing or large-scale industrial production. Pepsi Lipton International upgraded pigment-based systems in its baked snack lines across Southeast Asia, while Unilever integrated pigment solutions in frozen dessert manufacturing to ensure uniform appearance across distribution networks. Such developments indicate a continued reliance on pigments for high-volume, stable applications.
Dyes are projected to be the fastest-growing product type, with a CAGR of approximately 6.1% over the 2026–2033 forecast period, driven by expanding beverage and dairy drink formulations. Dyes are preferred for liquid applications that require high solubility and bright color expression, thereby enabling a uniform appearance across batch volumes. For example, CavinKare launched orange cream and malt-based beverages using dye-based color solutions to ensure visual consistency, while Ocean Spray introduced powdered drink mixes optimized for a vibrant liquid appearance upon reconstitution. Market forecasts suggest the adoption of dyes will continue to accelerate in liquid-centric food and beverage products due to these operational advantages.
Color Insights
Red colors are projected to maintain their leading share, accounting for approximately 30% of total market demand in 2026, supported by broad applicability across beverages, confectionery, and processed meats. Red shades are expected to remain preferred due to regulatory acceptance, consumer recognition, and versatility across multiple product matrices, ensuring sustained market volumes. Reliance Consumer Products’ Campa Cola launched SKUs with red-tinted formulations in the UAE, while Ferrara’s SweetTARTS Gummy Halos introduced red variants in confectionery lines, reflecting continued reliance on red colorants to enhance product appeal. Forecasts indicate that red will remain the dominant color in standardized and mass-market applications.
Blue colors are projected to be the fastest-growing color segment, with an estimated 6.4% CAGR during 2026–2033, driven by energy drinks, sports beverages, and novelty confectionery. Blue shades are anticipated to be increasingly adopted for visual differentiation and modern branding, particularly in youth-oriented product launches. Trolli expanded its Sour Brite Squad gummies with new blue variants, while emerging functional beverages in East Asia leveraged blue colorants to signal innovation and freshness. Market projections suggest blue colors will continue to outperform other segments in growth, reflecting evolving consumer preferences and product differentiation trends.
Application Insights
Beverages are projected to remain the largest application segment in 2026, accounting for approximately 35% of the artificial food color market, driven by high consumption, frequent innovation, and the need for visual consistency across brands. Artificial colors are expected to remain integral for brand identity and product differentiation, particularly in carbonated drinks, flavored waters, and functional beverages. In 2025, Ocean Spray introduced cranberry-based powdered mixes designed to deliver vibrant color upon preparation, while Faygo Beverages expanded flavour portfolios featuring distinct color profiles for shelf differentiation. Forecasts indicate that beverage applications will continue to account for the dominant share of revenue throughout the projection period.
Confectionery is projected to be the fastest-growing application segment, with an approximate 6.3% CAGR between 2026 and 2033, driven by impulse consumption, premiumization, and seasonal product launches. Artificial colors are expected to play a key role in delivering bright, consistent shades across high-volume production runs. Mars Incorporated unveiled Halloween-themed M&M’s, Starburst, and Skittles packs with bold multi-color designs, while SweeTARTS launched Gummy Halos with layered red and blue elements. Market forecasts indicate that seasonal and novelty-driven confectionery launches will continue to strengthen the adoption of artificial colors, supporting accelerated growth in this segment.
Regional Insights
North America Artificial Food Color Market Trends
The North America market is led by the United States, supported by a highly developed food processing ecosystem and robust regulatory oversight from the FDA. The beverage and confectionery industries are remaining the primary revenue contributors, as manufacturers are relying on artificial food colours to maintain brand consistency and visual differentiation across large product portfolios. Major food and beverage companies are continuing to launch flavored drinks and confectionery variants that require stable and reproducible colour performance for high-volume production. Innovation across the region is focusing on compliance-friendly formulations that are suitable for industrial-scale processing while meeting labeling and safety requirements. Artificial colours are therefore remaining integral to bakery products, packaged snacks, and processed foods, where colour uniformity is directly linked to consumer perception and brand recognition.
Artificial food colours are also increasingly supporting functional beverages and premium dessert offerings in the region, where visual identity is reinforcing brand positioning and product differentiation. Manufacturers are optimizing pigment and dye usage to comply with labeling thresholds while preserving visual intensity and shelf-life stability. Seasonal launches and limited-edition beverages and confectionery products are continuing to stimulate incremental demand, particularly in mature retail channels. The region benefits from well-established distribution networks, predictable regulatory enforcement, and high consumer familiarity with synthetic colour applications. Innovation is prioritizing cost-effective and high-performance solutions that align with operational efficiency targets. As a result, North America remains a mature yet revenue-leading market, characterized by stable adoption patterns and limited structural volatility.
Europe Artificial Food Color Market Trends
The market for artificial food color in Europe is spearheaded by Germany, the United Kingdom, France, and Spain, with demand shaped by harmonized regulation under the EFSA. Bakery, confectionery, and processed food categories continue to anchor consumption, as manufacturers prioritize colour consistency and shelf-life stability across large product portfolios. Artificial colours are remaining essential for premium and high-quality offerings where visual uniformity supports brand positioning and consumer recognition. Food producers are increasingly focusing on compliant and low-residue formulations that align with regional safety thresholds while maintaining performance in high-throughput production environments. Seasonal product launches further reinforce adoption, particularly in confectionery and baked goods, while well-established manufacturing and retail networks support market continuity and supply reliability.
Despite relatively slow volume growth, artificial food colours continue to be widely used in processed food and confectionery applications in Europe. Manufacturers are optimizing colour retention and stability for long shelf-life products, including ready-to-eat desserts and packaged snacks, where visual appeal remains a key purchase driver. Consumer expectations regarding safety and product quality continue to influence formulation innovation, encouraging suppliers to refine performance within regulatory limits rather than pursue substitution at scale. Seasonal confectionery ranges and limited-edition chocolate collections are sustaining incremental demand throughout the year. As a result, Europe is maintaining steady and predictable consumption patterns, supported by strong operational expertise and consistent regulatory enforcement across mature and highly regulated markets.
Asia Pacific Artificial Food Color Market Trends
Asia Pacific is projected to remain the fastest-growing regional market, expanding at an estimated CAGR of 6.7% through 2033 and holding approximately 36% of the artificial food color market share in 2026. Growth is being supported by rapid urbanization, rising disposable incomes, and sustained increases in demand for convenience foods and ready-to-drink beverages. China and India are continuing to dominate regional consumption due to large populations and expanding packaged food industries, while ASEAN markets are emerging as high-growth contributors. These countries are benefiting from low-cost manufacturing bases, flexible production capacities, and comparatively permissive regulatory environments. Artificial food colours are therefore being widely adopted across bakery, beverage, and confectionery categories to meet rising consumer demand for visually appealing and standardized products.
Regional food manufacturers are actively expanding product portfolios and processing capacity, which is reinforcing demand for cost-efficient and high-performance synthetic colour solutions. Leading producers are introducing dairy-based beverages, flavored drinks, and confectionery products that rely on artificial colours to achieve uniform appearance and strong shelf stability. Investments in local food-processing facilities and packaged-beverage lines are enhancing scalability and supply responsiveness across urban and semi-urban markets. Manufacturers are continuing to refine formulations that balance affordability with visual intensity and regulatory compliance. Urban consumption patterns, seasonal product introductions, and the rapid expansion of modern retail channels are expected to sustain high adoption levels. As packaged food penetration continues to rise, Asia-Pacific’s cost advantages and volume-driven growth dynamics position the region as the most strategically important growth market for artificial food colours over the forecast period.
Competitive Landscape
The global artificial food color market structure is moderately consolidated, with Chr. Hansen, Sensient Technologies, DIC Corporation, GNT Group, and Kerry Group collectively controlling a significant portion of revenue. These established companies leverage extensive relationships with multinational food and beverage manufacturers, regulatory expertise, and diversified portfolios of pigment and dye solutions. Heavy investment in research & development (R&D) for compliance-friendly, high-stability, and low-residue formulations allows them to maintain technological leadership and meet evolving safety and labelling standards.
Regional and niche competitors, such as Sensient India and Kikkoman Biochemifa, focus on specialized applications and emerging-market strongholds. Market entry barriers include stringent regulatory compliance, quality standards, and high formulation expertise, limiting smaller entrants. However, innovation trends, including the development of next-generation synthetic colors, digital formulation platforms, and integration with private-label manufacturers, are enabling broader participation. Market consolidation is expected to increase gradually as global leaders acquire regional suppliers or form strategic partnerships to expand geographically and technologically, while maintaining a focus on cost-efficient, visually stable, and regulatory-compliant solutions.
Key Industry Developments
- In January 2026, Sensient Food Colors enhanced safety during the U.S. food and beverage industry’s shift to natural colorants with its Certasure™ food safety program, which applies stringent testing, vendor certification, and full traceability to plant-derived colors to ensure they meet quality and authenticity requirements. The initiative is helping manufacturers innovate with confidence in natural food colors amid the absence of defined regulatory standards.
- In May 2025, the U.S. FDA approved three natural color additives sourced from flowers, algae, and other botanical materials, expanding the palette available to food manufacturers amid industry efforts to reduce reliance on artificial dyes. The agency’s action is part of a broader push encouraging the food sector to voluntarily phase out petroleum-based synthetic colors before the end of 2026.
- In May 2025, the Chinese government issued the mandatory industry standard QB/T 6500–2024, which requires that all food colorings be derived from edible plant-based sources such as fruits, vegetables, plants, or algae. The regulation mandates production using physical processing only, eliminating chemical solvents. Products are now classified as “coloring food ingredients” instead of food additives, enabling transparent labeling like “carrot coloring ingredient.”
Companies Covered in Artificial Food Color Market
- ABB Ltd.
- Siemens AG
- Alstom Grid
- Eaton Corporation
- Schneider Electric SE
- Hitachi Energy
- Mitsubishi Electric Corporation
- GE Grid Solutions
- Parker Hannifin Corporation
- Schweitzer Engineering Laboratories, Inc.
- NARI Technology Co., Ltd.
- Guodian Electric Co., Ltd.
- Nozomi Networks, Inc.
- Cisco Systems, Inc.
- Ericsson
Frequently Asked Questions
The global artificial food color market is projected to reach US$ 5.8 billion in 2026.
The market is driven by rising consumption of processed foods and beverages, coupled with cost-effective, high-performance synthetic color solutions.
The market is poised to witness a CAGR of 5.6% from 2026 to 2033.
Key opportunities include private-label expansion, and development of safer, regulatory-compliant synthetic color formulations.
Some of the leading players in the market include Chr. Hansen, Sensient Technologies, DIC Corporation, GNT Group, and Kerry Group.


