


- Executive Summary
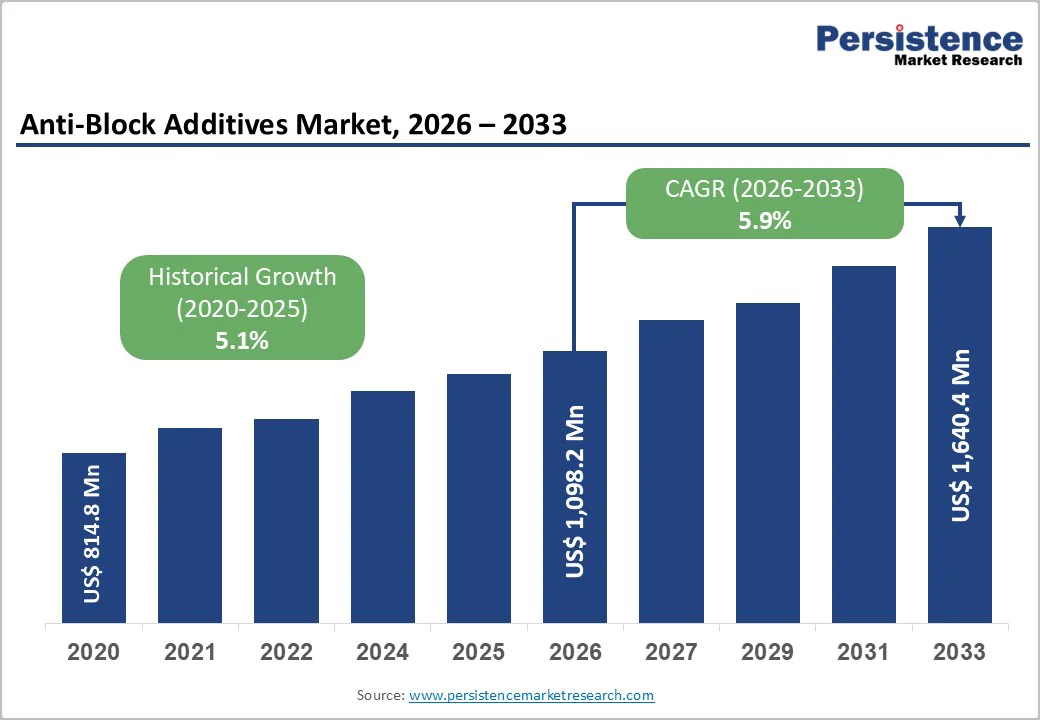
- Global Anti-Block Additives Market Snapshot 2026 and 2033
- Market Opportunity Assessment, 2026 - 2033, US$ Mn
- Key Market Trends
- Industry Developments and Key Market Events
- Demand Side and Supply Side Analysis
- PMR Analysis and Recommendations
- Market Overview
- Market Scope and Definitions
- Value Chain Analysis
- Macro-Economic Factors
- Global GDP Outlook
- Global Packaging Industry Overview
- Global Chemical Industry Overview
- Forecast Factors - Relevance and Impact
- COVID-19 Impact Assessment
- PESTLE Analysis
- Porter's Five Forces Analysis
- Geopolitical Tensions: Market Impact
- Regulatory and Technology Landscape
- Market Dynamics
- Drivers
- Restraints
- Opportunities
- Trends
- Price Trend Analysis, 2020 - 2033
- Region-wise Price Analysis
- Price by Segments
- Price Impact Factors
- Global Anti-Block Additives Market Outlook: Historical (2020 - 2025) and Forecast (2026 - 2033)
- Key Highlights
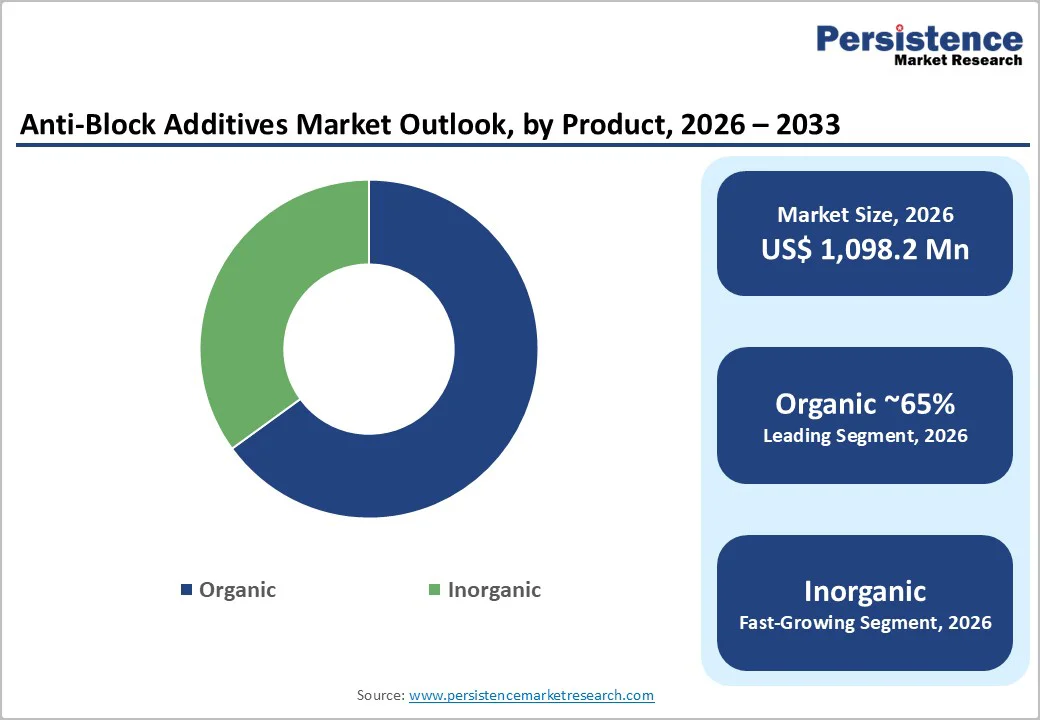
- Global Anti-Block Additives Market Outlook: Product Type
- Introduction/Key Findings
- Historical Market Size (US$ Mn) and Volume (Tons) Analysis by Product Type, 2020-2025
- Current Market Size (US$ Mn) and Volume (Tons) Forecast, by Product Type, 2026-2033
- Organic
- Inorganic
- Market Attractiveness Analysis: Product Type
- Global Anti-Block Additives Market Outlook: Polymer Type
- Introduction/Key Findings
- Historical Market Size (US$ Mn) and Volume (Tons) Analysis by Polymer Type, 2020-2025
- Current Market Size (US$ Mn) and Volume (Tons) Forecast, by Polymer Type, 2026-2033
- LDPE
- LLDPE
- HDPE
- PVC
- BOPP
- Others
- Market Attractiveness Analysis: Polymer Type
- Global Anti-Block Additives Market Outlook: Application
- Introduction/Key Findings
- Historical Market Size (US$ Mn) and Volume (Tons) Analysis by Application, 2020-2025
- Current Market Size (US$ Mn) and Volume (Tons) Forecast, by Application, 2026-2033
- Packaging
- Food
- Pharmaceuticals
- Non-Packaging
- Agriculture
- Medical
- Others
- Market Attractiveness Analysis: Application
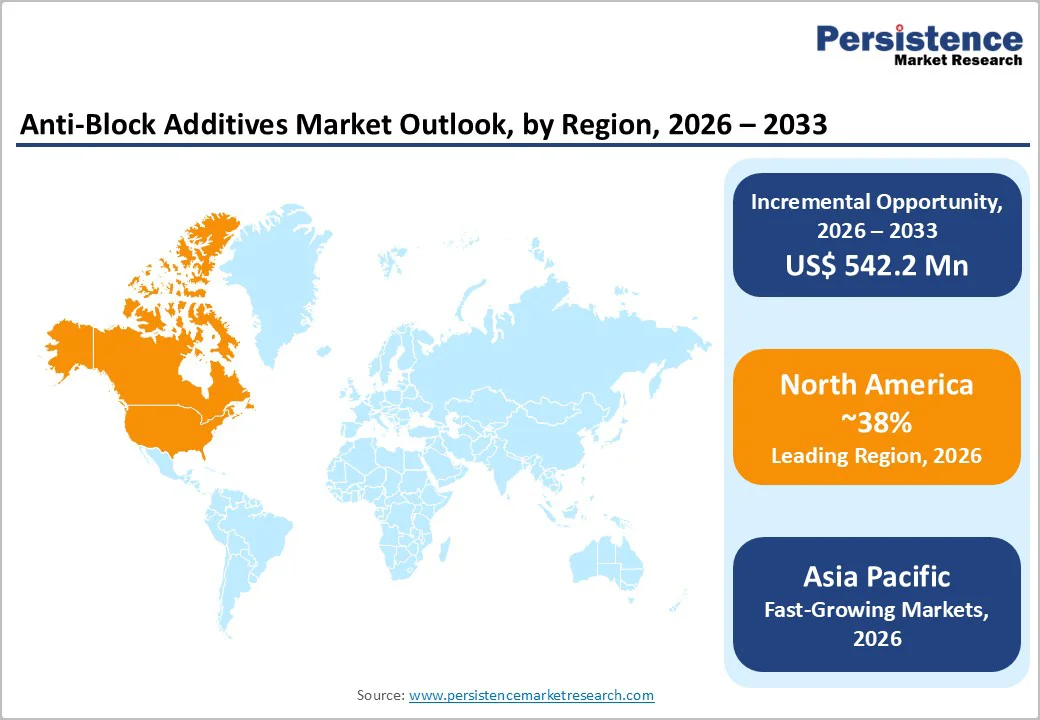
- Global Anti-Block Additives Market Outlook: Region
- Key Highlights
- Historical Market Size (US$ Mn) and Volume (Tons) Analysis by Region, 2020-2025
- Current Market Size (US$ Mn) and Volume (Tons) Forecast, by Region, 2026-2033
- North America
- Europe
- East Asia
- South Asia & Oceania
- Latin America
- Middle East & Africa
- Market Attractiveness Analysis: Region
- North America Anti-Block Additives Market Outlook: Historical (2020 - 2025) and Forecast (2026 - 2033)
- Key Highlights
- Pricing Analysis
- North America Market Size (US$ Mn) and Volume (Tons) Forecast, by Country, 2026-2033
- U.S.
- Canada
- North America Market Size (US$ Mn) and Volume (Tons) Forecast, by Product Type, 2026-2033
- Organic
- Inorganic
- North America Market Size (US$ Mn) and Volume (Tons) Forecast, by Polymer Type, 2026-2033
- LDPE
- LLDPE
- HDPE
- PVC
- BOPP
- Others
- North America Market Size (US$ Mn) and Volume (Tons) Forecast, by Application, 2026-2033
- Packaging
- Food
- Pharmaceuticals
- Non-Packaging
- Agriculture
- Medical
- Others
- Europe Anti-Block Additives Market Outlook: Historical (2020 - 2025) and Forecast (2026 - 2033)
- Key Highlights
- Pricing Analysis
- Europe Market Size (US$ Mn) and Volume (Tons) Forecast, by Country, 2026-2033
- Germany
- Italy
- France
- U.K.
- Spain
- Russia
- Rest of Europe
- Europe Market Size (US$ Mn) and Volume (Tons) Forecast, by Product Type, 2026-2033
- Organic
- Inorganic
- Europe Market Size (US$ Mn) and Volume (Tons) Forecast, by Polymer Type, 2026-2033
- LDPE
- LLDPE
- HDPE
- PVC
- BOPP
- Others
- Europe Market Size (US$ Mn) and Volume (Tons) Forecast, by Application, 2026-2033
- Packaging
- Food
- Pharmaceuticals
- Non-Packaging
- Agriculture
- Medical
- Others
- East Asia Anti-Block Additives Market Outlook: Historical (2020 - 2025) and Forecast (2026 - 2033)
- Key Highlights
- Pricing Analysis
- East Asia Market Size (US$ Mn) and Volume (Tons) Forecast, by Country, 2026-2033
- China
- Japan
- South Korea
- East Asia Market Size (US$ Mn) and Volume (Tons) Forecast, by Product Type, 2026-2033
- Organic
- Inorganic
- East Asia Market Size (US$ Mn) and Volume (Tons) Forecast, by Polymer Type, 2026-2033
- LDPE
- LLDPE
- HDPE
- PVC
- BOPP
- Others
- East Asia Market Size (US$ Mn) and Volume (Tons) Forecast, by Application, 2026-2033
- Packaging
- Food
- Pharmaceuticals
- Non-Packaging
- Agriculture
- Medical
- Others
- South Asia & Oceania Anti-Block Additives Market Outlook: Historical (2020 - 2025) and Forecast (2026 - 2033)
- Key Highlights
- Pricing Analysis
- South Asia & Oceania Market Size (US$ Mn) and Volume (Tons) Forecast, by Country, 2026-2033
- India
- Southeast Asia
- ANZ
- Rest of SAO
- South Asia & Oceania Market Size (US$ Mn) and Volume (Tons) Forecast, by Product Type, 2026-2033
- Organic
- Inorganic
- South Asia & Oceania Market Size (US$ Mn) and Volume (Tons) Forecast, by Polymer Type, 2026-2033
- LDPE
- LLDPE
- HDPE
- PVC
- BOPP
- Others
- South Asia & Oceania Market Size (US$ Mn) and Volume (Tons) Forecast, by Application, 2026-2033
- Packaging
- Food
- Pharmaceuticals
- Non-Packaging
- Agriculture
- Medical
- Others
- Latin America Anti-Block Additives Market Outlook: Historical (2020 - 2025) and Forecast (2026 - 2033)
- Key Highlights
- Pricing Analysis
- Latin America Market Size (US$ Mn) and Volume (Tons) Forecast, by Country, 2026-2033
- Brazil
- Mexico
- Rest of LATAM
- Latin America Market Size (US$ Mn) and Volume (Tons) Forecast, by Product Type, 2026-2033
- Organic
- Inorganic
- Latin America Market Size (US$ Mn) and Volume (Tons) Forecast, by Polymer Type, 2026-2033
- LDPE
- LLDPE
- HDPE
- PVC
- BOPP
- Others
- Latin America Market Size (US$ Mn) and Volume (Tons) Forecast, by Application, 2026-2033
- Packaging
- Food
- Pharmaceuticals
- Non-Packaging
- Agriculture
- Medical
- Others
- Middle East & Africa Anti-Block Additives Market Outlook: Historical (2020 - 2025) and Forecast (2026 - 2033)
- Key Highlights
- Pricing Analysis
- Middle East & Africa Market Size (US$ Mn) and Volume (Tons) Forecast, by Country, 2026-2033
- GCC Countries
- South Africa
- Northern Africa
- Rest of MEA
- Middle East & Africa Market Size (US$ Mn) and Volume (Tons) Forecast, by Product Type, 2026-2033
- Organic
- Inorganic
- Middle East & Africa Market Size (US$ Mn) and Volume (Tons) Forecast, by Polymer Type, 2026-2033
- LDPE
- LLDPE
- HDPE
- PVC
- BOPP
- Others
- Middle East & Africa Market Size (US$ Mn) and Volume (Tons) Forecast, by Application, 2026-2033
- Packaging
- Food
- Pharmaceuticals
- Non-Packaging
- Agriculture
- Medical
- Others
- Competition Landscape
- Market Share Analysis, 2025
- Market Structure
- Competition Intensity Mapping
- Competition Dashboard
- Company Profiles
- Cargil
- Company Overview
- Product Portfolio/Offerings
- Key Financials
- SWOT Analysis
- Company Strategy and Key Developments
- BASF SE
- The Dow Chemical Company
- Arkema S.A.
- Honeywell International Inc.
- W R Grace
- ExxonMobil Corporation
- Mitsui Chemicals, Inc.
- Evonik Industries AG
- BYK
- Croda International Plc
- INEOS
- SABIC
- Reliance Industries
- Cargil
- Appendix
- Research Methodology
- Research Assumptions
- Acronyms and Abbreviations

Loading page data
Please wait a moment


