


- Advanced Materials
- Washed Silica Sand Market
Washed Silica Sand Market Size, Share, and Growth Forecast 2026 - 2033
Washed Silica Sand Market by Purity (Standard Grade (90-98%), High Purity Grade (98-99.5%), Ultra High Purity (>99.5%)), Particle Size (Medium, Fine, Coarse, Others), Application (Construction, Oil & Gas Recovery, Glass Manufacturing, Foundry, Water Filtration, Others), and Regional Analysis for 2026 - 2033
Washed Silica Sand Market Size and Trend Analysis
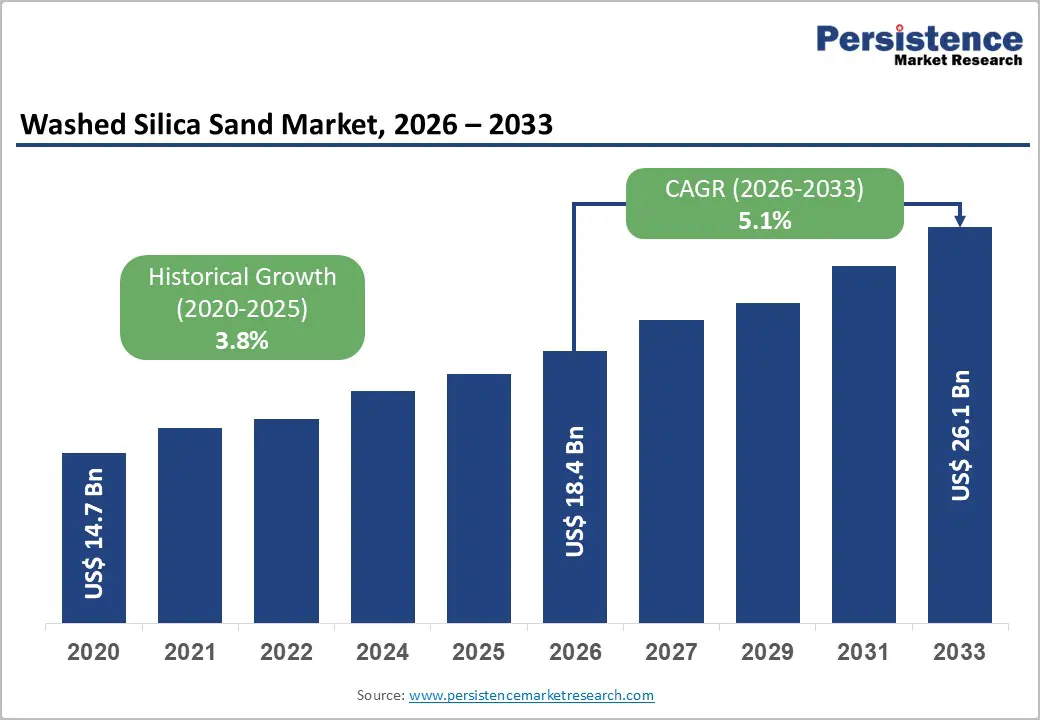
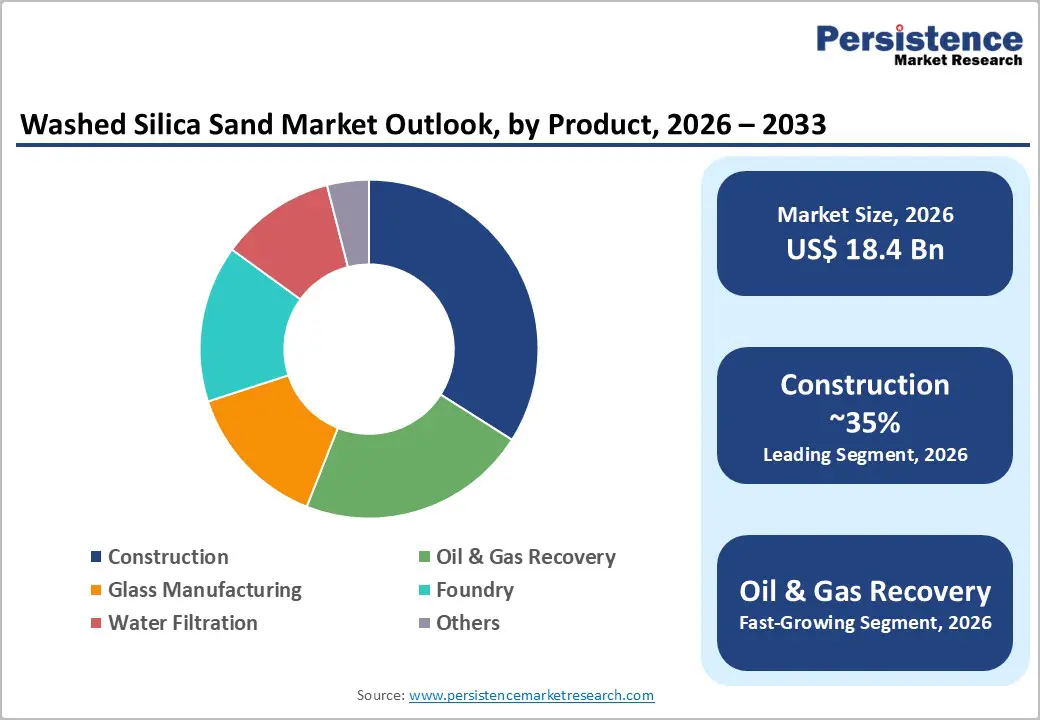
The global washed silica sand market is valued at US$ 18.4 Bn in 2026 and is projected to reach US$ 26.1 Bn by 2033, growing at a CAGR of 5.1% between 2026 and 2033.
The market's upward trajectory is underpinned by robust, multi-sector demand spanning construction, oil and gas, glass manufacturing, foundry, and water treatment. Sustained infrastructure investment in emerging economies where urbanization rates remain elevated has driven persistent consumption of specification-grade silica sand in concrete and mortar applications.
Key Industry Highlights:
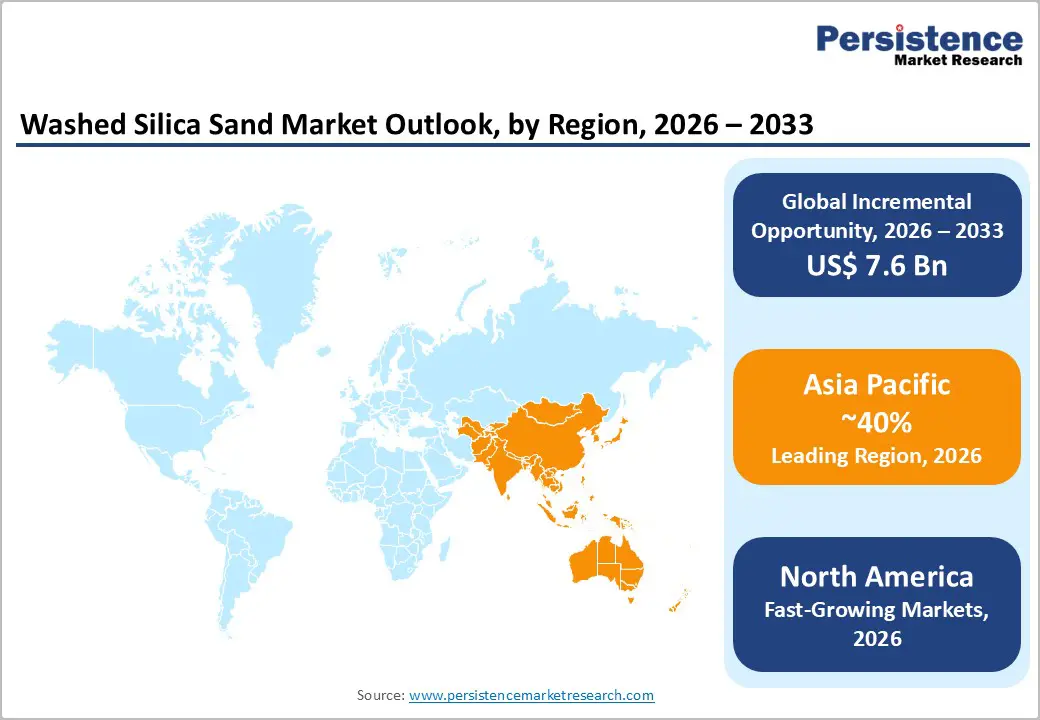
- Leading Region: Asia Pacific leads the global washed silica sand market, commanding approximately 40% of global demand volume in 2025, driven by large-scale construction activity in China and India, expanding glass manufacturing, and ongoing shale gas exploration programs, with the region projected to sustain the highest growth rate through 2033.
- Fastest Growing Region: North America remains one of the most significant regional markets for washed silica sand, anchored by the United States, which continues to lead both production and consumption of industrial sand and gravel globally.
- Dominant Segment: Construction is the leading application segment, representing approximately 34% of global washed silica sand demand, supported by sustained infrastructure investment and cement-intensive megaprojects across emerging and developed economies.
- Fastest Growing Segment: The Ultra High Purity (>99.5% SiO2) segment by purity is the fastest-growing category, driven by soaring demand from semiconductor fabrication, solar PV glass, and fiber optic applications, with adoption accelerated by government-backed chip and clean energy manufacturing incentives.
- Key Market Opportunity: Expanding water and wastewater treatment infrastructure investment globally particularly the projected growth of annual U.S. capital expenditure from US$ 37.2 billion to US$ 57.3 billion represents a durable and lower-volatility opportunity for filtration-grade coarse washed silica sand producers across multiple geographies.
| Key Insights | Details |
|---|---|
| Washed Silica Sand Market Size (2026E) | US$ 18.4 Bn |
| Market Value Forecast (2033F) | US$ 26.1 Bn |
| Projected Growth CAGR (2026 - 2033) | 5.1% |
| Historical Market Growth (2020 - 2025) | 3.8% |
DRO Analysis
Drivers - Booming Global Construction Activity and Infrastructure Investment
Rising construction activity remains the single most potent driver of washed silica sand demand worldwide. According to global spending data, construction expenditure reached approximately US$ 1.98 trillion in mid-2025, representing a 7.4% increase since 2019. In developing economies, the impact is even more pronounced: India's construction sector accounting for 9% of GDP as of 2023is projected to reach US$ 1.4 Tn by 2025, according to Invest India.
China's construction sector, the world's largest, is expected to maintain a 6% GDP share through 2025, per the Ministry of Housing and Urban-Rural Development. Washed silica sand is a critical ingredient in concrete, mortar, specialty cements, stucco, and asphalt mixtures, all of which are foundational to residential, commercial, and transport infrastructure projects globally. Growing urbanization across Asia, Africa, and Latin America further sustains this momentum.
Surging Demand from Oil & Gas Hydraulic Fracturing Operations
The global expansion of unconventional oil and gas extraction remains a core structural driver of washed silica sand consumption. The U.S. Energy Information Administration (EIA) reports that the average frac sand used per horizontal well increased by 50% between 2017 and 2022. The United States, the world's largest crude oil producer at approximately 12.8 million barrels per day (b/d) in 2024, continues to drive proppant demand through intensive completions in the Permian Basin, Eagle Ford, and Haynesville basins.
Hydraulic fracturing is used in an estimated 95% of wells drilled in the country, per the EIA. Internationally, China fractured approximately 2,740 shale gas wells between 2012 and 2022, and shale exploration is accelerating in Australia, Canada, and parts of Europe, collectively expanding the addressable market for high-quality proppant-grade silica sand.
Restraints - Permitting, Environmental Compliance, and Supply-Side Constraints
Washed silica sand supply is intrinsically linked to access to high-quality quartz-rich deposits, which requires extensive regulatory approvals for extraction, water use, and tailings management. Local zoning laws, land development restrictions, and community opposition continue to push new operations farther from demand centres, driving up delivered costs. In 2023, over 60 mining projects faced delays or cancellations due to environmental reviews and public opposition.
Regulatory tightening in the European Union and Southeast Asia impacted mining volumes by over 4.3 million metric tons. Additionally, dust emission standards imposed in Canada and Australia required over 220 quarries to install filtration or wet extraction systems, adding approximately 12% to operational expenses for mid-sized producers.
Cyclical Demand Volatility in Oil & Gas and Freight Sensitivity
The washed silica sand market is exposed to significant cyclical volatility, particularly for medium- and coarse-grade products linked to oil and gas recovery. The USGS noted that in 2024, an oversupply of frac sand led to lower prices and caused many operations to reduce production or idle facilities. Moreover, the market is highly freight-sensitive, as delivered economics often determine supplier selection over ex-works pricing.
High transportation costs for bulk mineral commodities, combined with the need to maintain consistent particle-size distributions and impurity limits across variable ore bodies, impose substantial operational burdens. Simultaneously, tightening standards for respirable crystalline silica (RCS) worker exposure are increasing compliance costs across extraction, processing, and handling, placing additional financial and operational pressure on producers of all scales.
Opportunity - Ultra-High-Purity Silica for Advanced Technology Applications
One of the most compelling near- to medium-term opportunities lies in the rapidly expanding demand for ultra-high-purity (>99.5% SiO2) washed silica sand in semiconductor fabrication, solar photovoltaic (PV) glass, and advanced fiber optics. Initiatives such as the U.S. CHIPS and Science Act are catalyzing major new semiconductor fab investments domestically and in Europe, creating concentrated demand for contamination-free silica feedstocks.
Sibelco responded to this trend in June 2024 by launching SibelClean Ultra-Pure Silica >99.9% SiO2 product targeting semiconductor and solar PV glass markets and reported a 7% year-over-year growth in contracts in Q2 2024, primarily from German and Dutch solar producers. The specialty glass market, valued at over US$ 37 billion in 2025, requires low-iron, high-transparency silica.
Water Infrastructure Modernization and Municipal Filtration Investments
Growing global investment in drinking water treatment and wastewater management is creating a durable and growing demand channel for filtration-grade washed silica sand. Coarse-grade silica sand is the preferred medium for granular bed pressure filters in municipal and industrial treatment plants. In the United States alone, annual capital expenditures for water and wastewater treatment infrastructure are projected to grow from US$ 37.2 billion to US$ 57.3 billion over the next decade.
Pennsylvania committed a historic US$ 547.1 million investment in clean water projects in 2025. Internationally, the expansion of desalination infrastructure in the Middle East and water treatment buildouts across South Asia and Southeast Asia are creating significant export-oriented opportunities for qualified filtration-grade silica sand producers. Stable, recurring, and growing public sector spending in this segment offers market participants a lower-volatility revenue stream compared to cyclical oil and gas applications.
Category-wise Analysis
Purity Insights
The Standard Grade (90-98% SiO2) segment holds the leading share in the washed silica sand market by purity, accounting for approximately 48% of the overall market. This segment's dominance reflects its wide-spectrum utility across the highest-volume applications, primarily construction materials, foundry molds, and general industrial uses where very high silica purity is not a prerequisite for product performance.
The broad compatibility of standard-grade sand with concrete production, asphalt mixtures, and conventional glass compositions ensures consistent, high-volume procurement from major end-user industries. According to USGS data, construction, glassmaking, and foundry collectively account for most industrial sand and gravel use in the United States. The affordability and wide availability of standard-grade silica sand from established domestic quarries and mines reinforce its position as the dominant purity category, particularly in freight-sensitive and price-competitive procurement environments.
Particle Size Analysis
The Medium particle size segment commands the largest market share by particle size, holding approximately 47% of the washed silica sand market. This segment's leading position is attributable to its versatility across the broadest range of commercial applications, including construction products, industrial uses, and oil and gas recovery, where controlled sizing supports both performance and handling efficiency. Medium-grade sand provides an optimal balance between surface area, permeability, and crush resistance, making it suitable for a wide array of industrial specifications. Glass Alliance Europe reports that European glass production exceeded 36 million tonnes in 2024, reinforcing stable demand for medium-grade silica as a key glassmaking raw material. Medium sand's ability to meet simultaneous requirements across multiple sectors without specialized processing confers significant commercial and logistical advantages to producers and distributors.
Application Insights
The construction segment is the leading application category in the washed silica sand market, representing approximately 34% of total market demand. Silica sand's critical role in concrete, mortar, specialty cements, stucco, roofing shingles, and asphalt mixtures makes it indispensable to both residential and infrastructure construction. Global construction spending reached approximately US$ 1.98 trillion in mid-2025, supporting sustained raw material procurement across the segment. In Asia Pacific, the construction sector contributions to GDP6% in China and 9% in India highlight the structural intensity of regional demand. The accelerating construction of data centers with over 31.6 GW of new North American capacity in planning as of mid-2025represents an emerging and material additional demand channel within the construction application segment.
Regional Insights
Asia Pacific Washed Silica Market Trends
Asia Pacific is the largest regional market for washed silica sand, accounting for approximately 40% of global demand volume in 2025. China and India are the primary demand engines, with construction sectors constituting 6% of China's GDP and 9% of India's GDP, respectively. China's glass industry also drives significant silica consumption, as insulating glass production alone reached 9,868,000 sq m in April 2024.
India's construction industry is projected to reach US$ 1.4 Tn by 2025, driving consistent demand for construction-grade washed silica sand. Japan contributes through precision glass, electronics-grade silica supply chains, and automotive foundry uses. ASEAN economies, particularly Indonesia and Vietnam, are growing as both production hubs and consumption markets, underpinned by rapid urbanization, infrastructure development, and expanding glass manufacturing.
North America Washed Silica Market Trends
North America remains one of the most significant regional markets for washed silica sand, anchored by the United States, which continues to lead both production and consumption of industrial sand and gravel globally. The USGS confirms that in 2022, U.S. industrial sand and gravel production reached an estimated 97 million tons, valued at US$ 5.7 billion. Approximately 75% of U.S. tonnage is consumed as hydraulic-fracturing sand and well-packing sand, underscoring the region's singular dependence on oil and gas activity as a primary demand driver.
Beyond oil and gas, the North American market is experiencing new demand impulses from data centre construction with over 31.6 GW of new capacity in planning in the region as of mid-2025, and from water infrastructure investment under programs authorized by the U.S. Infrastructure Investment and Jobs Act, which committed US$ 118 billion to the Highway Trust Fund alone. Canada contributes through silica sand supply for oil sands operations and glass production, while February 2024 saw Manitoba approve a silica sand mining project expected to generate US$ 200 million per year in provincial taxes and approximately 300 jobs.
Europe Washed Silica Market Trends
Europe represents a key demand region for high-quality washed silica sand, driven by mature glass manufacturing, automotive foundry, industrial filtration, and construction sectors. Germany leads the European silica sand market in value terms, supported by quality glass production, solar PV panel manufacturing, and foundry sand use in automotive casting. Germany produced more than 10 million tonnes of silica sand in 2024. According to Glass Alliance Europe, overall European glass production exceeded 36 million tonnes in 2024, reinforcing the structural importance of stable, high-quality silica raw material supply for the region's glass sector.
Europe's silica sand production reached approximately 78 million metric tons in 2023. The United Kingdom, France, and Spain contribute to demand through construction aggregates, specialty glass, and water treatment applications. The EU Chips Act is rapidly stimulating semiconductor investments that require ultra-high-purity silica, opening a specialized high-value market segment for European producers.
Competitive Landscape
The global washed silica sand market exhibits a moderately consolidated structure, with a small number of multinational industrial minerals groups commanding significant market share alongside a larger fragmented base of regional deposit owners and application-focused producers. Leading players such as Sibelco, Quarzwerke Group, and EUROQUARZ differentiate through deposit quality, beneficiation and sizing capabilities, multi-region distribution networks, and specialty grades for glass and filtration. Key competitive differentiators include particle-size uniformity, silica purity certification, quality assurance systems, logistics infrastructure, and the ability to supply large and consistent volumes.
Key Developments:
- In July 2024, U.S. Silica Holdings, Inc. was completely acquired by Apollo Global Management, transitioning the company into private ownership while maintaining the U.S. Silica name and leadership, positioning it for longer-term strategic investments across silica and sands processing operations.
- In May 2024, Covia Holdings LLC acquired R.W. Sidley's Industrial Minerals Division, expanding its high-purity washed silica sand product portfolio for filtration, sports turf, and construction applications across North America.
Companies Covered in Washed Silica Sand Market
- Stone Skipper LLP
- Sibelco
- Quarzwerke Group
- EUROQUARZ
- SHREE SILICAAM MINERALS LLP
- CDE Group
- Silica Services, LLC.
- All India Minerals
- SUJAL LOGISTICS PVT. LTD.
- PLATINUM MINERAL
- U.S. Silica Holdings, Inc.
- Covia Holdings LLC
Frequently Asked Questions
The global Washed Silica Sand market is valued at US$ 18.4 Bn in 2026 and is projected to reach US$ 26.1 Bn by 2033, growing at a CAGR of 5.1% during the forecast period from 2026 to 2033, driven by diversified end-use demand across construction, oil and gas, glass manufacturing, foundry, and water filtration sectors.
The market is primarily driven by rising global construction activity with global construction spending reaching approximately US$ 1.98 trillion in mid-2025and the sustained demand for hydraulic fracturing proppant in the oil and gas sector, where frac sand accounted for approximately 75% of U.S. industrial sand consumption per USGS data.
The Construction segment is the leading application category, representing approximately 34% of total market demand. Silica sand is an essential ingredient in concrete, mortar, specialty cements, asphalt mixtures, and other construction materials, making it indispensable to infrastructure development worldwide.
Asia Pacific is the leading region for washed silica sand consumption, commanding approximately 40% of global demand volume in 2025.
Key players in the global Washed Silica Sand market include Stone Skipper LLP, Sibelco, Quarzwerke Group, EUROQUARZ, CDE Group, SHREE SILICAAM MINERALS LLP, Silica Services, LLC., All India Minerals, SUJAL LOGISTICS PVT. LTD., PLATINUM MINERAL, U.S. Silica Holdings, and Covia Holdings LLC (Iron Oak Energy Solutions LLC), among others.


