


- Bulk Chemicals
- Tetrahydrofuran Market
Tetrahydrofuran Market Size, Share, and Growth Forecast 2026 - 2033
Tetrahydrofuran Market by Production Process (Reppe Process, Butadiene Process, Maleic Anhydride Process, Bio-Based Process), Grade (Industrial Grade, Pharmaceutical Grade, HPLC Grade, Electronic Grade), Application (PTMEG Production, Solvent Applications, Adhesives & Sealants, PVC Cement, Chemical Intermediate, Others), Industry (Pharmaceuticals, Chemicals & Petrochemicals, Textile & Spandex, Automotive, Paints & Coatings, Electronics, Others), and Regional Analysis for 2026 - 2033
Tetrahydrofuran Market Size and Trend Analysis
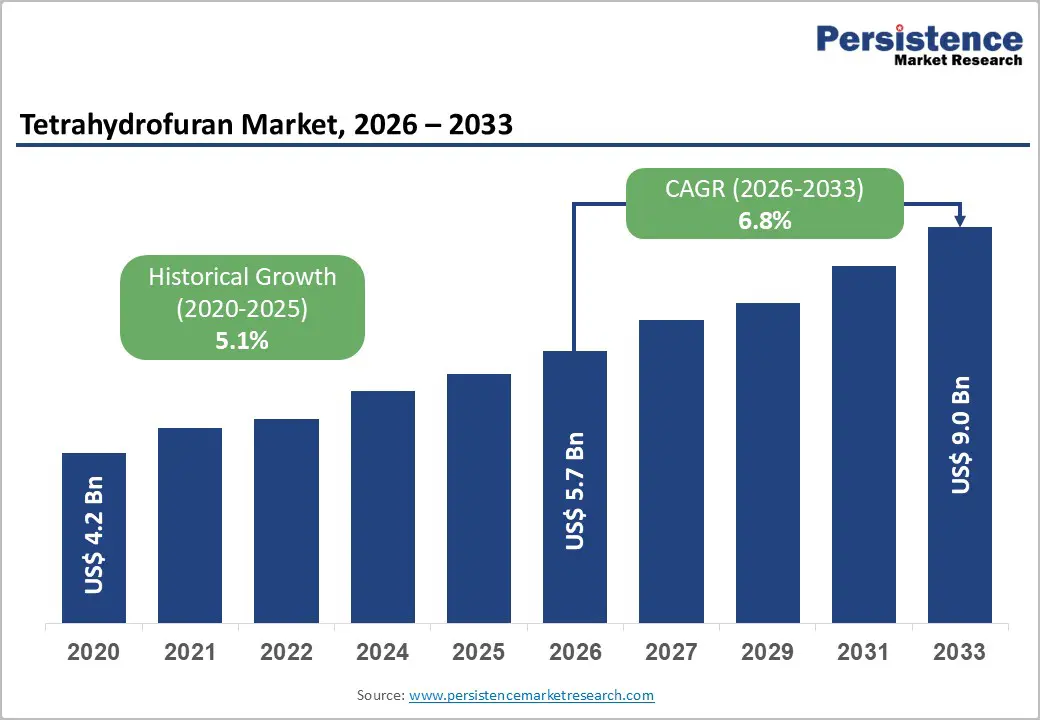
The global tetrahydrofuran (THF) market is valued at US$ 5.7 billion in 2026 and is projected to reach US$ 9.0 billion, growing at a CAGR of 6.8% between 2026 and 2033.
The market's sustained expansion is underpinned by robust downstream demand from the polytetramethylene ether glycol (PTMEG) manufacturing chain the primary feedstock for spandex and polyurethane elastomers, combined with surging pharmaceutical solvent applications and the accelerating global shift toward bio-based and sustainable chemical processing.
The rise in textile consumption in the Asia Pacific, escalating pharmaceutical production in regulated markets, and the adoption of high-purity solvents in semiconductor fabrication are collectively reinforcing THF's strategic importance across multiple high-growth end-use industries through the forecast horizon.
Key Industry Highlights:
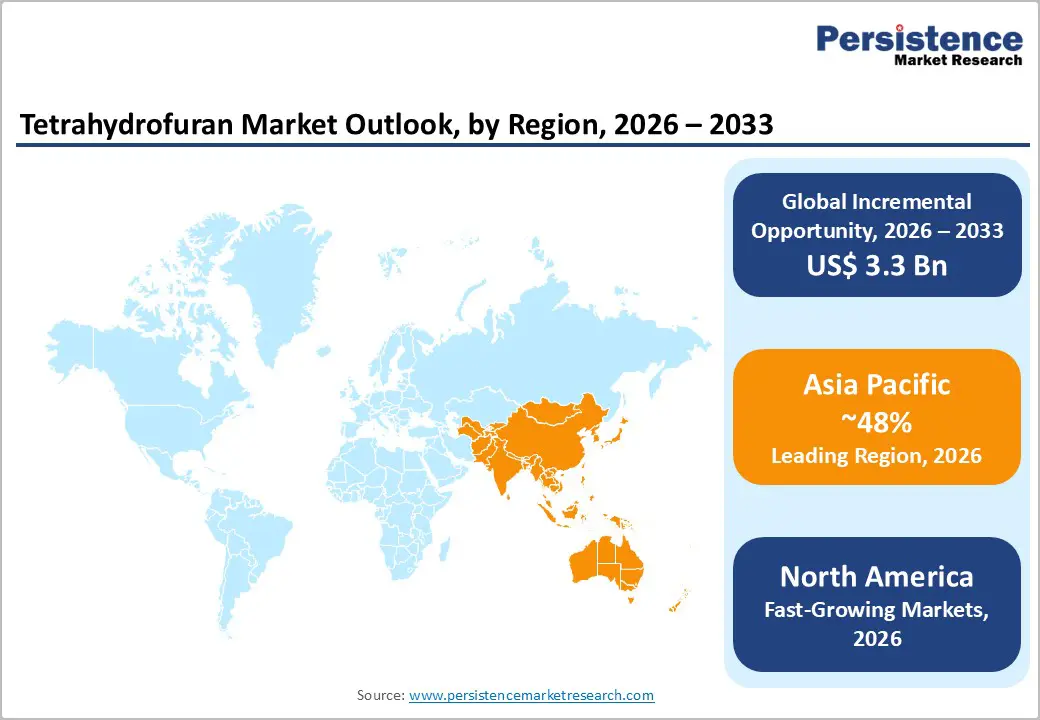
- Leading Region: Asia Pacific leads the global THF market with approximately ~48% share, driven by China's PTMEG and spandex production dominance and India's pharmaceutical API manufacturing expansion reinforcing structural long-term demand.
- Fastest Growing Region: Asia Pacific (notably India and ASEAN) is the fastest growing region, with India projected at 8.1% CAGR, supported by PLI-scheme pharmaceutical expansion and emerging spandex manufacturing investments.
- Dominant Segment: PTMEG Production is the dominant application segment, holding approximately 52% share, anchored by global spandex fiber capacity expansion across China, South Korea, and South Asia through 2033.
- Fastest Growing Segment: Bio-Based THF is the fastest growing production segment at ~10.2% CAGR, driven by European Green Deal mandates, corporate decarbonization commitments, and premium pricing opportunities in sustainable chemical supply chains.
- Key Market Opportunity: Electronic-grade THF for semiconductor fabrication represents a high-value niche growing at ~9.5% CAGR, supported by government-funded fab expansion in U.S., EU, India, and South Korea creating captive long-term demand.
Market Dynamics
Drivers - Surging PTMEG Demand Driven by Spandex and Polyurethane Industries
THF's largest and most structurally significant end-use is the production of polytetramethylene ether glycol (PTMEG), which consumes approximately 60-65% of global THF output. PTMEG is the essential precursor to spandex (elastane) fiber, high-performance polyurethane elastomers, and thermoplastic polyurethanes (TPUs). The global spandex market has undergone rapid capacity expansion, particularly across China, South Korea, and India, as rising athleisure and activewear consumption reshapes global textile demand.
According to the International Textile Manufacturers Federation (ITMF), global fiber demand is projected to grow at over 3% annually through 2030, with synthetic and stretch fibers outpacing conventional categories.
The robust spandex fiber growth trajectory directly amplifies THF procurement requirements across PTMEG producers. Invista, Hyosung, and Toray among the world's leading PTMEG and spandex manufacturers have collectively announced capacity expansions exceeding 400,000 metric tons across Asian manufacturing hubs through 2026. This PTMEG production demand escalation ensures THF remains at the center of high-growth polymer supply chains, driving predictable volume offtake contracts that underpin manufacturer investment confidence.
Expanding Pharmaceutical and Electronics Manufacturing Driving High-Purity THF Demand
THF is a critical solvent in pharmaceutical synthesis, including the production of active pharmaceutical ingredients (APIs), polymer coatings for drug delivery systems, and analytical chemistry applications. The global pharmaceutical market, valued at approximately US$ 1.6 trillion in 2023, continues to expand through generic drug manufacturing scale-up in India and China, and biologics production in North America and Europe.
Regulatory agencies including the U.S. FDA and European Medicines Agency (EMA) mandate solvent-grade purity specifications under ICH Q3C guidelines, creating strong pull for pharmaceutical-grade and HPLC-grade THF.
Concurrently, the global semiconductor industry's expansion supported by the U.S. CHIPS and Science Act (2022) allocating US$ 52.7 Bn for domestic chip manufacturing, and the EU Chips Act targeting 20% of global chip production by 2030 is driving demand for electronic-grade high-purity solvents including ultra-pure THF for photoresist formulations and semiconductor cleaning processes. These converging demand vectors make high-purity THF one of the fastest-growing product sub-categories within the overall market.
Restraints - Volatility in Petrochemical Feedstock Pricing and Supply Disruptions
THF production via conventional routes predominantly the Reppe Process (from acetylene and formaldehyde) and the Maleic Anhydride Process is directly dependent on petrochemical feedstocks subject to crude oil price volatility and supply chain disruptions. The IEA reported that global energy price volatility between 2021 and 2023 led to 30-50% fluctuations in acetylene and butadiene pricing. Such unpredictability compresses manufacturer margins, particularly for commodity-grade THF producers operating in cost-competitive markets, and can delay capacity investment decisions critical to meeting growing downstream demand.
Stringent Environmental and Occupational Health Regulations
THF is classified as a volatile organic compound (VOC) and potential carcinogen under several regulatory frameworks, including OSHA's Permissible Exposure Limits (PEL) and REACH regulations in the European Union. The European Chemicals Agency (ECHA) has subjected THF to heightened scrutiny under SVHC (Substances of Very High Concern) candidate evaluations, imposing compliance costs and usage restrictions. These regulatory pressures increase operational costs for solvent application users, incentivize substitution in certain applications, and create market entry barriers for producers lacking robust environmental compliance infrastructure.
Opportunities - Bio-Based THF: A Strategic Growth Vector in Sustainable Chemical Processing
The transition toward sustainable chemical processing is creating a compelling commercial opportunity for bio-based THF derived from renewable feedstocks such as furfural (from agricultural residues) and bio-succinic acid. The European Green Deal and U.S. Inflation Reduction Act (IRA) both allocate substantial resources toward bio-based chemical manufacturing, creating policy-driven demand pull. Mitsubishi Chemical Group and Invista have both announced investments in bio-based butanediol (BDO) and THF pathways, signaling industry confidence in renewable production routes.
Bio-based THF commands a 10-20% price premium over petrochemical equivalents in sustainability-conscious end markets particularly European pharmaceutical and cosmetic formulators subject to Scope 3 emission reduction commitments. As bio-refinery technology matures and feedstock availability improves, cost parity with conventional THF is achievable by the early 2030s. Producers investing now in Bio-Based THF production capacity and certifications (e.g., ISCC PLUS) are well-positioned to capture preferential supplier status among sustainability-committed OEMs and formulators globally.
Electronics and Semiconductor Fabrication: High-Value Niche Expansion
The global semiconductor industry is undergoing a structural expansion phase, with SEMI (Semiconductor Equipment and Materials International) projecting global fab equipment spending to exceed US$ 100 Bn annually by 2025. Electronic-grade THF produced to sub-ppb metallic impurity specifications is used in photoresist solvents, polymer precursors for dielectric coatings, and advanced packaging materials. This niche commands significant per-unit premiums over industrial-grade THF and requires specialized manufacturing infrastructure, creating high barriers to entry that favor incumbent specialty chemical producers.
Government-backed semiconductor manufacturing investments across the U.S., EU, Japan, South Korea, and India (India's Semicon India Programme targeting US$ 10 Bn in semiconductor investments) are expanding the geographic footprint of advanced chip fabrication. Each new semiconductor fab creates sustained demand for ultra-high-purity process chemicals including electronic-grade THF, offering specialty THF producers captive long-term supply opportunities embedded within the strategic national interest of host governments.
Category wise Analysis
Production Process Insights
The reppe process dominates the global THF production landscape, accounting for approximately 55% of total market share. Developed by BASF and commercialized in the mid-20th century, the Reppe Process synthesizes THF from acetylene and formaldehyde via 1,4-butanediol (BDO) intermediates. Its dominance reflects the well-established industrial infrastructure, high conversion efficiency, and favorable economics at scale that have made it the preferred process across major production hubs in Germany, China, and the United States.
The process's deep integration with downstream PTMEG manufacturing supply chains reinforces its structural position; leading PTMEG producers including BASF and Mitsubishi Chemical operate Reppe-based THF units co-located with BDO facilities, minimizing logistics costs and maximizing feedstock utilization efficiency.
The bio-based process is the fast-growing production segment, projected at a CAGR of approximately 10.2% through 2033 significantly outpacing the overall market. Driven by sustainable chemical processing mandates and corporate decarbonization commitments, bio-based THF from renewable BDO and furfural pathways is gaining traction among sustainability-focused formulators and pharmaceutical manufacturers.
Grade Insights
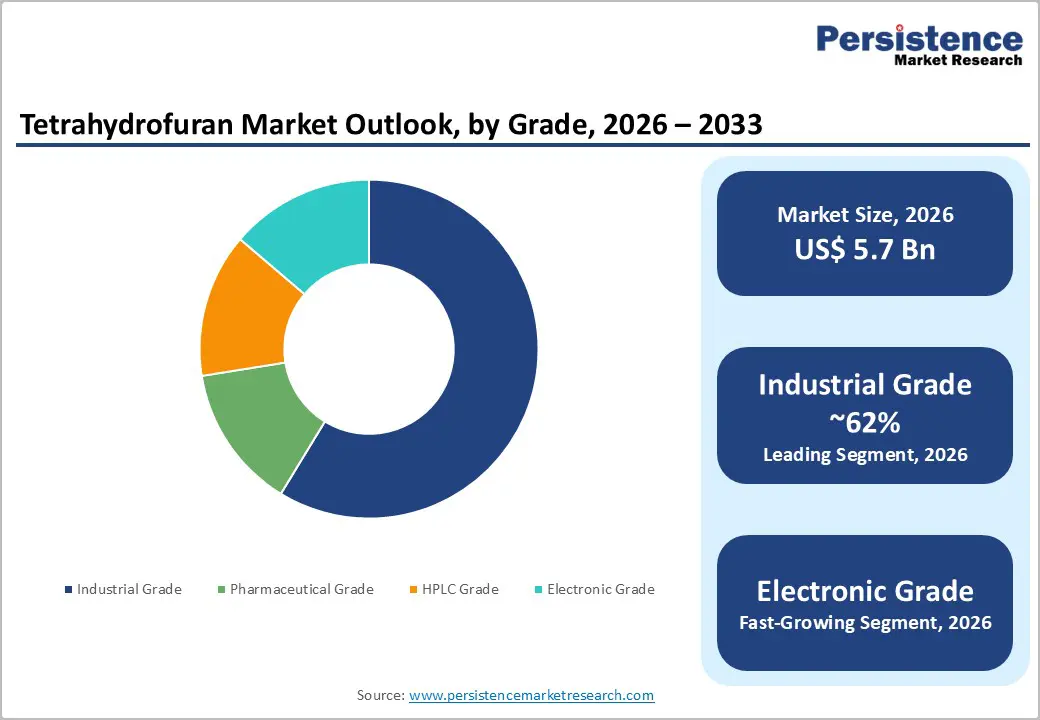
Industrial Grade THF holds the leading position in the grade segment, commanding approximately 62% of total market revenue. This dominance is directly attributable to the overwhelming scale of PTMEG production THF's largest application which requires industrial-grade product specifications rather than high-purity variants. Industrial-grade THF is also extensively used in PVC cement formulations, adhesives, and general solvent applications across the chemical and coatings industries.
The availability of large-volume supply contracts, lower per-unit cost, and compatibility with standard storage and handling infrastructure make industrial-grade THF the default procurement choice across commodity-scale downstream industries. Established producers including BASF SE, Dairen Chemical Corporation, and LyondellBasell operate large-scale industrial-grade THF units to serve these volume-intensive demand centers.
Electronic Grade THF represents the fastest-growing grade segment at a projected CAGR of approximately 9.5%, driven by surging semiconductor fabrication investments globally. High-purity solvents meeting sub-ppb metallic impurity thresholds command significant price premiums and are increasingly specified in advanced node chip manufacturing processes.
Application Insights
PTMEG Production is unequivocally the dominant application segment, representing approximately 52% of total THF consumption globally. The application's commanding share reflects the massive and expanding scale of global spandex, elastane, and polyurethane elastomer manufacturing, all of which depend on PTMEG as a critical polymer building block. Global spandex capacity additions particularly in China, where producers including Huafon Chemical, Zhejiang Huajiang, and Taekwang have collectively added over 500,000 metric tons of annual spandex capacity since 2020 directly translate into proportional THF demand growth. The application's long-term resilience is further supported by structural demand for high-performance athletic and medical textiles.
Solvent Applications is the fastest-growing application segment at a CAGR of approximately 8.1%, led by pharmaceutical API synthesis and electronic-grade cleaning solvent adoption. The convergence of pharmaceutical manufacturing expansion and semiconductor fab proliferation is accelerating THF solvent demand across high-value processing industries.
Industry Insights
The textile & spandex industry holds the leading position in the end-use segmentation, accounting for approximately 45% of global THF demand. This dominance is a direct function of the THF-PTMEG-spandex value chain's scale and growth trajectory. Global spandex consumption has grown consistently at above-market rates, driven by the premiumization of activewear, healthcare compression garments, and rising middle-class apparel expenditures in the Asia Pacific. According to the Textile Exchange Fiber Market Report, synthetic fiber production continues to account for over 65% of total global fiber output, with stretch fibers representing the fastest-growing synthetic category. Spandex fiber growth across South and Southeast Asia is creating long-term offtake commitments that anchor THF demand within this segment for the foreseeable forecast horizon.
The Electronics Industry is the fastest-growing segment at an estimated CAGR of 9.8%, driven by global semiconductor fab expansion and the proliferation of advanced packaging technologies requiring ultra-high-purity process solvents, including electronic-grade THF.
Regional Insights
North America Tetrahydrofuran Market Trends
North America represents a mature yet innovation-driven THF market, characterized by strong demand from pharmaceutical manufacturing, specialty polymer applications, and the expanding electronics sector. The region benefits from well-established regulatory frameworks, advanced chemical processing infrastructure, and sustained investment in domestic semiconductor manufacturing under the U.S. CHIPS and Science Act.
The region's pharmaceutical API manufacturing base, the largest globally by output value according to the U.S. FDA drives consistent demand for pharmaceutical-grade and HPLC-grade THF. North American specialty chemical manufacturers are also advancing bio-based THF production pathways aligned with the IRA's clean chemistry incentive provisions, creating investment momentum in sustainable THF production infrastructure.
- U.S. THF Market: Pharmaceutical and Electronics Demand Hub
The United States accounts for approximately 72% of total North American THF demand, making it the region's dominant national market. The U.S. market is projected to grow at a CAGR of approximately 5.8% through 2033. Its strategic importance stems from the concentration of global pharmaceutical R&D and API manufacturing with the U.S. FDA overseeing the world's largest regulated drug market and the rapid scale-up of domestic semiconductor fabrication capacity in states including Arizona, Ohio, and New York under CHIPS Act-funded programs.
Leading THF consumers include multinational pharmaceutical firms such as Pfizer, Merck & Co., and Eli Lilly, alongside specialty polymer producers using PTMEG-derived TPUs for medical and industrial applications.
Europe Tetrahydrofuran Market Trends
Europe's THF market is shaped by rigorous regulatory standards under REACH and EU Green Deal commitments, creating dual pressure on producers: compliance investment requirements while simultaneously expanding market opportunities for sustainable chemical processing solutions. The region hosts several of the world's leading THF producers and major downstream consumers in pharmaceuticals, specialty coatings, and engineering polymers.
European OEM automotive manufacturers including BMW, Volkswagen, and Stellantis are accelerating adoption of polyurethane components derived from PTMEG-based TPUs in lightweight vehicle architectures, driving specialty THF demand. The European Chemicals Agency's (ECHA) regulatory oversight of VOC-related solvents incentivizes bio-based and low-emission THF formulation development, presenting long-term structural growth opportunities for compliant producers.
- Germany THF Market: Europe's Chemical Production Powerhouse
Germany is the leading THF market in Europe, commanding approximately 30% of regional market share, growing at a CAGR of approximately 5.5%. Its primacy reflects Germany's status as Europe's largest chemical producer, with BASF SE's Ludwigshafen complex being among the world's largest integrated THF and BDO manufacturing sites. German automotive, pharmaceutical, and specialty polymer industries create deep and diversified THF demand, reinforced by the country's advanced R&D ecosystem for green chemistry innovation.
- U.K. THF Market: Pharmaceutical Grade Solvent Demand Leader
The United Kingdom holds approximately 12-14% of European THF demand, with a CAGR of approximately 5.2%. The U.K.'s strength lies in its world-class pharmaceutical manufacturing and CRO/CDMO ecosystem home to AstraZeneca, GlaxoSmithKline, and Pfizer's major API facilities which generates consistent high-purity THF demand. Post-Brexit regulatory alignment with MHRA standards and continued biopharmaceutical investment reinforce the country's premium solvent consumption trajectory through the forecast period.
- France THF Market: Specialty Coatings and Polymer Solvent Demand
France is likely to accounts for approximately 12% of European THF consumption in 2026. The French market is supported by its strong specialty coatings, adhesives, and luxury polymer industries including high-performance automotive and aeronautical components manufactured by Airbus, Arkema, and Solvay. France's commitment to the European Green Deal and national green chemistry targets additionally drive investment in sustainable THF solvents for specialty applications.
- Italy THF Market: Textile and Adhesive Application Growth Driver
Italy accounts for approximately 10% of European THF demand in 2026, with a CAGR of approximately 4.8% in the forecast period. Italy's textile and fashion manufacturing heritage the country is the EU's second-largest textile producer creates demand for THF-derived adhesives and PVC cements used in footwear and apparel assembly. Growing specialty polymer and adhesives consumption across Italian industrial districts provides incremental demand uplift alongside the country's emerging pharmaceutical manufacturing sector.
Asia Pacific Tetrahydrofuran Market Trends
Asia Pacific is the dominant regional market, accounting for approximately 48% of global THF demand, driven by the region's unparalleled scale in spandex fiber production, pharmaceutical API manufacturing, and semiconductor fabrication. China alone accounts for the majority of regional demand through its massive PTMEG and spandex industry complex.
The region benefits from significant cost advantages in chemical manufacturing, government-backed industrial expansion programs, and rapidly growing domestic consumption of downstream products including textiles, pharmaceuticals, and electronics. The ASEAN bloc particularly Vietnam, Thailand, and Indonesia is emerging as a secondary growth engine through textile manufacturing expansion and nascent pharmaceutical production capabilities.
- China THF Market: PTMEG and Spandex Production Epicenter
China dominates the Asia Pacific THF market, representing approximately 55-58% of regional consumption, growing at a CAGR of approximately 7.2%. China's PTMEG production capacity accounts for over 60% of global output (China Petroleum and Chemical Industry Federation, CPCIF), making it the single most important national market for THF globally. Government industrial policy under the 14th Five-Year Plan emphasizes advanced materials and specialty chemicals, supporting continued THF capacity investment.
- India THF Market: Pharmaceutical API Expansion and Spandex Growth
India holds approximately 15-18% of Asia Pacific THF demand, growing at a CAGR of approximately 8.1% one of the fastest growth rates in the region. India is the world's largest supplier of generic pharmaceuticals by volume (Pharmexcil, 2023), creating structural demand for pharmaceutical-grade and HPLC-grade THF. The PLI scheme for pharmaceuticals and API clusters in Hyderabad and Gujarat are amplifying production-scale THF consumption, while India's emerging spandex manufacturing investments add incremental PTMEG-linked demand.
- South Korea THF Market: Electronics and High-Performance Polymer Leader
South Korea accounts for approximately 8-10% of Asia Pacific THF consumption, growing at a CAGR of approximately 7.5%. South Korea's world-leading semiconductor industry anchored by Samsung Electronics and SK Hynix is the primary driver of electronic-grade THF demand, while Hyosung TNC's dominance in global spandex production (over 30% global share) creates sustained large-volume THF-PTMEG procurement requirements.
Competitive Landscape
The global THF market is moderately consolidated, with the top five producers BASF SE, Mitsubishi Chemical Group, Dairen Chemical Corporation, LyondellBasell, and Invista collectively accounting for an estimated 55-60% of global capacity. Key differentiators include feedstock integration depth, process technology proprietary advantages, and high-purity grade certifications.
Market leaders are actively pursuing capacity expansions in Asia Pacific and investing in bio-based production routes. Emerging business models include long-term take-or-pay supply contracts with PTMEG producers and specialty-grade premium positioning in pharmaceutical and electronics segments.
Key Developments:
- March 2024: BASF SE announced an expansion of its Ludwigshafen THF/BDO integrated facility, with targeted capacity increase of 15% to serve growing European pharmaceutical and specialty polymer customers through 2026.
- August 2024: Mitsubishi Chemical Group inaugurated a new bio-based BDO pilot facility in Japan, advancing commercialization of Bio-Based THF production from renewable feedstocks targeting sustainability-committed downstream markets.
- January 2025: Dairen Chemical Corporation (Taiwan) announced a strategic US$ 180 Mn investment in expanded electronic-grade THF purification capacity to serve semiconductor customers across Taiwan, South Korea, and Japan.
Companies Covered in Tetrahydrofuran Market
- BASF SE
- Mitsubishi Chemical Group
- Dairen Chemical Corporation
- LyondellBasell Industries
- Invista (Koch Industries)
- Ashland Global Holdings Inc.
- Merck KGaA (EMD Millipore)
- TCI Chemicals
- Sigma-Aldrich (MilliporeSigma)
- Zhejiang Zhongchuan Chemical
- Sinochem Holdings Corporation
- Shanxi Sanwei Group Co., Ltd.
Frequently Asked Questions
The global THF market size is valued at US$ 5.7 Bn in 2026 and is projected to reach US$ 9.0 Bn by 2033, expanding at a CAGR of 6.8% during the forecast period.
Primary drivers include surging PTMEG production demand for spandex and polyurethane applications, expanding pharmaceutical API synthesis requiring high-purity solvents, and government-funded semiconductor manufacturing investments creating growing electronic-grade THF demand globally.
PTMEG Production is the leading application segment, commanding approximately 52% of global THF consumption. Its dominance is driven by the massive and growing global spandex manufacturing base, with over 500,000 MT of capacity additions in China since 2020 directly translating into THF offtake demand.
Asia Pacific leads with approximately ~48% of global market share. China alone contributes over 55% of regional demand through PTMEG and spandex industry concentration, while India represents the region's fastest-growing national market at a projected 8.1% CAGR.
The most significant opportunities include Bio-Based THF production aligned with European Green Deal and IRA incentives (growing at ~10.2% CAGR), and electronic-grade THF for semiconductor fabrication a premium niche growing at ~9.5% CAGR supported by multi-billion-dollar government fab investment programs globally.
Leading companies include BASF SE, Mitsubishi Chemical Group, Dairen Chemical Corporation, LyondellBasell Industries, and Invista, collectively commanding an estimated 55-60% of global THF production capacity. These companies compete on process technology, grade portfolio breadth, geographic reach, and sustainability credentials.


