


- Executive Summary
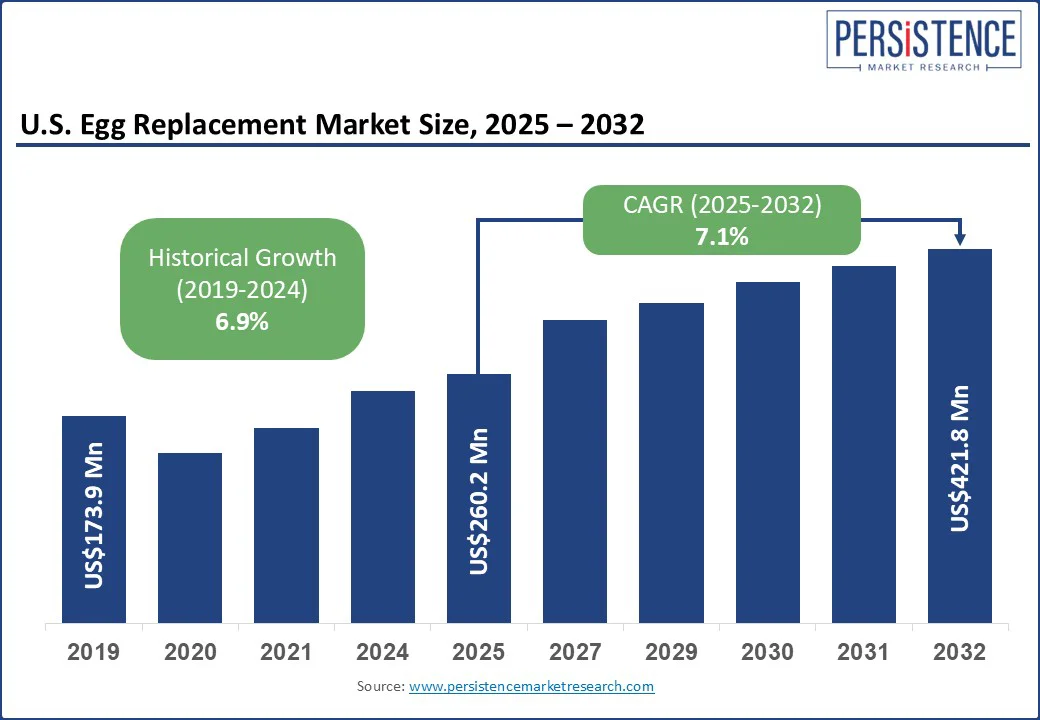
- U.S. Egg Replacement Market Snapshot, 2025 and 2032
- Market Opportunity Assessment, 2025 - 2032, US$ Mn
- Key Market Trends
- Future Market Projections
- Premium Market Insights
- Industry Developments and Key Market Events
- PMR Analysis and Recommendations
- Market Overview
- Market Scope and Definition
- Market Dynamics
- Drivers
- Restraints
- Opportunity
- Challenges
- Key Trends
- Macro-economic Factors
- Investment and Funding in Alternative Protein Start-ups
- Rising Healthcare Costs Linked to Obesity and Cardiovascular Disease
- Fluctuations in Egg Supply and Pricing due to Avian Flu Outbreaks
- Trade Dynamics and Export Opportunities for Shelf-stable Replacers
- COVID-19 Impact Analysis
- Forecast Factors - Relevance and Impact
- Value Added Insights
- Regulatory Landscape
- Value Chain Analysis
- PESTLE Analysis
- Porter’s Five Force Analysis
- Price Trend Analysis 2019 - 2032
- Key Highlights
- Key Factors Impacting Ingredient Costs
- Pricing Analysis by Application
- U.S. Egg Replacement Market Outlook
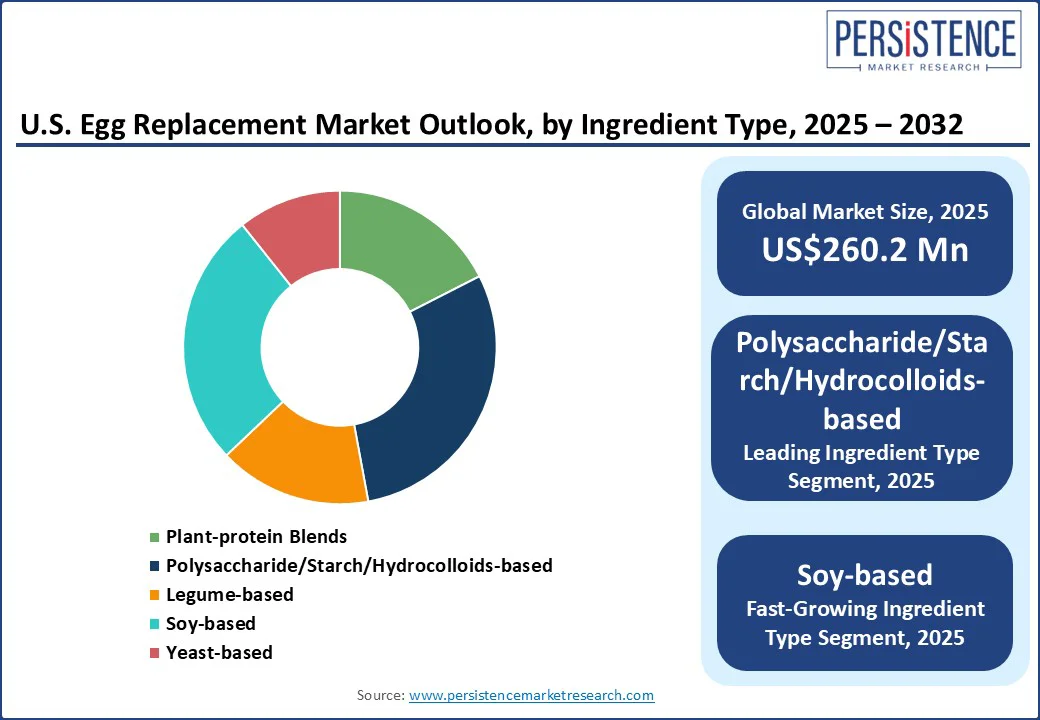
- U.S. Egg Replacement Market Outlook: Ingredient Type
- Introduction / Key Findings
- Historical Market Tier Type (US$ Mn) and Analysis, By Ingredient Type, 2019 - 2024
- Market Tier Type (US$ Mn) and Analysis and Forecast, By Ingredient Type, 2025 - 2032
- Plant-protein Blends
- Polysaccharide/Starch/Hydrocolloids-based
- Legume-based
- Soy-based
- Yeast-based
- Market Attractiveness Analysis: Ingredient Type
- U.S. Egg Replacement Market Outlook: Application
- Introduction / Key Findings
- Historical Market Tier Type (US$ Mn) Analysis, By Application, 2019 - 2024
- Market Tier Type (US$ Mn) Analysis and Forecast, By Application, 2025 - 2032
- Bakery and Confectionery
- Convenience Foods
- Sauces and Salad Dressings
- Dairy and Frozen Desserts
- Other Processed Foods
- Market Attractiveness Analysis: Application
- U.S. Egg Replacement Market Outlook: Ingredient Type
- U.S. Egg Replacement Market Outlook: Distribution Channel
- Key Highlights
- Historical Market Tier Type (US$ Mn) and Analysis, By Distribution Channel, 2019 - 2024
- Market Tier Type (US$ Mn) Analysis and Forecast, By Distribution Channel, 2025 - 2032
- Online Stores
- Supermarkets/Hypermarkets
- Convenience Stores
- Specialty Stores
- Market Attractiveness Analysis: Zone
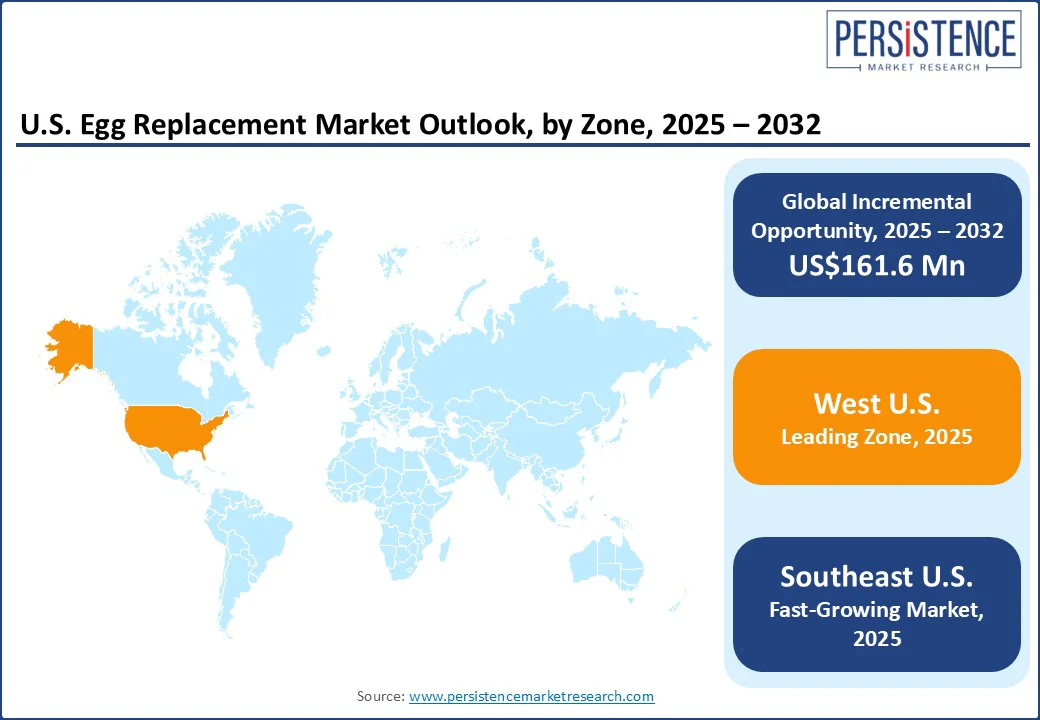
- U.S. Egg Replacement Market Outlook: Zone
- Key Highlights
- Historical Market Tier Type (US$ Mn) Analysis, By Zone, 2019 - 2024
- Market Tier Type (US$ Mn) Analysis and Forecast, By Zone, 2025 - 2032
- West U.S.
- Midwest U.S.
- Southwest U.S.
- Southeast U.S.
- Northeast U.S.
- Market Attractiveness Analysis: By Zone
- Competition Landscape
- Market Share Analysis, 2023
- Market Structure
- Competition Intensity Mapping
- Competition Dashboard
- Company Profiles (Details - Overview, Financials, Strategy, Recent Developments)
- Puratos
- Overview
- Solution Portfolio
- Key Financials
- Market Developments
- Market Strategy
- Cargill, Incorporated
- Archer Daniels Midland Company (ADM)
- Fiberstar, Inc.
- All American Foods, Inc.
- Natural Products, Inc.
- Manildra Group USA
- Devansoy Inc.
- J&K Ingredients, Inc.
- Ingredion Inc.
- Others
- Puratos
- Appendix
- Research Methodology
- Research Assumptions
- Acronyms and Abbreviations

Loading page data
Please wait a moment


