


- Carbon Capture & Storage
- E-Kerosene Market
E-Kerosene Market Size, Share, and Growth Forecast, 2026 - 2033
E-Kerosene Market by Production Process (Power-to-Liquid (PtL), Direct Air Capture (DAC), Others), Application (Aviation, Marine, Others), Renewable Source, and Regional Analysis for 2026 - 2033
E-Kerosene Market Size and Trends Analysis
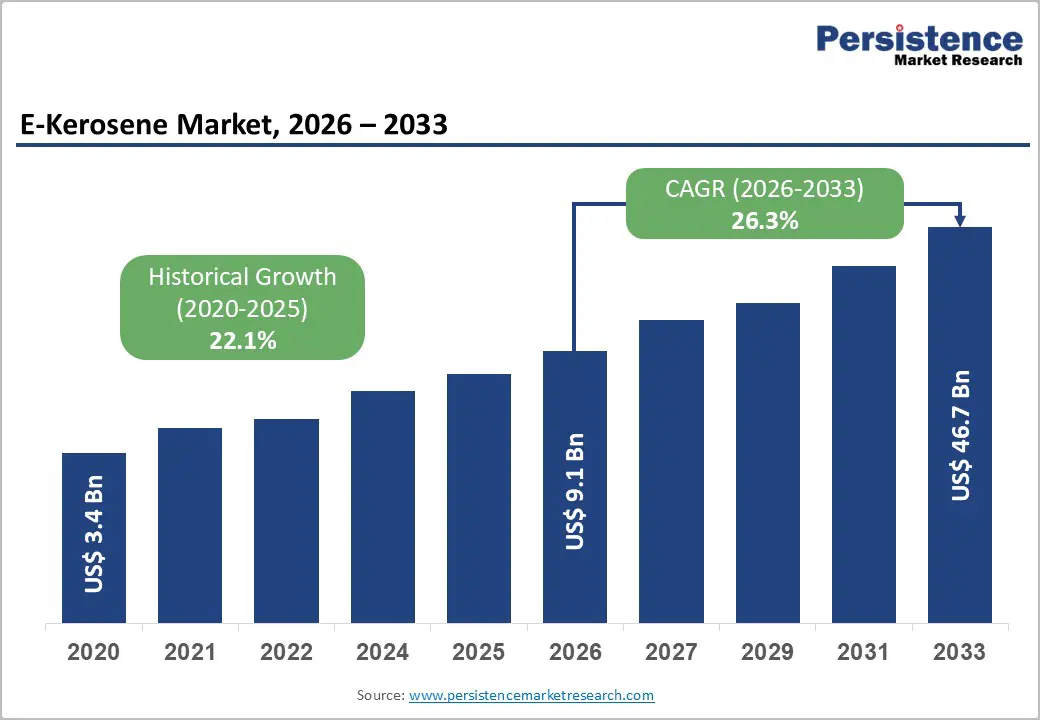
The global e-kerosene market size is likely to be valued at US$9.1 billion in 2026 and is expected to reach US$46.7 billion by 2033, growing at a CAGR of 26.3% between 2026 and 2033, driven by regulatory mandates for sustainable aviation fuels (SAF), expansion of power-to-liquid (PtL) production capacity, and rapid advancements in direct air capture (DAC) and renewable hydrogen technologies.
Commercial demonstrations between 2023 and 2025 validated technical feasibility at pilot and early industrial scale, encouraging investments from airlines, energy companies, and government-backed programs. Although production costs remain elevated, policy incentives and long-term offtake agreements are narrowing the cost gap, supporting a scalable commercialization pathway.
Key Industry Highlights:
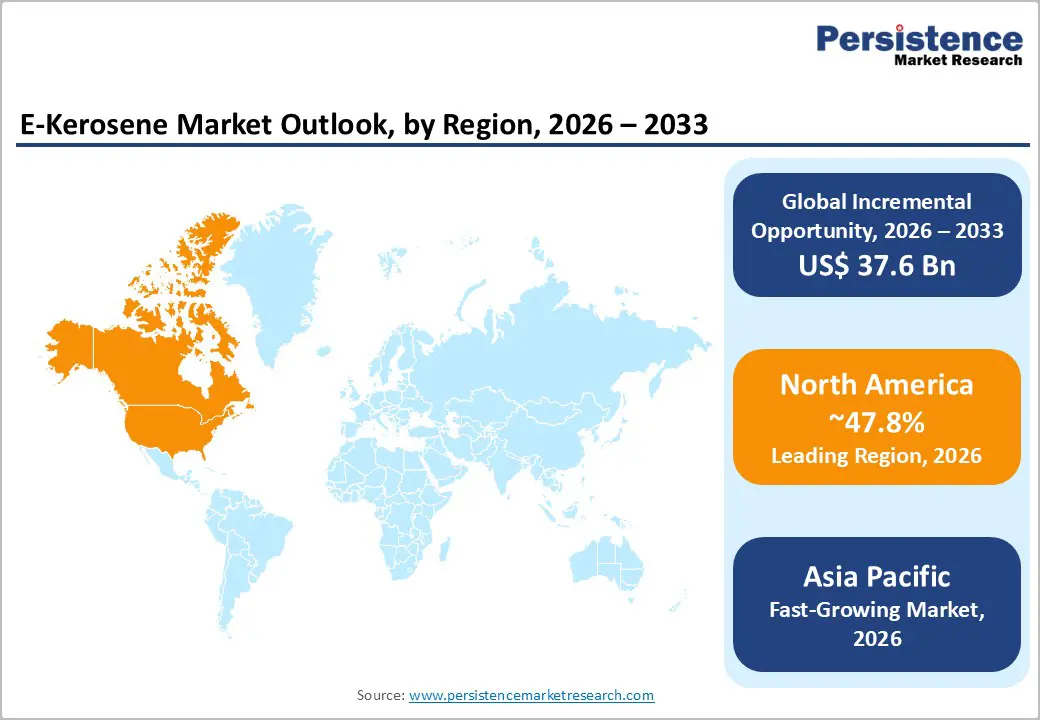
- Leading Region: North America is projected to hold the dominant position with 47.8% market share, driven by strong SAF policy incentives, advanced PtL and DAC deployment, and robust airline offtake agreements.
- Fastest-growing Region: Asia Pacific is projected to register the highest growth rate, supported by expanding renewable energy capacity and rising aviation demand.
- Investment Plans: Global investments are accelerating across PtL, DAC, and green hydrogen infrastructure, with multi-billion-dollar project pipelines concentrated in North America and Europe, focusing on large-scale commercial fuel production facilities.
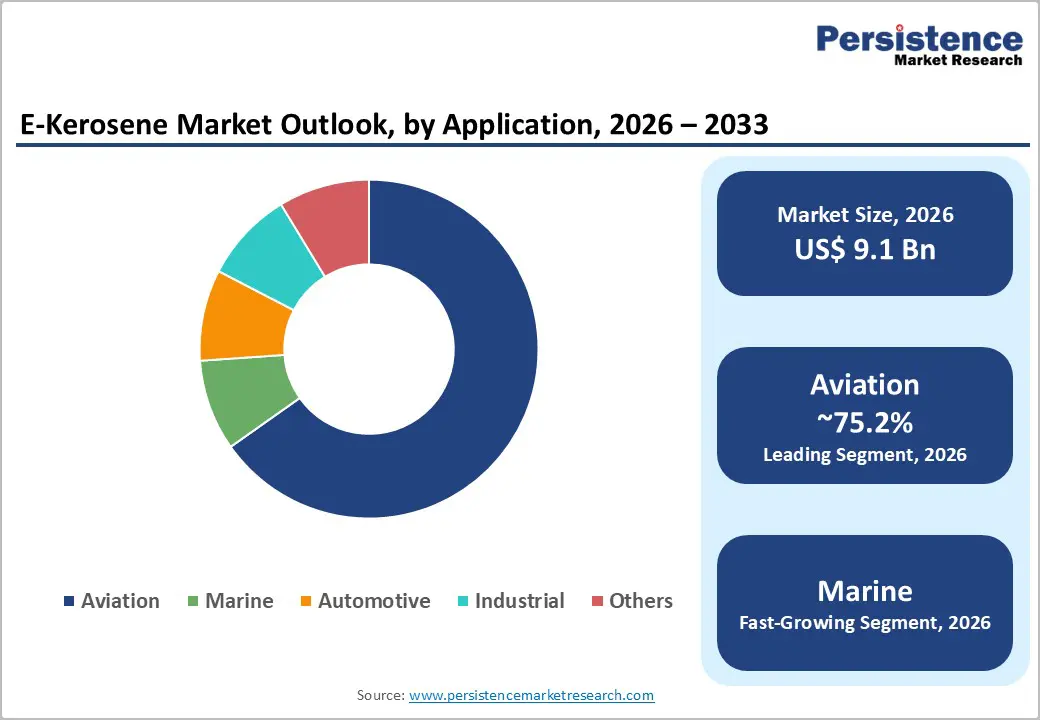
- Dominant Application: Aviation leads with an anticipated market share of 75.2%, driven by SAF mandates and the need for drop-in, high-energy-density fuels.
- Leading Renewable Source: Biomass dominates with an anticipated share of 46.4%, supported by established feedstock availability and mature biomass-to-liquid conversion technologies.
| Key Insights | Details |
|---|---|
| E-Kerosene Market Size (2026E) | US$9.1 Bn |
| Market Value Forecast (2033F) | US$46.7 Bn |
| Projected Growth (CAGR 2026 to 2033) | 26.3% |
| Historical Market Growth (CAGR 2020 to 2025) | 22.1% |
Market Factors - Growth, Barriers, and Opportunity Analysis
Growth Analysis - Policy Mandates and Fiscal Incentives
Government regulations and SAF blending mandates are the most critical drivers of e-kerosene demand. Policies such as mandated SAF blending quotas and tax incentives for low-carbon fuels create predictable demand and improve project economics. These frameworks effectively convert regulatory requirements into long-term purchase commitments, enabling project developers to secure financing for capital-intensive facilities. Financial incentives reduce production cost disparities between synthetic fuels and conventional jet fuel, accelerating adoption. Stable demand signals reduce revenue uncertainty, enabling faster project approvals, increased investor confidence, and accelerated commercialization across North America and Europe.
Declining Costs of Renewable Hydrogen and DAC Technologies
E-kerosene production relies heavily on green hydrogen and captured CO2, both of which are experiencing cost reductions due to technological advancements and scale. Electrolyzer manufacturing capacity is expanding globally, driving down unit costs, while improvements in DAC systems are increasing capture efficiency and lowering operational expenses. Increased deployment of renewable energy sources further reduces electricity costs, which constitute a major share of production expenses. Lower feedstock costs improve the levelized cost of e-kerosene, making it more competitive with fossil-based alternatives and enabling broader market penetration beyond early adopters.
Airline Commitments and Corporate Decarbonization Goals
Airlines and large corporations are committing to net-zero targets, driving long-term demand for sustainable fuels. Multi-year offtake agreements between fuel producers and airlines provide revenue certainty for emerging projects. These agreements also serve as a foundation for financing large-scale facilities. Corporate sustainability commitments, particularly in aviation and logistics, are accelerating demand for synthetic fuels. Strong offtake pipelines shorten the transition from pilot to commercial-scale production and concentrate investments in regions with supportive regulatory and renewable energy frameworks.
Barrier Analysis - High Capital and Operating Costs
E-kerosene production is highly capital-intensive due to the integration of electrolysis, direct air capture (DAC), and Fischer-Tropsch synthesis technologies within a single value chain. Each of these components requires significant upfront investment, with electrolyzers and DAC units alone representing a substantial portion of total project costs. Compared to conventional petroleum refining, capital expenditure per unit of output remains considerably higher, especially for first-of-a-kind commercial plants. Operational costs are equally sensitive to fluctuations in renewable electricity prices and CO2 sourcing expenses, both of which directly influence production economics. In regions where renewable energy costs remain elevated or grid access is constrained, profitability becomes challenging. High production costs necessitate continued policy support, subsidies, and premium pricing mechanisms, limiting widespread adoption in cost-sensitive markets during the early stages of commercialization and delaying parity with fossil-based fuels.
CO2 Supply Constraints and Lifecycle Certification Complexity
Reliable access to sustainable and low-carbon CO2 is a critical requirement for e-kerosene production, yet supply chains for captured carbon remain underdeveloped. While DAC technologies are scaling, current capacity is insufficient to meet the projected demand from large-scale PtL facilities. Additionally, sourcing CO2 from industrial emissions introduces variability in carbon intensity, which can affect fuel certification. Lifecycle emissions accounting frameworks differ across regions, creating compliance complexities and potential barriers to international trade. Certification processes for SAF and synthetic fuels are still evolving, requiring producers to meet stringent sustainability criteria. These constraints introduce uncertainty in project development timelines, increase due diligence requirements for investors, and may delay large-scale deployment until standardized carbon accounting frameworks and CO2 supply networks are more mature.
Opportunity Analysis - Co-location with Renewable Energy and Industrial Hubs
Strategically co-locating PtL production facilities near abundant renewable energy sources and established industrial clusters presents a significant opportunity to optimize cost structures. By integrating renewable electricity generation, hydrogen production, and fuel synthesis in a single location, developers can minimize energy transmission losses and reduce logistics costs associated with CO2 transport. Industrial hubs, particularly ports and refining zones, offer existing infrastructure such as storage, pipelines, and distribution networks that can be leveraged to lower capital expenditure. Co-location also enables better utilization of waste heat and by-products, improving overall system efficiency. This approach enhances project viability, accelerates permitting and construction timelines, and creates scalable production models that can be replicated across regions with favorable renewable resource availability.
Expansion into Marine and Industrial Fuel Markets
While aviation remains the primary target market, non-aviation sectors, especially marine shipping and heavy industry, offer immediate and scalable opportunities for e-kerosene adoption. The shipping industry faces increasing regulatory pressure to reduce emissions, prompting demand for alternative fuels that can meet long-haul energy requirements. Synthetic fuels derived from e-kerosene processes can serve as viable substitutes for conventional marine fuels without requiring major engine modifications. Industrial sectors, including chemicals and heavy manufacturing, are also exploring low-carbon fuel options to meet sustainability targets. Expanding into these adjacent markets allows producers to diversify revenue streams, reduce reliance on aviation demand cycles, and utilize early production volumes more effectively, thereby improving overall project economics and accelerating market penetration.
Category-wise Analysis
Application Insights
Aviation is expected to account for approximately 75.2% of the market share in 2026, making it the dominant application segment. This leadership is driven by strong regulatory mandates for sustainable aviation fuel (SAF), combined with the aviation sector’s limited alternatives for deep decarbonization. Synthetic kerosene serves as a drop-in fuel, requiring no modifications to aircraft engines or airport fueling infrastructure, which accelerates adoption. Airlines are increasingly integrating SAF into long-term sustainability strategies through multi-year offtake agreements. For example, major global carriers have partnered with fuel producers to secure future supply, ensuring compliance with emissions targets and reducing exposure to carbon pricing mechanisms. Aviation will remain the primary demand anchor for e-kerosene through 2033, supported by policy enforcement and fleet-level decarbonization commitments.
The marine segment is projected to register the fastest growth rate over the forecast period, driven by tightening emissions regulations and industry-wide decarbonization efforts. Shipping companies are actively exploring low-carbon fuel alternatives to meet international emissions reduction targets and avoid regulatory penalties. Synthetic kerosene and related e-fuels are gaining traction as viable substitutes for conventional marine fuels, particularly for long-haul shipping routes where electrification is not feasible. For instance, several global shipping operators are piloting synthetic fuel blends in collaboration with energy providers. Regulatory pressure, corporate sustainability commitments, and the need for scalable, energy-dense fuel alternatives. Marine applications provide a critical secondary market that can absorb early production volumes and support revenue diversification for producers.
Renewable Source Insights
Biomass is anticipated to account for approximately 46.4% of the market share in 2026, maintaining its position as the leading renewable source. This dominance is attributed to established feedstock supply chains, mature biomass-to-liquid (BtL) conversion technologies, and relatively lower initial infrastructure requirements compared to fully synthetic pathways. Agricultural residues, forestry waste, and municipal solid waste serve as key feedstocks, particularly in regions with strong bioenergy ecosystems. For example, several European and North American projects utilize forestry residues and waste biomass to produce renewable fuels at commercial and pilot scales. Biomass-based pathways will continue to play a transitional role in scaling sustainable fuel production while fully synthetic routes mature.
Solar energy is expected to be the fastest-growing renewable source segment, driven by declining photovoltaic costs and advancements in solar-driven fuel synthesis technologies. Large-scale solar installations are increasingly being integrated with electrolysis systems to produce green hydrogen, a critical input for e-kerosene production. In high solar irradiance regions such as the Middle East, Australia, and parts of Asia Pacific, developers are leveraging abundant solar resources to achieve lower production costs. For instance, pilot projects utilizing concentrated solar thermal systems are demonstrating direct solar-to-fuel conversion pathways. High solar resource availability, declining solar infrastructure costs, and improved efficiency of hydrogen production technologies. Solar-based production is likely to redefine cost structures in the long term, positioning it as a key driver of large-scale e-kerosene commercialization.
Regional Insights
North America E-Kerosene Market Trends - Policy-Backed Scaling and SAF-Driven Commercialization
North America is projected to lead the market, accounting for 47.8% of market share in 2026, with the U.S. serving as the central growth engine. This leadership position is underpinned by strong federal policy support, including tax incentives for sustainable aviation fuel (SAF) and funding for clean hydrogen initiatives. The region benefits from a well-established innovation ecosystem, where advanced electrolyzer manufacturing, carbon capture technologies, and fuel synthesis capabilities are rapidly scaling. For instance, companies such as LanzaTech are actively commercializing carbon-to-fuel pathways, while HIF Global is advancing large-scale e-fuel projects in collaboration with energy and automotive partners. These developments are reinforcing North America’s early-mover advantage in synthetic fuel commercialization.
Growth in the region is further supported by expanding renewable energy capacity, particularly wind and solar, which are critical for cost-effective green hydrogen production. Strong airline participation, including long-term SAF offtake agreements by major U.S. carriers, is creating stable demand pipelines that enhance project bankability. The regulatory environment remains favorable, with clear lifecycle emissions standards and certification frameworks that reduce compliance uncertainty for producers.
Investment trends indicate significant capital inflows from private equity firms and major energy companies into PtL and DAC projects. Co-location strategies, such as siting production facilities near industrial clusters along the Gulf Coast, are improving operational efficiency and reducing logistics costs, positioning North America as a hub for large-scale e-kerosene deployment.
Europe E-Kerosene Market Trends - Regulation-Led Demand and Integrated PtL Innovation
Europe represents a highly strategic market for e-kerosene, driven by stringent environmental regulations and coordinated policy frameworks aimed at achieving carbon neutrality. Countries including Germany, the U.K., France, and Spain are leading the region’s progress through strong government backing and industrial collaboration. The implementation of SAF mandates under regional aviation policies has created a clear demand trajectory for synthetic fuels. Germany, for example, has emerged as a key innovation center, with companies such as Sunfire and INERATEC developing modular PtL systems and scaling commercial production capabilities. Similarly, Norway’s Norsk e-Fuel is advancing projects that leverage renewable energy and carbon capture to produce aviation fuels at scale.
The region benefits from abundant renewable energy resources, particularly offshore wind in Northern Europe and solar energy in Southern Europe, which support green hydrogen production. Regulatory harmonization across the European Union ensures consistent standards for fuel certification and carbon accounting, enabling cross-border trade and investment. Public-private partnerships are playing a critical role in accelerating deployment, with governments co-financing pilot and demonstration plants. For instance, collaborations between technology providers and energy companies are enabling integrated value chains that combine CO2 capture, hydrogen production, and fuel synthesis. These coordinated efforts are strengthening Europe’s position as a global leader in sustainable fuel innovation and are expected to drive continued market expansion.
Asia Pacific E-Kerosene Market Trends - Hydrogen Expansion and Cost-Driven Rapid Growth
Asia Pacific is the fastest-growing region in the e-kerosene market, driven by rising energy demand, rapid industrialization, and increasing air travel across emerging economies. Countries such as China, Japan, India, and members of ASEAN are investing heavily in hydrogen infrastructure and synthetic fuel technologies to support long-term decarbonization goals. China’s strong manufacturing base is enabling large-scale production of electrolyzers and related components, reducing capital costs for PtL projects. Japan is focusing on advanced hydrogen strategies, with companies such as Mitsubishi Heavy Industries exploring integrated fuel production systems that combine hydrogen generation with carbon recycling technologies.
India is leveraging its abundant solar energy resources to develop cost-efficient green hydrogen projects, which can serve as a foundation for future e-kerosene production. Meanwhile, Australia and Southeast Asian nations are positioning themselves as potential export hubs for low-carbon fuels due to their favorable renewable energy conditions. The region’s growth is also supported by increasing international partnerships, where global energy companies collaborate with local firms to develop large-scale projects. Although regulatory frameworks are still evolving, governments are gradually introducing policies that encourage investment in clean energy and fuel technologies. These developments, combined with strong demand fundamentals and cost advantages, are expected to accelerate the adoption of e-kerosene across Asia Pacific in the coming years.
Competitive Landscape
The global e-kerosene market is evolving from a fragmented structure to a more consolidated ecosystem. Early-stage development is dominated by specialized technology providers and project developers. As the market matures, partnerships with energy majors and airlines are driving consolidation and scaling production capabilities.
Key players are focusing on vertical integration, strategic partnerships, and geographic expansion. Emphasis is placed on reducing production costs, securing long-term offtake agreements, and leveraging renewable energy resources for competitive advantage.
Key Industry Developments:
- In July 2025, Synhelion partnered with SWISS International Air Lines to integrate solar-based sustainable aviation fuel into flight operations, representing one of the first real-world aviation deployments of solar-derived e-kerosene alternatives.
- In January 2026, HIF Global partnered with Toyota and MITTA to launch the “Route Zero” demonstration project in Patagonia, showcasing the viability of synthetic fuels in hybrid mobility applications across long-distance, real-world conditions.
Companies Covered in E-Kerosene Market
- Sunfire
- INERATEC
- Synhelion
- Climeworks
- Carbon Engineering
- Norsk e-Fuel
- Velocys
- HIF Global
- LanzaTech
- Neste
- Shell
- TotalEnergies
- SkyNRG
- Carbon Clean
- Topsoe
- Sasol
Frequently Asked Questions
The global e-kerosene market is estimated to be valued at US$9.1 billion in 2026.
The e-kerosene is projected to reach US$46.7 billion by 2033.
Key trends include rapid expansion of power-to-liquid (PtL) projects, increasing adoption of direct air capture (DAC) technologies, growing airline offtake agreements for SAF, and rising integration of renewable hydrogen production with fuel synthesis.
The aviation segment is the leading application, accounting for an anticipated share of 75.2%, due to strong SAF demand and regulatory mandates.
The e-kerosene market is expected to grow at a CAGR of 26.3% from 2026 to 2033.
The key players include Sunfire, INERATEC, Synhelion, Climeworks, and HIF Global.


