


- Automotive Components & Materials
- Two Wheeler Accessories Market
Two Wheeler Accessories Market Size, Share, and Growth Forecast 2026–2033
Two Wheeler Accessories Market by Product Type (Protective Gears, Performance & Functional Accessories, Electrical & Electronic Accessories, Comfort & Utility Accessories, Styling & Customization Accessories, Maintenance & Consumables, Others), Vehicle Type (Standard/Commuter Motorcycles, Cruiser Motorcycles, Sports Motorcycles, Adventure & Touring Motorcycles, Scooters & Mopeds, Electric Two-Wheelers, Others), Distribution Channel (Online, Offline), by Sales Channel (OEM/OES, Aftermarket/IAM), and Regional Analysis, 2026–2033
Global Two Wheeler Accessories Market Size and Trend Analysis
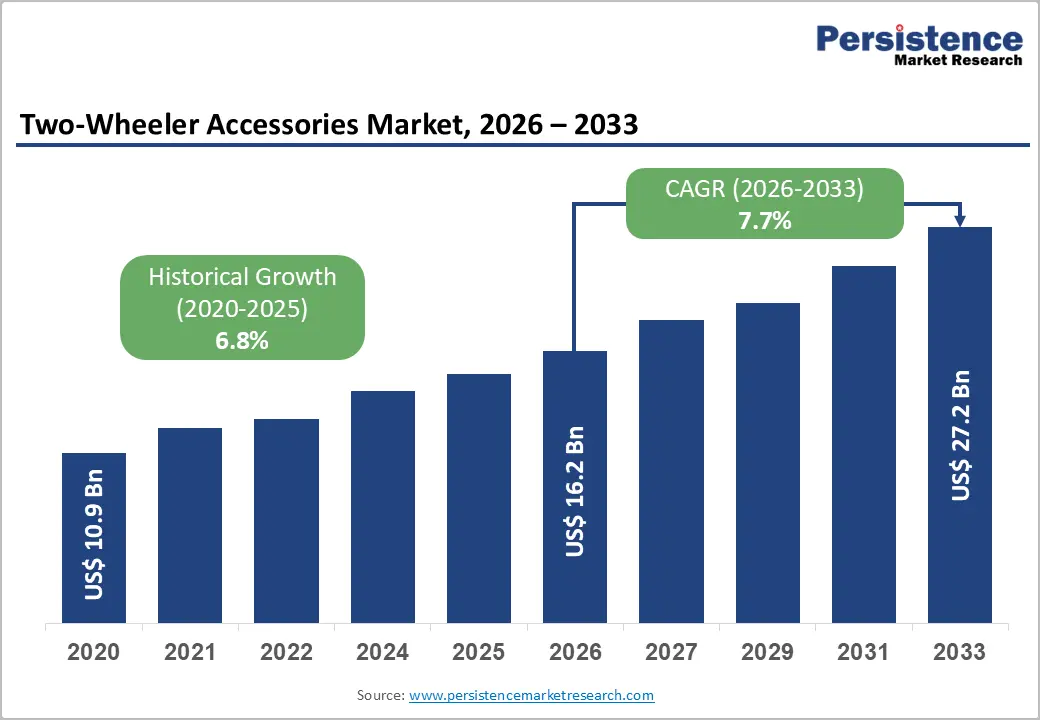
The global two-wheeler accessories market is projected to reach approximately US$ 16.20 billion in 2026 and further expand to US$ 27.23 billion by 2033, registering a strong 7.7% CAGR during the forecast period.
Market growth is being strongly supported by tightening helmet regulations across more than 40 countries, rising road safety awareness, and increasing two-wheeler ownership globally. Regulatory frameworks such as the European Union’s Urban Mobility Framework and India’s Motor Vehicles (Amendment) Act are accelerating demand for certified protective gear. Simultaneously, rising motorcycle registrations and growing exports across Asia and Europe continue expanding the global installed base for accessories.
Key Market Highlights
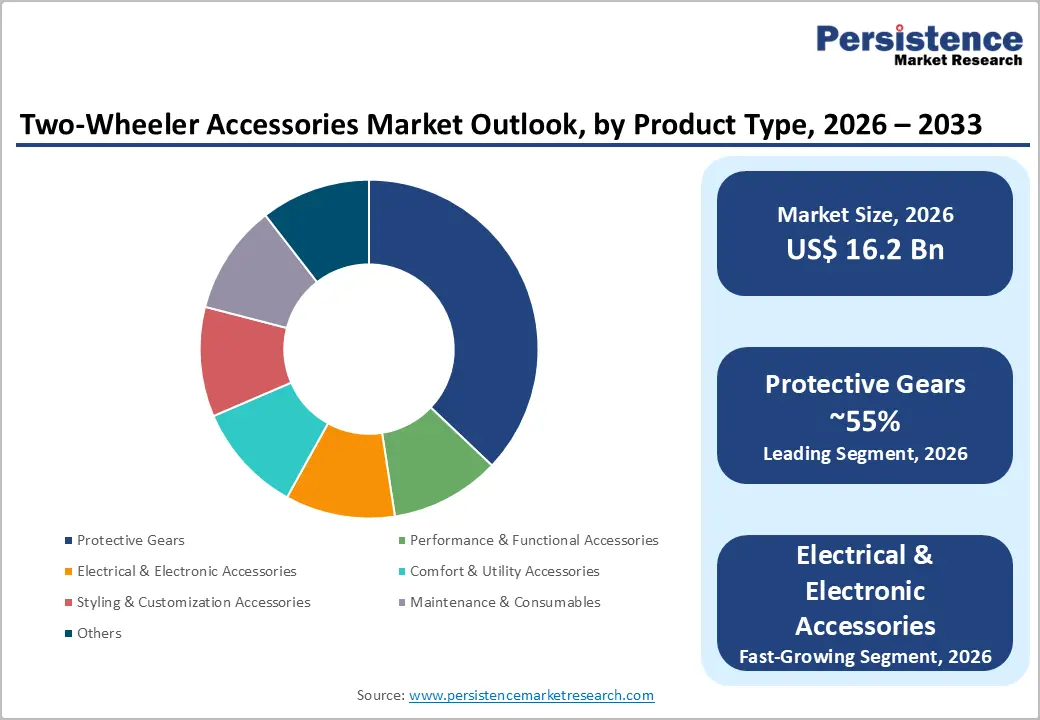
- Protective Gear Dominance: Protective gears lead with 29.4% share valued at US$ 4.76 Billion in 2026, supported by mandatory helmet laws, recurring replacement cycles, and growing premium riding gear adoption globally.
- Connected Accessories Growth: Electrical and electronic accessories represent the fastest-growing segment, driven by smartphone integration, AIS-140 regulations, affordable smart devices, and rising adoption of GPS mounts, TPMS systems, and connected riding accessories.
- Commuter Motorcycle Leadership: Standard and commuter motorcycles account for 41.7% revenue share worth US$ 6.76 Billion in 2026, supported by strong demand from delivery logistics, urban commuting, and emerging market transportation dependence.
- Electric Two-Wheeler Expansion: Electric two-wheelers are projected to witness the highest CAGR through 2030, fueled by EV regulations, China’s 350-million-unit e-bike ecosystem, battery-swapping infrastructure, and OEM-led smart accessory monetization strategies.
- Offline Channel Strength: Offline distribution dominates with 68.6% share totaling US$ 11.11 Billion in 2026, supported by fitment-dependent purchases, dealership installations, and expanding organized retail franchise networks across Asia.
- E-commerce Acceleration: Online accessory sales are witnessing double-digit CAGR growth, driven by Amazon and Flipkart expansion, wider SKU availability, COD penetration, YouTube-influenced purchasing behavior, and improving reverse logistics infrastructure.
- Aftermarket Revenue Leadership: The aftermarket/IAM segment commands 66.2% market share valued at US$ 10.72 Billion in 2026, benefiting from customization culture, long ownership cycles, and strong global demand for performance enhancement products.
- Europe’s Market Scenario: Europe holds 24.5% global share and is projected to grow at a 7.9% CAGR, supported by ECE 22.06 helmet regulations, touring culture, and accelerating zero-emission mobility adoption.
Market Dynamics
Drivers - Mandatory Safety Legislation Elevating Protective Accessory Adoption Across Emerging and Developed Markets
Regulatory tightening on rider safety is forcing a broad-based upgrade cycle that compresses the replacement interval for helmets, gloves, and body armour, a direct revenue multiplier for accessory suppliers. India's Ministry of Road Transport and Highways issued AIS-156 (Phase 1) helmet quality standards that became fully enforceable in 2023, requiring Bureau of Indian Standards (BIS) certification for all helmets sold domestically, effectively eliminating non-compliant low-cost imports and lifting average selling prices.
Over the next two to three years, as Phase 2 of AIS-156 introduces impact absorption benchmarks aligned with ECE 22.06 European norms, manufacturers investing in certified production lines such as Steelbird Hi-Tech India, which expanded its Baddi facility in 2023, will capture a disproportionate share of a structurally higher-value safety segment.
Rising Adventure and Touring Motorcycle Culture Driving Premium Accessory Spend Per Vehicle
Adventure motorcycling's mainstreaming into a lifestyle category is shifting the per-vehicle accessories spend from sub-US$200 utility purchases to multi-category premium outfitting panniers, GPS mounts, crash bars, and full-body protective suits that collectively outperform commuter accessory ticket sizes by a factor of three to four. Triumph Motorcycles launched its Tiger Sport 660 accessories line in 2023 with over 80 catalogued OEM accessories, illustrating how OEMs themselves are monetising this cultural shift and validating the commercial depth of the adventure segment. By 2026–2027, the Fédération Internationale de Motocyclisme (FIM)'s expanding adventure rally calendar, including new regional events in Southeast Asia, will keep aspirational demand high and sustain premium accessory attach rates.
Restraints - Counterfeit Accessories Undercutting Certified Manufacturers and Eroding Consumer Trust
Counterfeit helmets and brake components flood markets through informal retail channels, directly suppressing certified-product volume and forcing legitimate suppliers to compete against goods priced 30–50% below compliant benchmarks. The Automotive Component Manufacturers Association of India (ACMA) estimated in 2023 that counterfeit auto and two-wheeler parts cost the formal industry approximately INR 2,200 crore (roughly US$ 265 million) annually in lost sales, a burden falling disproportionately on branded mid-tier players. New entrants without established distribution networks face the sharpest margin erosion, since they lack the brand recognition needed to justify price premiums against grey-market alternatives.
Opportunities - Smart Connectivity Accessories Represent an Underpenetrated High-Margin Category for Technology-Forward Suppliers
Consumer electronics and motorcycle accessory convergence creates a compelling investment thesis for suppliers capable of combining Bluetooth mesh networking, noise-cancelling audio, and crash-detection algorithms into helmet-integrated or handlebar-mounted devices that command 2–3× the ASP of conventional accessories. Cardo Systems launched its PACKTALK NEO intercom system in 2023, achieving DMC (Dynamic Mesh Communication) connectivity across up to 15 riders simultaneously, a specification that directly addressed group touring communities and drove measurable retail sell-through across Europe.
For this opportunity to fully materialise, suppliers must secure CE and FCC Part 15 certification proactively, and distribution partnerships with adventure-touring OEM dealership networks will be the critical gatekeeping condition.
Electric Two-Wheeler Accessory Ecosystems Are an Emerging White Space for Platform-Oriented Players
The rapid proliferation of electric two-wheelers creates a genuinely new accessory layer of battery management peripherals, regenerative braking upgrade kits, dedicated EV-compatible luggage systems, and charging infrastructure accessories that existing combustion-focused catalogue holders have not yet systematically addressed. Ola Electric, which crossed 500,000 cumulative EV scooter deliveries in India by mid-2024 per its regulatory disclosures, has begun listing co-branded accessories through its app-based retail channel, signalling that vertically integrated EV OEMs are moving to capture accessory wallet share before the aftermarket organises.
Platform players who build EV-specific accessory ranges compatible across multiple OEM platforms rather than single-brand solutions will be best positioned, provided interoperability standards from bodies such as ARAI (Automotive Research Association of India) advance in parallel.
Category-wise Insights
Protective gears remain the leading segment in the global two wheeler accessories market, accounting for 29.4% share in 2026, equivalent to approximately US$ 4.76 Billion in revenue. The segment’s dominance is strongly supported by mandatory safety regulations and rising consumer awareness regarding rider protection. In high two-wheeler penetration countries such as Indonesia and Vietnam, where motorcycles represent more than 70% of registered vehicles according to the ASEAN Automotive Federation, helmets are considered an essential and legally compulsory purchase, creating a consistent replacement cycle every three to five years regardless of economic conditions.
Beyond commuter usage, the growing popularity of motorsports, touring, and adventure riding is further increasing demand for premium protective equipment including CE-certified knee and elbow guards, reinforced gloves, riding jackets, and full-body protective suits. This combination of regulatory enforcement, repeat purchasing behavior, and premiumization trends continues to strengthen the segment’s leadership position across both mass-market and high-performance categories.
Closely linked to the rising focus on rider convenience and connected mobility, the Electrical & Electronic Accessories segment is emerging as the fastest-growing category within the global two wheeler accessories market. The segment is being fueled by the rapid adoption of smartphone cradles, GPS navigation systems, USB charging ports, tyre pressure monitoring systems, and smart connectivity devices, particularly across South and Southeast Asia where smartphone penetration among riders is extremely high.
Affordable pricing of consumer electronic accessories, often below US$ 50, has accelerated adoption among urban commuters and delivery riders. In 2024, RAM Mounts expanded its two-wheeler accessory ecosystem with holders designed specifically for foldable smartphones and action cameras, targeting the growing number of riders creating content for platforms such as YouTube and Instagram. Supporting this trend, GoPro Inc.’s 2023 annual report identified motorcycling as one of its top three consumer activity categories.
Furthermore, the gradual implementation of India’s AIS-140 vehicle tracking regulations for commercial two-wheelers is expected to significantly boost demand for factory-compatible electronic accessories, enabling this segment to maintain growth above the overall market CAGR through 2030.
Vehicle Type Insights
Standard/Commuter Motorcycles continue to dominate the global two wheeler accessories market, accounting for 41.7% of total market revenue in 2026, equivalent to US$ 6.76 Billion. This leadership is strongly linked to the massive installed base of commuter motorcycles across Asia, Africa, and Latin America, where two-wheelers serve as essential daily transportation rather than recreational vehicles. In countries such as India, delivery riders working for platforms including Swiggy and Zomato increasingly depend on accessories such as cargo racks, handlebar-mounted phone holders, weatherproof seat covers, and engine guards to improve operational efficiency and reduce maintenance downtime.
These purchases are largely necessity-driven, reflecting the commercial utility of commuter motorcycles in urban mobility and logistics ecosystems. Supporting this trend, data from the Society of Indian Automobile Manufacturers (SIAM) shows that motorcycles in the 100–125cc category contributed more than 60% of India’s total two-wheeler domestic sales in FY2024, reinforcing the segment’s position as the largest and most stable revenue contributor to the global accessories industry.
While commuter motorcycles remain the market’s revenue backbone, electric two-wheelers are emerging as the fastest-growing vehicle category, driven by regulatory reforms, rapid electrification, and OEM-led accessory innovation. China’s Ministry of Industry and Information Technology (MIIT) accelerated this transition through implementation of the upgraded GB 17761-2018 electric bicycle safety standard, which mandated speed limiters, enhanced battery enclosures, and compulsory reflector systems, creating a large-scale replacement and compliance-driven accessories cycle across China’s e-bike fleet of more than 350 million units, according to the China Association of Automobile Manufacturers (CAAM).
At the same time, leading manufacturers such as Yadea Group are expanding beyond vehicle sales into branded accessory ecosystems, introducing products including smart locks, anti-theft GPS trackers, and ergonomic seating upgrades. This strategy is increasingly being replicated by companies such as NIU Technologies, highlighting the growing importance of accessory monetisation in the EV segment. Furthermore, the expansion of battery-swapping networks by operators like Gogoro across Taiwan and Southeast Asia is expected to create entirely new accessory categories focused on battery handling, storage, and standardized carrying systems, supporting long-term market growth.
Distribution Channel Insights
Offline distribution channels continue to dominate the global two wheeler accessories market, accounting for 68.6% share in 2026, equivalent to US$ 11.11 billion, primarily due to the highly fitment-dependent nature of several key accessory categories. Products such as helmets require accurate sizing, visor compatibility checks, and liner adjustments, making in-person evaluation critical for consumers.
In addition, independent two-wheeler workshops and branded dealership service centers across Southeast Asia act as major purchasing hubs for maintenance consumables, engine guards, crash protectors, and exhaust upgrades, where technicians directly recommend and install accessories during routine servicing. This creates a strong cross-selling ecosystem that online platforms struggle to replicate. The growth of organized offline retail is further strengthening this dominance, as demonstrated by MOTOTREX, which operated more than 600 franchise outlets in India as of 2024, offering consumers branded inventory combined with professional installation and fitment services.
Despite offline retail leading the rapid expansion of e-commerce ecosystems is significantly reshaping consumer purchasing behavior and accelerating online channel growth. Between 2022 and 2024, Amazon through its Accelerate India Seller Program and Flipkart via its dedicated 2W Store vertical aggressively onboarded regional helmet and accessories brands, enabling access to a much wider product portfolio than traditional retail shelves can accommodate. This has particularly benefited non-fitment categories such as riding jackets, gloves, mobile mounts, and handlebar grips, where consumers increasingly rely on YouTube reviews and digital product comparisons before purchasing online.
Amazon’s India storefront alone featured more than 2 million motorcycle accessory SKUs by early 2024, highlighting the scale of online product availability. Furthermore, increasing Cash on Delivery (COD) penetration across Tier-2 and Tier-3 cities, combined with improving reverse logistics and lower return handling costs through courier aggregation networks, is expected to support double-digit annual growth in online riding apparel and accessories sales through 2030, gradually narrowing the gap between offline and digital distribution channels.
Sales Channel Insights
The Aftermarket/Independent Aftermarket (IAM) channel continues to dominate the global two-wheeler accessories market, likely to account for 66.2% of total revenue in 2026. This leadership is primarily driven by the long-term ownership cycle of two-wheelers, where riders typically invest in accessories gradually over a two-to-five-year period after purchasing the vehicle. Unlike OEM-installed accessories that are generally limited to the initial purchase stage, aftermarket channels benefit from continuous demand for personalization, performance enhancement, and aesthetic upgrades.
In developed markets such as the United States, customization-focused riders frequently purchase premium aftermarket products such as performance exhaust systems from brands including Yoshimura R&D of America, where slip-on exhaust kits are priced between US$ 300 and US$ 900 and are often among the first upgrades made within six months of vehicle ownership. Reflecting the strength of this ecosystem, the Specialty Equipment Market Association reported that the U.S. motorcycle and powersports accessories aftermarket generated nearly US$ 1.4 billion in retail sales in 2023, highlighting the highly established and institutionalized nature of IAM demand globally.
While the aftermarket remains the dominant revenue contributor, the OEM/OES segment is emerging as the fastest-growing channel as manufacturers increasingly integrate accessories directly into the vehicle purchasing process to improve dealership profitability and enhance customer retention. Facing margin pressure on core vehicle sales, OEMs are leveraging factory-fitted and digitally configurable accessories to increase per-unit revenue without expanding dealership infrastructure.
Regional Insights
North America Two Wheeler Accessories Market Trends and Insights
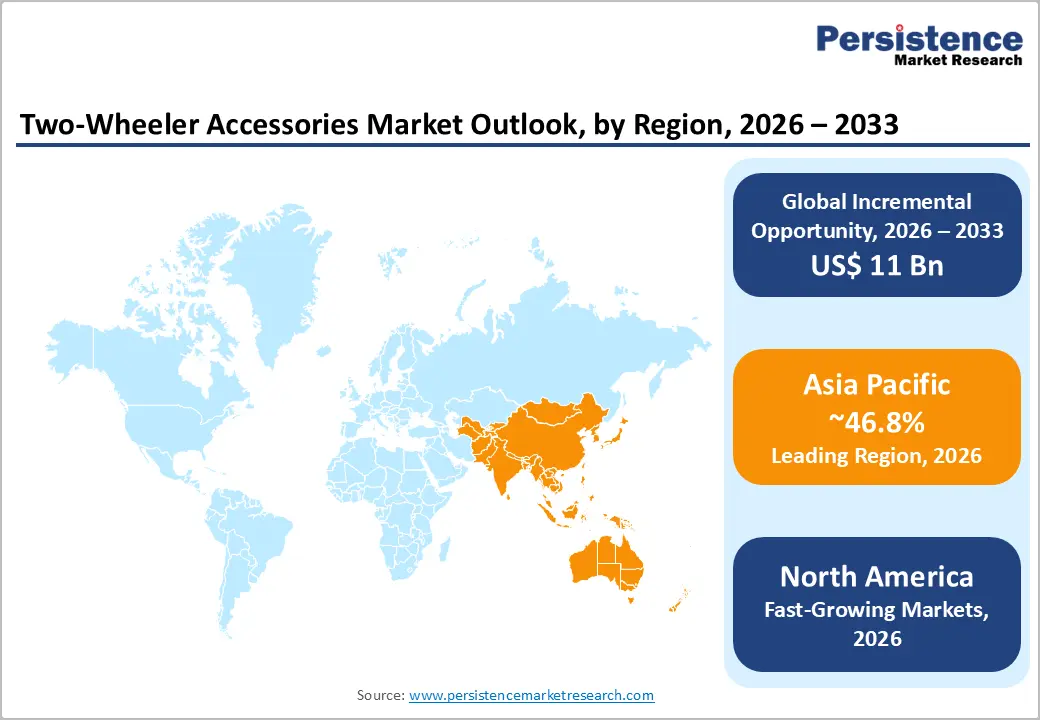
North America accounts for 18.6% of the global two wheeler accessories market in 2026, representing US$ 3.1 Billion, with market composition skewed toward premium recreational accessories driven by the region's strong cruiser and adventure motorcycle culture. The National Highway Traffic Safety Administration (NHTSA)'s 2023 motorcycle safety report documented a 5.4% rise in motorcycle fatalities in 2022, catalysing renewed state-level helmet law discussions that are expected to support safety accessory demand. Premiumisation and customisation spending, particularly in the Harley-Davidson owner community, will sustain above-average accessory ticket sizes through 2033.
United States Two Wheeler Accessories Market Size
The United States two wheeler accessories market represents 86% of the North America regional market in 2026, underpinned by a recreational riding culture where aftermarket customisation is a socially embedded spending category, not a safety obligation. Harley-Davidson's Genuine Motor Parts & Accessories division, which generated US$ 382 million in revenue in FY2023, demonstrates the depth of OEM-adjacent accessory demand even within a single brand ecosystem. Digital-first accessory platforms including RevZilla (acquired by Comoto Holdings) are capturing a growing share of this spend by combining expert editorial content with same-day fulfilment infrastructure.
Europe Two Wheeler Accessories Market Trends and Insights
Europe accounts for 24.5% of the global two wheeler accessories market in 2026, and operates as the fast-growing region at an estimated CAGR of 7.9%, propelled by the continent's dense touring route infrastructure and the European Commission's accelerating push toward zero-emission urban mobility. The ECE Regulation No. 22 (Rev. 06) helmet standard, fully mandatory across EU member states from January 2024, is driving a mandatory helmet replacement cycle estimated to affect millions of non-compliant units currently in circulation. Germany, France, and the UK collectively generate approximately 69% of European accessories revenue, concentrating competitive intensity in markets where both compliance-driven and lifestyle-driven demand coexist.
Germany Two Wheeler Accessories Market Size
The Germany two wheeler accessories market represents 29.4% of the Europe regional market in 2026, equivalent to US$ 1.17 Billion, driven by the country's outsized adventure and touring motorcycle culture and one of Europe's highest per-capita motorcycle ownership rates. ADAC (Allgemeiner Deutscher Automobil-Club), Europe's largest motoring organisation with over 21 million members, regularly publishes helmet and protective gear safety rankings that directly influence consumer purchasing decisions toward premium certified products. BMW Motorrad's System 7 Carbon helmet line, retailing above €600 in Germany, exemplifies the premium price tolerance that sustains high-value accessory revenue in this market.
United Kingdom Two Wheeler Accessories Market Size
The United Kingdom two wheeler accessories market represents 21.7% of the Europe regional market in 2026, equivalent to US$ 860 million, with commuter motorcycle and scooter accessories forming a significant demand base in London and other major cities, where two-wheelers provide congestion-exempt daily transport.
The Driver and Vehicle Licensing Agency (DVLA) recorded over 1.3 million licensed motorcycles in Great Britain in 2023, further expanding the installed base requiring accessories. The UK's post-Brexit independent alignment with UN ECE helmet standards rather than automatic EU adoption creates a sustained need for dual-compliant products and slightly lengthens specification cycles for continental accessory brands entering the market.
France Two Wheeler Accessories Market Size
The France two wheeler accessories market represents 18.2% of the Europe regional market in 2026, equivalent to US$ 720 million, supported by France's position as one of Europe's largest scooter markets and the French government's Bonus Écologique subsidy scheme, which accelerated electric two-wheeler adoption through 2023–2024. FFMC (Fédération Française des Motards en Colère), France's primary motorcycle riders' advocacy group, has actively campaigned for motorway access for motorcycles and improved safety infrastructure, indirectly driving organised demand for visibility accessories including high-lumen LED lighting kits and reflective riding apparel.
The Paris 2024 Olympics mobilisation also stimulated urban delivery two-wheeler fleet expansions, a commercial use case that sustains demand for durable cargo and protection accessories beyond the event period.
Asia Pacific Two Wheeler Accessories Market Trends and Insights
Asia Pacific accounts for 46.8% of the global two wheeler accessories market in 2026, representing US$ 7.58 billion, a leadership position anchored by the world's two largest two-wheeler markets, China and India, and reinforced by Southeast Asia's rapidly motorising economies.
Vietnam's Ministry of Transport reported over 72 million registered motorcycles and motorbikes in 2023, illustrating the depth of the installed base across even mid-sized ASEAN economies. China's accelerating transition to electric two-wheelers and India's manufacturing scale, underpinned by the Production Linked Incentive (PLI) scheme for auto components under the Ministry of Heavy Industries, will sustain the Asia Pacific's dominant regional share through 2033.
China Two Wheeler Accessories Market Size
The China two wheeler accessories market represents 41.2% of the Asia Pacific regional market in 2026, equivalent to US$ 3.12 billion, driven by an electric two-wheeler installed base that CAAM estimates at over 350 million units, requiring a continuous stream of replacement batteries, lighting components, smart locks, and ergonomic accessories. Aima Technology, China's second-largest electric two-wheeler brand by sales volume, launched a co-branded accessories programme in 2024, offering smart helmet-intercom bundles at the point of EV purchase, a model that compresses the aftermarket window and shifts accessory revenue toward OES channels.
China's fragmented domestic accessories market, with over 3,000 registered component manufacturers per the China Bicycle Association estimates, presents both a consolidation opportunity for branded players and a persistent pricing pressure risk.
India Two Wheeler Accessories Market Size
India two wheeler accessories market represents 27.9% of the Asia Pacific regional market in 2026, with growth catalysed by a youthful demographic. The United Nations Population Division estimates India's median age at approximately 28 years in 2024, which treats two-wheeler personalisation as an expression of identity.
Hero MotoCorp, with annual domestic sales exceeding five million units in FY2024, operates an extensive accessories retail programme across its 6,000+ dealership network, making it the single largest captive accessories distribution infrastructure in the country. The formalisation of India's aftermarket through GST compliance enforcement since 2022 is gradually shifting consumer spend from grey-market toward organised, branded accessory channels a tailwind for margin-accretive players.
Japan Two Wheeler Accessories Market Size
Japan two wheeler accessories market represents 13.9% of the Asia Pacific regional market in 2026, equivalent to US$ 1.5 billion, underpinned by an exceptionally mature market where a high proportion of riders own multiple motorcycles and invest heavily in precision-engineered accessories from domestic specialists.
Daytona Corp. and Kitaco, two of Japan's most respected OEM-compatible accessory specialists supply handlebar components, exhaust systems, and suspension upgrades widely adopted by both domestic riders and exported to Southeast Asian markets. Japan's Ministry of Land, Infrastructure, Transport and Tourism (MLIT) road safety guidelines continue to reinforce consumer preference for JIS-certified helmets and domestically tested protective gear, sustaining a quality premium that insulates Japanese accessory brands from low-cost import competition.
South Korea Two Wheeler Accessories Market Size
South Korea two wheeler accessories market represents 8.7% of the Asia Pacific regional market in 2026, equivalent to US$ 660 million, with the market's composition shifting toward electronics-integrated accessories as South Korean riders, among the region's most technology-adaptive demographics adopt connected helmet systems, smartphone HUD mounts, and IoT-enabled tyre monitors at above-average rates.
Kakao Mobility's electric scooter-sharing service, which expanded to 15 cities across South Korea by end-2023, is generating structured demand for fleet-grade accessories, including anti-theft GPS units, branded safety helmets, and standardised cargo fixtures. Domestic brands such as LS2 Helmets Korea are investing in ECE 22.06-certified production to capture export premiums, positioning the market as a niche manufacturing hub alongside its consumer demand base.
Competitive Landscape
The global two wheeler accessories market operates as a fragmented-to-moderately concentrated landscape, with Alpinestars and Dainese S.p.A. leading on premium protective apparel through motorsport heritage and technical certification depth, while GIVI dominates the luggage and touring accessories category via a network of over 5,000 branded retail points across 100+ countries.
Competition intensifies on the basis of ECE and DOT certification breadth, distribution footprint density, and co-branded OEM supply agreements, with OEM-aligned suppliers increasingly displacing pure aftermarket players in higher-value segments. The most disruptive entrant profile is the vertically integrated EV OEM exemplified by Ola Electric that embeds accessory cross-sell into the vehicle purchase and ownership app, bypassing traditional aftermarket intermediaries entirely.
Key Developments:
- January 2026: Sena Technologies launched its 2026 smart helmet lineup, including Specter, Phantom ANC, and Outlander models featuring Harman Kardon audio integration, Mesh 3.0 intercom technology, and Active Noise Control for enhanced rider connectivity and safety.
- January 2026: Rynox Gears introduced its 2026 riding gear collection featuring the Outlander Pro Suit, Helium GT 3 Jacket, Apex Evo Jacket, and upgraded Helium GT 2 Gloves, targeting touring and performance motorcycle riders.
- January 2026: Puig expanded its aerodynamic motorcycle accessory portfolio with newly developed belly pans, spoilers, and aerodynamic winglets designed to improve high-speed stability and sporty aesthetics.
- December 2025: Viking Bags launched upgraded Quick-Mount luggage systems, enabling rapid installation and removal of hard saddlebags for touring and adventure motorcycles.
- November 2025: Rynox Gears unveiled the Navigator Frame Bags and Reload Hydration Bladder system designed for adventure motorcycles, including the Royal Enfield Himalayan 450.
- January 2025: Alpinestars launched its Tech-Air 7X autonomous airbag system for off-road and adventure motorcycle riders, integrating crash-detection algorithms capable of deploying in under 25 milliseconds, expanding wearable safety technology beyond track and road applications into the adventure touring mainstream.
- March 2024: Sena Technologies Inc. released the 50R Mesh Intercom, incorporating a dedicated Harman Audio tuned speaker system and over-the-air firmware updates via the Sena app, establishing a new benchmark for audiophile-grade communication in the motorcycle helmet segment and targeting the premium touring community.
- October 2024: GIVI announced a strategic partnership with Royal Enfield to co-develop a dedicated adventure accessory catalogue for the Himalayan 450, covering pannier systems, crash bars, and navigation mounts, a landmark OEM co-development deal signalling the maturation of OEM-aftermarket accessory collaboration in the mid-premium motorcycle segment.
Global Two Wheeler Accessories Market – Key Insights & Details
| Key Insights | Details |
|---|---|
|
Historical Market Value (2020) |
US$ 10.92 Billion |
|
Current Market Value (2026) |
US$ 16.20 Billion |
|
Projected Market Value (2033) |
US$ 27.23 Billion |
|
CAGR (2026–2033) |
7.7% |
|
Leading Region |
Asia Pacific (46.8%) |
|
Dominant Product Type |
Protective Gears (29.4%) |
|
Top-ranking Vehicle Type |
Standard/Commuter Motorcycles (41.7%) |
|
Top-ranking Distribution Channel |
Offline (68.6%) |
|
Top-ranking Sales Channel |
Aftermarket/IAM (66.2%) |
|
Incremental Opportunity (2026–2033) |
US$ 11.03 Billion |
Companies Covered in Two Wheeler Accessories Market
- TVS Motor Company
- Hero MotoCorp
- Yamaha Motor Company
- Bajaj Auto
- Harley-Davidson
- GIVI
- Alpinestars
- Dainese S.p.A.
- Studds Accessories Ltd.
- Steelbird Hi-Tech India Ltd.
- Cardo Systems
- Sena Technologies Inc.
- Oxford Products Ltd
- Bell Helmets
- Shoei Co., Ltd.
Frequently Asked Questions
The global two wheeler accessories market is valued at US$ 16.20 billion in 2026 and is forecast to reach US$ 27.23 billion by 2033, reflecting a CAGR of 7.7%, propelled primarily by tightening mandatory helmet and protective gear legislation across Asia, Europe, and Latin America, alongside the rapidly expanding electric two-wheeler installed base demanding new accessories layer.
The Bureau of Indian Standards (BIS) enforcement of AIS-156 helmet certification from 2023 onward is eliminating non-compliant products and lifting average selling prices across South Asia's largest two-wheeler market; second, the mainstreaming of adventure and touring motorcycle culture, evidenced by Triumph Motorcycles' 80-SKU accessory catalogue for the Tiger Sport 660 in 2023, is expanding per-vehicle accessory spend well beyond commuter-segment baselines.
Protective gears are likely to account for the largest share at 29.4% of the two wheeler accessories market in 2026.
Asia Pacific dominates the two wheeler accessories market with 46.8% share in 2026, representing US$ 7.58 Billion, driven by China's 350+ million electric two-wheeler installed base and India's commuter motorcycle volume where SIAM data confirms the 100–125cc segment alone accounts for over 60% of domestic two-wheeler sales in FY2024.
Building EV-native accessory platforms, smart locks, battery-carry systems, and app-integrated GPS units compatible across multiple OEM brands, as Yadea Group's 2024 branded accessories launch and Gogoro's battery-swapping ecosystem in Taiwan signal that EV OEMs are actively defining new accessory categories before the independent aftermarket organises.
Alpinestars, Dainese S.p.A., and GIVI lead the global two wheeler accessories market across protective apparel and touring luggage, respectively, while Shoei Co., Ltd. and Bell Helmets anchor the premium helmet segment; competitive intensity is moderate-to-high, with differentiation centred on ECE/DOT dual certification breadth, OEM co-development partnerships, and expanding digital direct-to-consumer channels.


