


- Specialty & Fine Chemicals
- Titanium Dioxide Market
Titanium Dioxide Market Size, Share, and Growth Forecast 2026 - 2033
Titanium Dioxide Market by Grade (Anatase, Rutile), Production Process (Sulfate, Chloride), Application (Paints & Coatings, Plastics, Inks, Cosmetics, Paper, Pharmaceuticals, Others), by Regional Analysis, 2026 - 2033
Titanium Dioxide Market Size and Trend Analysis
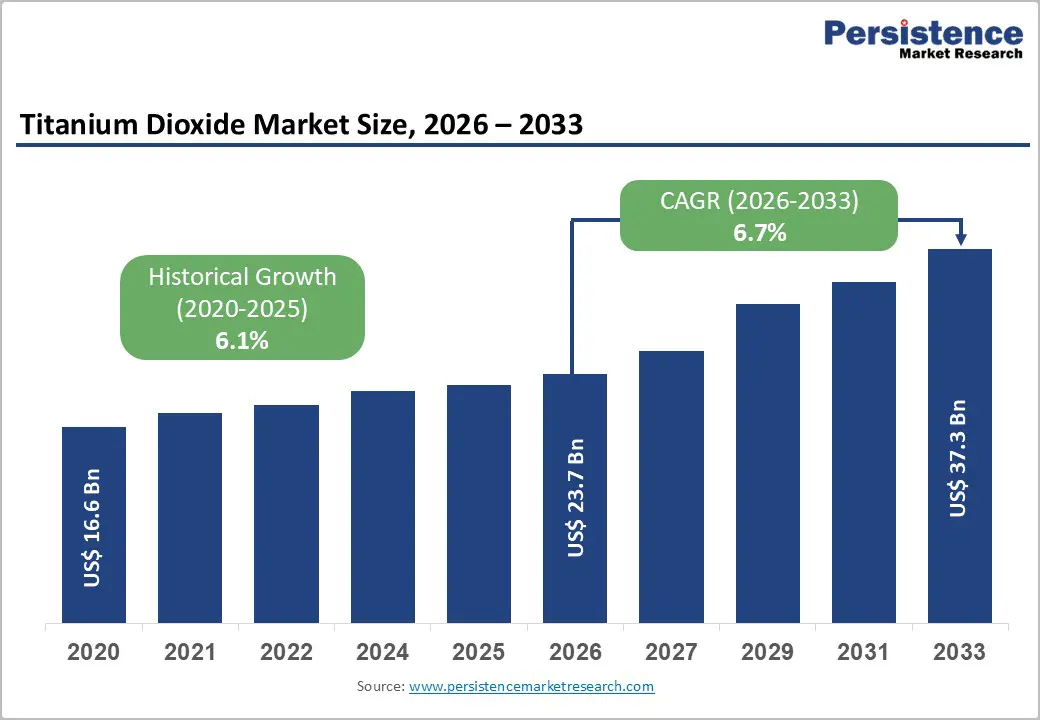
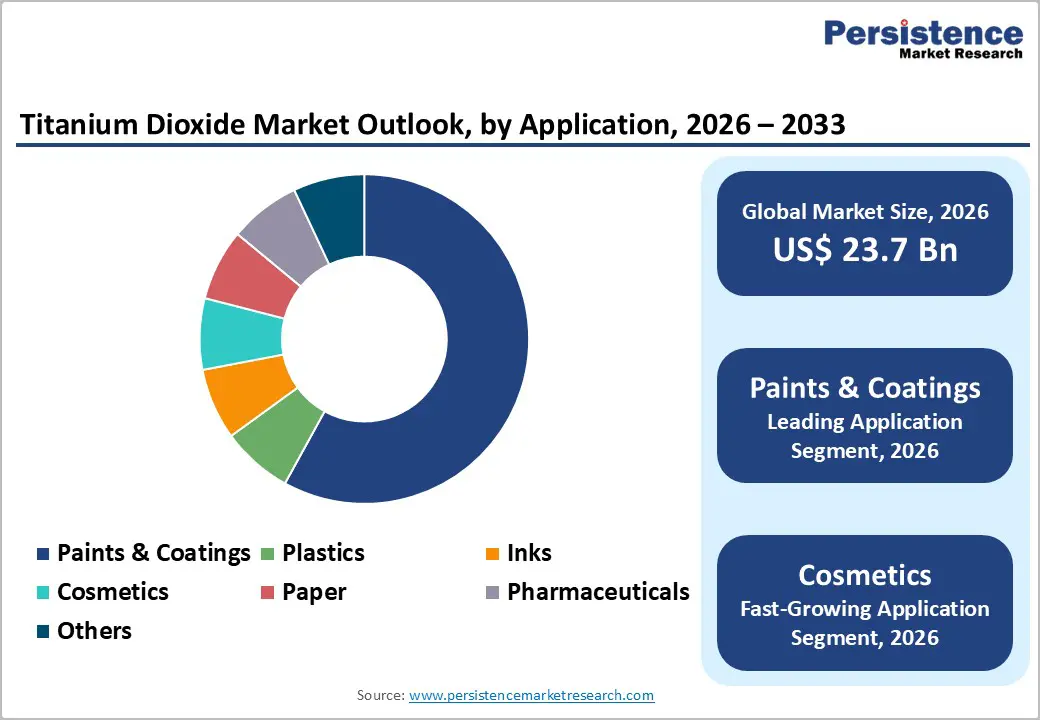
The global titanium dioxide market size is expected to be valued at US$ 23.7 billion in 2026 and projected to reach US$ 37.3 billion by 2033, growing at a CAGR of 6.7% between 2026 and 2033.
This robust growth trajectory is primarily anchored by surging demand from the global paints and coatings industry, itself propelled by accelerating construction output and infrastructure investment worldwide, alongside expanding applications in plastics, cosmetics, and specialty pharmaceuticals. The U.S. Geological Survey (USGS) identifies titanium dioxide as one of the most widely consumed white pigments globally, with annual production volumes exceeding 8 million metric tonnes, underscoring its indispensable role across manufacturing value chains. Tightening environmental regulations driving the transition from solvent-borne to waterborne coating systems, which require higher TiO2 loadings for opacity performance, further reinforce structural demand growth over the forecast period.
Key Industry Highlights
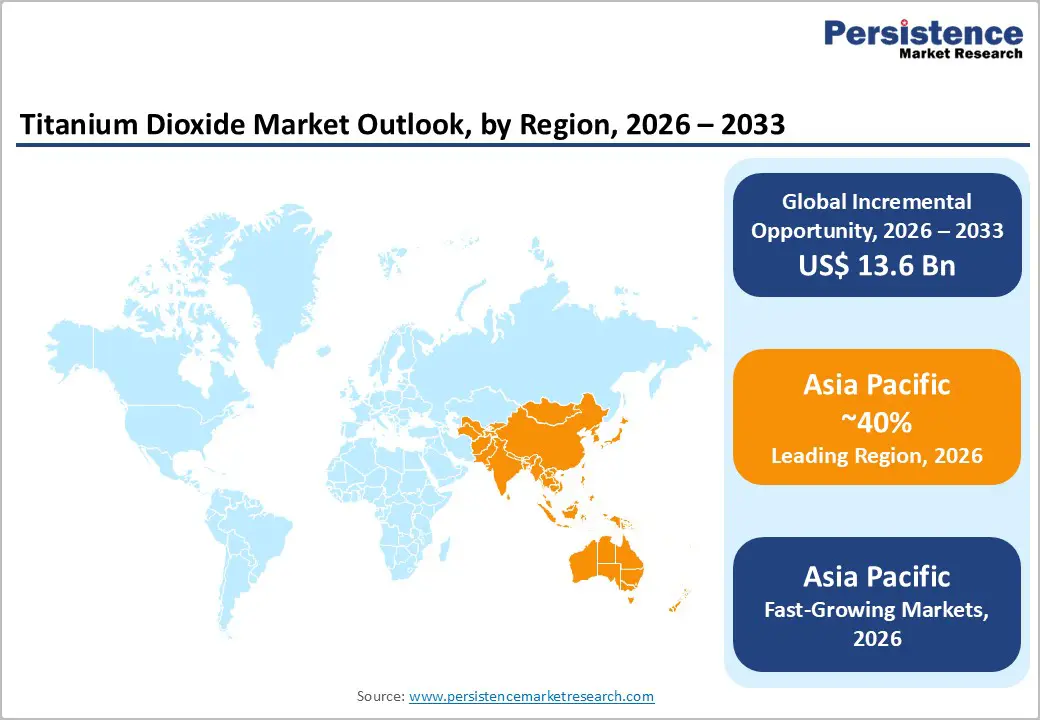
- Leading Region: Asia Pacific leads the global titanium dioxide market, with China alone representing approximately 40% of global TiO2 consumption, underpinned by massive construction, automotive coatings, and plastics manufacturing activity across the region’s rapidly urbanizing economies.
- Fastest Growing Region: Asia Pacific is simultaneously the fastest-growing region, driven by India’s paint consumption growth of 8-10% annually per the Indian Paint Association, China’s ongoing infrastructure investment, and ASEAN’s expanding manufacturing and construction sectors through 2033.
- Dominant Segment: Rutile grade dominates with approximately 85% market share in 2025, owing to its superior refractive index of 2.71, unmatched opacity, UV resistance, and weathering durability that make it the specification standard for premium paints, coatings, and automotive applications globally.
- Fastest Growing Segment: Cosmetics and pharmaceuticals is the fastest-growing application segment, propelled by the global mineral sunscreen boom, regulatory bans on chemical UV filters in multiple jurisdictions, and the FDA’s Category I safe and effective classification of TiO2 as a sunscreen active ingredient.
- Key Opportunity: Key market opportunity lies in photocatalytic and nano-TiO2 for self-cleaning surfaces, air purification, and antimicrobial coatings, premium-priced functional applications supported by EU Horizon Europe funding and Japan’s NEDO commercialization programmes offering substantially superior margins versus commodity pigment grades.
| Key Insights | Details |
|---|---|
| Titanium Dioxide Market Size (2026E) | US$ 23.7 Billion |
| Market Value Forecast (2033F) | US$ 37.3 Billion |
| Projected Growth CAGR (2026 - 2033) | 6.7% |
| Historical Market Growth (2020 - 2025) | 6.1% |
Market Dynamics
Market Growth Drivers
Robust Demand from the Global Paints and Coatings Industry
The paints and coatings sector remains the single largest and most consequential demand driver for titanium dioxide, consuming approximately 57-60% of total global TiO2 production annually, according to the American Coatings Association (ACA). TiO2 is unrivalled as a white pigment for its superior opacity, brightness, and ultraviolet light scattering properties, functional characteristics that no commercially available substitute can replicate at comparable cost and scale. Global infrastructure investment is providing a substantial structural tailwind: the G20 Infrastructure Outlook estimates global infrastructure spending requirements of USD 94 trillion through 2040, with construction and maintenance activity across housing, transportation, and public utilities generating sustained demand for architectural and industrial coatings. In the United States alone, the ACA reported that total industry shipments of paints and coatings exceeded USD 31 billion in 2022, with architectural applications, the most TiO2-intensive segment, accounting for over 50% of total volume. This foundational demand position makes TiO2 consumption intrinsically linked to broader macroeconomic and construction cycles.
Accelerating Urbanization and Infrastructure Development in Emerging Markets
Rapid urbanization across Asia Pacific, the Middle East, and Latin America is generating structurally elevated demand for titanium dioxide through its downstream applications in construction materials, automotive coatings, and consumer goods. The United Nations Department of Economic and Social Affairs (UN DESA) projects that the global urban population will reach 6.7 billion by 2050, with approximately 90% of this urbanization growth concentrated in Asia and Africa, regions with intensifying construction and manufacturing activity requiring TiO2-intensive products. China’s ongoing urban development programmes, including its 14th Five-Year Plan targets for new housing construction and transportation infrastructure, continue to generate massive TiO2 demand, as the country accounts for approximately 40% of global TiO2 consumption according to industry data compiled by the International Titanium Association (ITA). India’s Smart Cities Mission and Pradhan Mantri Awas Yojana (PMAY) housing programmes similarly create multi-year pipeline demand for coatings and plastics, reinforcing the long-run growth outlook for TiO2 producers with Asian market exposure.
Market Restraints
Stringent Environmental Regulations Targeting TiO2 Production and Classification
The titanium dioxide industry faces mounting regulatory headwinds, particularly in Europe, where the European Chemicals Agency (ECHA) classified TiO2 as a Category 2 suspected carcinogen (by inhalation) under CLP Regulation (EC) No 1272/2008 in 2020. While this classification applies specifically to TiO2 in powder form under inhalation exposure conditions, and does not restrict end-product use, it has imposed significant labelling, handling, and occupational safety compliance costs on manufacturers and downstream formulators operating within the European Union. The reclassification triggered substantial legal challenges from industry bodies including TDMA (TiO2 Manufacturers Association) and individual producers, adding regulatory uncertainty that has complicated long-term capital investment planning across the European production base and deterred some customers from TiO2-intensive formulations.
High Energy Intensity and Raw Material Supply Concentration
TiO2 production, particularly via the chloride process, is highly energy intensive, with electricity and fuel costs constituting a significant proportion of total manufacturing cost. The International Energy Agency (IEA) classifies titanium sponge and TiO2 production among energy-intensive industrial processes, making producers acutely vulnerable to energy price volatility as experienced during the 2021-2022 European energy crisis. Compounding this, titanium feedstock supply, primarily ilmenite and rutile, is geographically concentrated, with Australia, South Africa, and Mozambique collectively accounting for over 70% of global rutile and ilmenite reserves according to the USGS Mineral Commodity Summaries. This supply concentration creates geopolitical and logistical risk that can disrupt feedstock availability and inflate input costs, particularly for TiO2 producers without vertically integrated mining operations.
Market Opportunities
Growing Adoption of TiO2 in Photocatalytic and Self-Cleaning Applications
Beyond its traditional pigment role, titanium dioxide is experiencing rapidly growing demand in advanced functional applications, most notably photocatalytic coatings, self-cleaning surfaces, and air purification systems, that represent a significant new revenue frontier for TiO2 producers. Nano-TiO2 exhibits powerful photocatalytic activity under UV irradiation, enabling surfaces coated with it to decompose organic pollutants, inhibit bacterial growth, and maintain self-cleaning properties. The European Commission’s Horizon Europe programme has funded multiple research initiatives exploring TiO2 photocatalysis for urban air pollution abatement, including incorporation into road surfaces and building facades. The global air purification market, where TiO2-based photocatalytic filters are gaining traction, is growing robustly, driven by post-pandemic heightened awareness of indoor and outdoor air quality. Japan’s New Energy and Industrial Technology Development Organization (NEDO) has actively supported nano-TiO2 commercialization in construction materials. Producers that invest in surface-treated and nano-grade TiO2 product development are positioned to access this premium-priced, high-growth market adjacency with substantially superior margin profiles versus commodity pigment grades.
Expansion into High-Growth Cosmetics and Sunscreen Formulation Markets
Titanium dioxide’s exceptional UV-blocking properties, recognized as a Category I (safe and effective) sunscreen active ingredient by the U.S. Food and Drug Administration (FDA), position it as a critical ingredient in the rapidly growing mineral sunscreen and cosmetics sectors. The global shift away from chemical UV filters toward mineral alternatives, driven by both consumer safety preferences and regulatory action, including Hawaii’s ban on oxybenzone and octinoxate under Act 104 (2018) and similar legislation in other jurisdictions, is materially expanding TiO2 demand in personal care formulations. The Personal Care Products Council (PCPC) notes that mineral sunscreen product launches featuring TiO2 as the active UV filter have grown at double-digit rates in recent years across major markets. Cosmetic-grade TiO2 commands a significant price premium over standard pigment grade, with nano-TiO2 for transparent sunscreen formulations attracting even higher pricing. Producers capable of supplying pharmaceutical and cosmetic GMP-compliant TiO2 grades, including surface-coated variants for skin-feel optimization, can meaningfully diversify revenue streams and margin profiles beyond the competitive commodity pigment market.
Category-wise Insights
Grade Analysis
Rutile-grade titanium dioxide is the dominant segment in the global TiO2 market, commanding an estimated market share of approximately 85% in 2025. This overwhelming market position reflects rutile’s superior technical performance characteristics relative to anatase, including significantly higher refractive index (2.71 vs. 2.55 for anatase), superior UV absorption, greater opacity per unit weight, and better weathering resistance, properties that make it the pigment grade of choice for demanding applications including exterior architectural coatings, automotive topcoats, and high-performance industrial paints. The International Titanium Association (ITA) confirms that the vast majority of commercial TiO2 production capacity, particularly chloride-process plants, is oriented toward rutile production. Global manufacturers including The Chemours Company, Tronox Holdings plc, and KRONOS Worldwide Inc. have oriented their product portfolios predominantly around premium rutile grades. Anatase, while the fastest-growing grade, serves more niche applications in paper delustrant and certain fiber applications where its lower abrasiveness is advantageous.
Production Process Analysis
The chloride production process is the leading manufacturing pathway for titanium dioxide, accounting for an estimated market share of approximately 57% in 2025, reflecting its technical and environmental advantages over the older sulfate process. The chloride process, pioneered commercially by DuPont (now The Chemours Company), produces rutile-grade TiO2 of consistently superior brightness and dispersion characteristics, generates significantly lower volumes of acidic waste streams per tonne of product, and is amenable to greater process efficiency optimization. The European Environment Agency (EEA) has documented the comparative environmental advantages of chloride-process TiO2 in terms of waste acid generation and heavy metal by-product management, reinforcing regulatory preference for chloride-process capacity in new investment decisions. Leading Western producers including Chemours, Tronox, and KRONOS Worldwide operate predominantly chloride-process facilities. The sulfate process remains the fastest-growing in absolute volume terms, driven by extensive capacity additions in China, where lower capital costs and ilmenite feedstock availability make sulfate-process plants more economically accessible for domestic producers.
Application Analysis
Paints and coatings is the dominant application segment in the global titanium dioxide market, accounting for an estimated 58% share of total TiO2 consumption in 2025, a position it has maintained for decades owing to TiO2’s irreplaceable function as the primary white and opacity-providing pigment in virtually all coating formulations. The American Coatings Association (ACA) and European Coatings Association (VdL) both confirm that TiO2 remains the single highest-cost raw material input for most paint manufacturers, with pigment optimization strategies, including the use of TiO2 extenders and space-out agents, aimed at reducing loading without compromising hiding power. Regulatory shifts toward waterborne and high-solids coating systems, mandated by EPA and EU VOC Directive 2004/42/EC limits on solvent emissions, typically require higher TiO2 pigment loadings to maintain opacity, creating an embedded volume growth driver independent of overall coatings market expansion. The cosmetics and pharmaceuticals application is the fastest-growing segment, propelled by the global mineral sunscreen boom and expanding pharmaceutical tablet coating requirements.
Regional Insights
North America Titanium Dioxide Market Trends and Insights
North America holds a leading position in the global titanium dioxide market, with the United States serving as both a major production hub and a substantial consumption centre. The Chemours Company, headquartered in Wilmington, Delaware, operates one of the world’s largest and most technologically advanced chloride-process TiO2 manufacturing networks, including flagship facilities in DeLisle, Mississippi and Edge Moor, Delaware. The U.S. Environmental Protection Agency (EPA) administers stringent National Emission Standards for Hazardous Air Pollutants (NESHAP) for TiO2 manufacturing facilities, driving continuous investment in emissions control technology and process efficiency at domestic production sites. The ACA forecasts continued growth in U.S. architectural coatings demand, supported by sustained housing starts above 1.3-1.5 million units annually as reported by the U.S. Census Bureau, which underpins structural TiO2 consumption.
Innovation in photocatalytic and specialty TiO2 grades is a growing focus for North American producers, with Huntsman Corporation and Tronox Holdings plc actively developing value-added surface treatment technologies to differentiate from commoditized Asian imports. The U.S. International Trade Commission (ITC) has administered anti-dumping and countervailing duty investigations on TiO2 imports from China, providing a degree of domestic market protection that supports investment confidence for U.S.-based manufacturers.
Europe Titanium Dioxide Market Trends and Insights
Europe represents a critically important market and production region for titanium dioxide, with Germany, the United Kingdom, Finland, and Spain hosting significant TiO2 manufacturing capacity from producers including Venator Materials PLC, KRONOS Worldwide Inc., Cinkarna Celje, and INEOS. The EU REACH Regulation and the CLP carcinogen reclassification of TiO2 powder have imposed the most significant regulatory burden on European producers and downstream formulators globally, requiring comprehensive labelling updates, exposure risk assessments, and supply chain communication cascades across the coatings and plastics sectors. The TiO2 Manufacturers Association (TDMA) has been active in advocacy and technical communication to clarify the scope and practical implications of the classification for downstream industries.
Despite regulatory complexity, Europe’s construction sector, supported by the EU Renovation Wave initiative targeting the energy-efficient retrofit of 35 million buildings by 2030, provides robust structural demand for high-quality TiO2-pigmented architectural coatings. Germany’s KfW Bank Group subsidies for energy renovation and France’s MaPrimeRénov’ scheme are accelerating residential and commercial refurbishment activity, directly translating to increased coatings consumption. KRONOS Worldwide’s European network, operating plants in Germany, Belgium, and Norway, is strategically positioned to capitalize on this policy-driven demand acceleration.
Asia Pacific Titanium Dioxide Market Trends and Insights
Asia Pacific is both the largest consuming region and the fastest-growing market for titanium dioxide globally, with China alone accounting for approximately 40% of global TiO2 demand and hosting the world’s most extensive production capacity base. Lomon Billions Group and Nanjing Titanium Company are among China’s largest domestic producers, having scaled sulfate-process capacity substantially over the past decade to serve rapidly growing domestic paints, plastics, and paper industries. China’s Ministry of Industry and Information Technology (MIIT) has encouraged domestic TiO2 capacity consolidation to reduce fragmentation and environmental non-compliance among smaller producers, creating competitive pressure that is progressively improving average industry environmental standards.
India represents one of the most attractive emerging TiO2 growth markets, with the Indian Paint Association (IPA) reporting industry growth rates of 8-10% annually in recent years, driven by rising per-capita paint consumption, still significantly below the global average at approximately 4 kg per capita versus 15 kg in developed markets. Japan’s Ishihara Sangyo Kaisha Ltd. (ISK) and Tayca Corporation maintain strong positions in premium-grade TiO2 for automotive, cosmetic, and specialty electronic applications. Southeast Asian nations, particularly Vietnam, Indonesia, and Thailand, are experiencing rapid growth in domestic construction and manufacturing sectors, positioning ASEAN as an increasingly important incremental TiO2 demand centre over the 2026 - 2033 forecast horizon.
Competitive Landscape
The global titanium dioxide market reflects a moderately consolidated structure at the international level, where a limited number of large producers control significant chloride-process capacity across North America and Europe. At the same time, competitive intensity has increased due to rapid capacity expansion by major Chinese manufacturers, resulting in heightened price competition in commodity-grade segments and stronger export penetration into developing markets.
Strategic differentiation is increasingly centered on proprietary surface treatment technologies, high-performance rutile grades, and application-specific customization for coatings, plastics, and specialty uses. Sustainability positioning, through low-carbon production pathways, recycled feedstock initiatives, and improved waste management practices, is becoming a key competitive lever, particularly in Europe. Producers are also pursuing long-term supply agreements with multinational coatings and polymer manufacturers to stabilize volumes and protect margins. Vertical integration into titanium-bearing feedstock mining and beneficiation is emerging as a critical strategy to mitigate raw material price volatility and secure long-term cost competitiveness.
Key Developments
- February, 2025: The Chemours Company launched Ti-Pure™ TS-6706, a TMP- and TME-free titanium dioxide pigment designed for high-performance coatings as a more sustainable alternative to its benchmark Ti-Pure grades.
- January, 2026, The Chemours Company signed agreements to sell its former titanium dioxide manufacturing site land in Taiwan to Century group companies for $360 million, aiming to reduce debt, with closure anticipated by mid-2026 subject to approvals.
Companies Covered in Titanium Dioxide Market
- Tronox Holdings plc
- The Chemours Company
- Argex Titanium Inc.
- Rio Tinto
- Ishihara Sangyo Kaisha Ltd. (ISK)
- Venator Materials PLC
- Tayca Corporation
- Huntsman Corporation
- KRONOS Worldwide Inc.
- Nanjing Titanium Company
- Lomon Billions Group
- Cinkarna Celje
- INEOS
- Sakai Chemical Industry Co., Ltd.
- Gujarat Mineral Development Corporation (GMDC)
- National Titanium Dioxide Company Ltd. (Cristal)
- Grupa Azoty
Frequently Asked Questions
The global Titanium Dioxide market is estimated at US$ 23.7 billion in 2026, driven primarily by strong demand from paints and coatings, plastics, cosmetics, and pharmaceutical applications.
Growth is driven by rising global construction activity, accelerating urbanization in emerging markets, and regulatory shifts toward waterborne coatings requiring higher TiO2 pigment loadings.
Asia Pacific leads the market, with China accounting for roughly 40% of global consumption supported by its large coatings, plastics, and manufacturing base.
Major opportunities lie in nano and photocatalytic TiO2 for self-cleaning and antimicrobial surfaces, along with expanding demand for cosmetic and pharmaceutical-grade pigments.
Leading companies include Chemours, Tronox, KRONOS Worldwide, Venator Materials, Lomon Billions Group, and other major chloride and sulfate process producers.


