


- Executive Summary
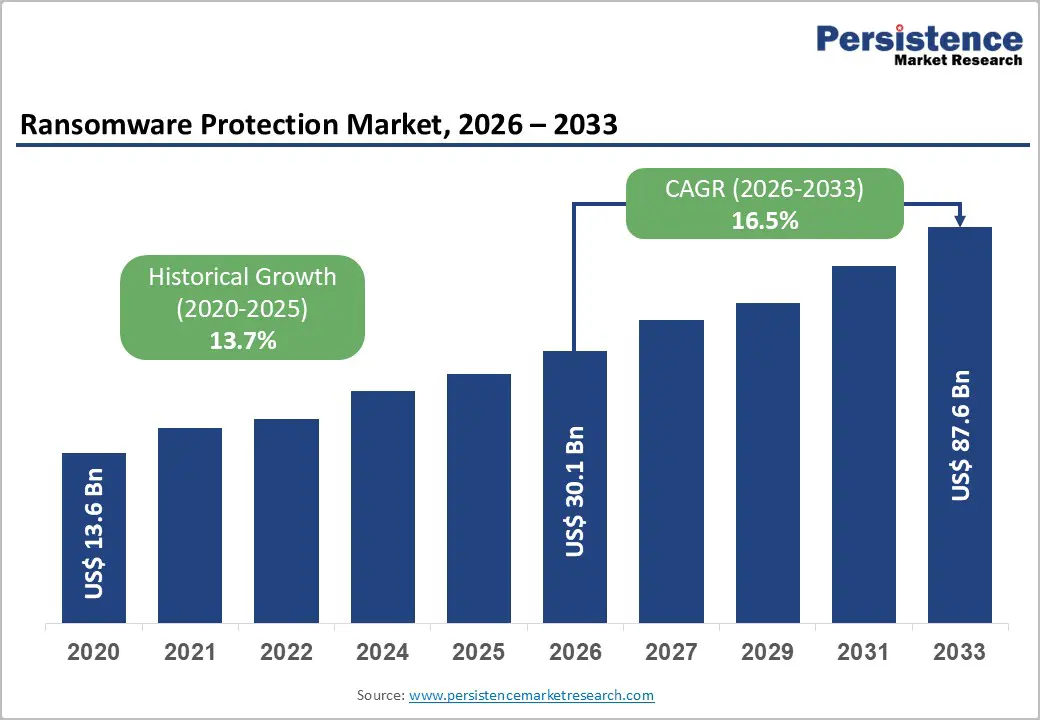
- Global Ransomware Protection Market Snapshot 2026 and 2033
- Market Opportunity Assessment, 2026-2033, US$ Bn
- Key Market Trends
- Industry Developments and Key Market Events
- Demand Side and Supply Side Analysis
- PMR Analysis and Recommendations
- Market Overview
- Market Scope and Definitions
- Value Chain Analysis
- Macro-Economic Factors
- Global GDP Outlook
- IT Spending Trends
- Government Cybersecurity Budgets & Incentives
- Cloud Adoption Trends
- Internet & Smartphone Penetration
- Forecast Factors – Relevance and Impact
- COVID-19 Impact Assessment
- PESTLE Analysis
- Porter's Five Forces Analysis
- Geopolitical Tensions: Market Impact
- Regulatory and Technology Landscape
- Market Dynamics
- Drivers
- Restraints
- Opportunities
- Trends
- Price Trend Analysis
- Price by Component
- Price Impact Factors
- Global Ransomware Protection Market Outlook: Historical (2020 – 2025) and Forecast (2026 – 2033)
- Key Highlights
- Global Ransomware Protection Market Outlook: Component
- Introduction/Key Findings
- Historical Market Size (US$ Bn) Analysis by Component, 2020-2025
- Current Market Size (US$ Bn) Forecast, by Component, 2026-2033
- Solution
- Endpoint Protection
- Network & Email Protection
- Backup & Recovery
- Identity & Access Protection
- Security Analytics & Threat Intelligence
- Others
- Services
- Professional Services
- Managed Services
- Solution
- Market Attractiveness Analysis: Component
- Global Ransomware Protection Market Outlook: Deployment
- Introduction/Key Findings
- Historical Market Size (US$ Bn) Analysis by Deployment, 2020-2025
- Current Market Size (US$ Bn) Forecast, by Deployment, 2026-2033
- On-Premises
- Cloud / SaaS
- Hybrid
- Market Attractiveness Analysis: Deployment
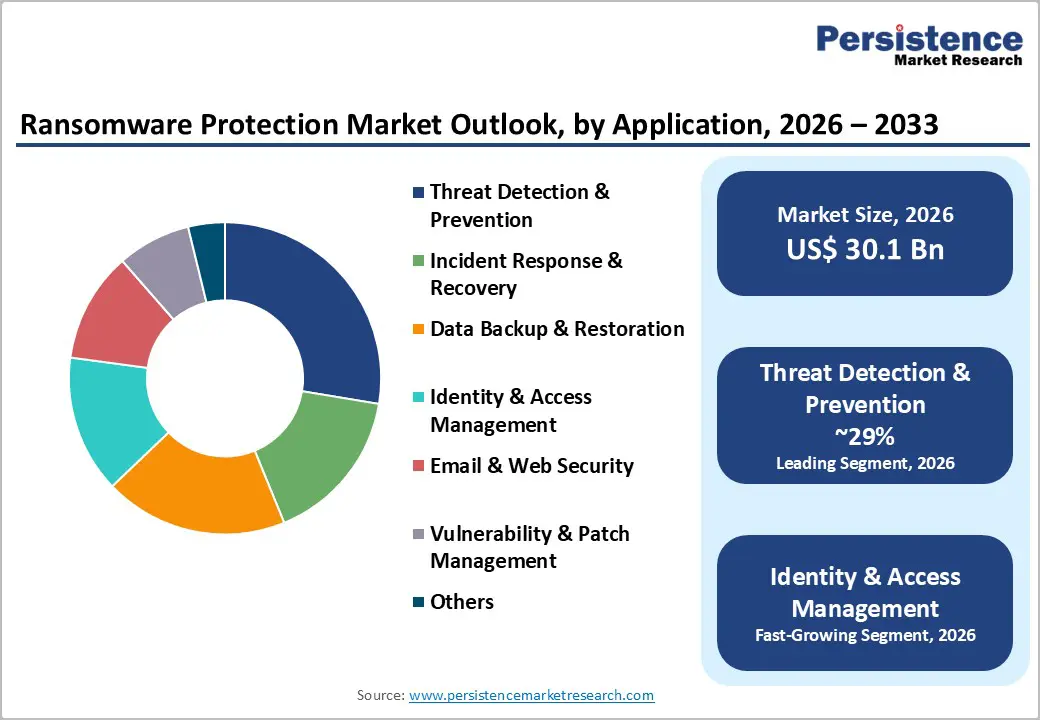
- Global Ransomware Protection Market Outlook: Application
- Introduction/Key Findings
- Historical Market Size (US$ Bn) Analysis by Application, 2020-2025
- Current Market Size (US$ Bn) Forecast, by Application, 2026-2033
- Threat Detection & Prevention
- Incident Response & Recovery
- Data Backup & Restoration
- Identity & Access Management
- Email & Web Security
- Vulnerability & Patch Management
- Others
- Market Attractiveness Analysis: Application
- Global Ransomware Protection Market Outlook: Industry
- Introduction/Key Findings
- Historical Market Size (US$ Bn) Analysis by Industry, 2020-2025
- Current Market Size (US$ Bn) Forecast, by Industry, 2026-2033
- BFSI
- IT & Telecom
- Healthcare
- Manufacturing
- Government & Defense
- Energy & Utilities
- Transportation & Logistics
- Retail & E-commerce
- Others
- Market Attractiveness Analysis: Industry
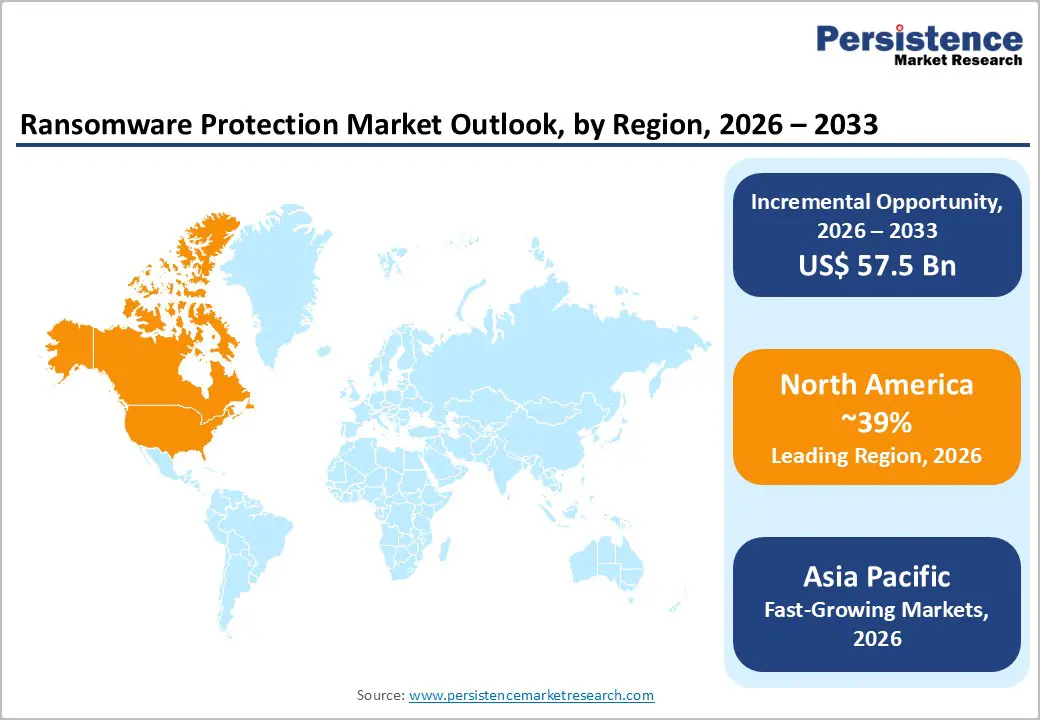
- Global Ransomware Protection Market Outlook: Region
- Key Highlights
- Historical Market Size (US$ Bn) Analysis by Region, 2020-2025
- Current Market Size (US$ Bn) Forecast, by Region, 2026-2033
- North America
- Europe
- East Asia
- South Asia & Oceania
- Latin America
- Middle East & Africa
- Market Attractiveness Analysis: Region
- North America Ransomware Protection Market Outlook: Historical (2020 – 2025) and Forecast (2026 – 2033)
- Key Highlights
- North America Market Size (US$ Bn) Forecast, by Country, 2026-2033
- U.S.
- Canada
- North America Market Size (US$ Bn) Forecast, by Component, 2026-2033
- Solution
- Endpoint Protection
- Network & Email Protection
- Backup & Recovery
- Identity & Access Protection
- Security Analytics & Threat Intelligence
- Others
- Services
- Professional Services
- Managed Services
- Solution
- North America Market Size (US$ Bn) Forecast, by Deployment, 2026-2033
- On-Premises
- Cloud / SaaS
- Hybrid
- North America Market Size (US$ Bn) Forecast, by Application, 2026-2033
- Threat Detection & Prevention
- Incident Response & Recovery
- Data Backup & Restoration
- Identity & Access Management
- Email & Web Security
- Vulnerability & Patch Management
- Others
- North America Market Size (US$ Bn) Forecast, by Industry, 2026-2033
- BFSI
- IT & Telecom
- Healthcare
- Manufacturing
- Government & Defense
- Energy & Utilities
- Transportation & Logistics
- Retail & E-commerce
- Others
- Europe Ransomware Protection Market Outlook: Historical (2020 – 2025) and Forecast (2026 – 2033)
- Key Highlights
- Europe Market Size (US$ Bn) Forecast, by Country, 2026-2033
- Germany
- Italy
- France
- U.K.
- Spain
- Russia
- Rest of Europe
- Europe Market Size (US$ Bn) Forecast, by Component, 2026-2033
- Solution
- Endpoint Protection
- Network & Email Protection
- Backup & Recovery
- Identity & Access Protection
- Security Analytics & Threat Intelligence
- Others
- Services
- Professional Services
- Managed Services
- Solution
- Europe Market Size (US$ Bn) Forecast, by Deployment, 2026-2033
- On-Premises
- Cloud / SaaS
- Hybrid
- Europe Market Size (US$ Bn) Forecast, by Application, 2026-2033
- Threat Detection & Prevention
- Incident Response & Recovery
- Data Backup & Restoration
- Identity & Access Management
- Email & Web Security
- Vulnerability & Patch Management
- Others
- Europe Market Size (US$ Bn) Forecast, by Industry, 2026-2033
- BFSI
- IT & Telecom
- Healthcare
- Manufacturing
- Government & Defense
- Energy & Utilities
- Transportation & Logistics
- Retail & E-commerce
- Others
- East Asia Ransomware Protection Market Outlook: Historical (2020 – 2025) and Forecast (2026 – 2033)
- Key Highlights
- East Asia Market Size (US$ Bn) Forecast, by Country, 2026-2033
- China
- Japan
- South Korea
- East Asia Market Size (US$ Bn) Forecast, by Component, 2026-2033
- Solution
- Endpoint Protection
- Network & Email Protection
- Backup & Recovery
- Identity & Access Protection
- Security Analytics & Threat Intelligence
- Others
- Services
- Professional Services
- Managed Services
- Solution
- East Asia Market Size (US$ Bn) Forecast, by Deployment, 2026-2033
- On-Premises
- Cloud / SaaS
- Hybrid
- East Asia Market Size (US$ Bn) Forecast, by Application, 2026-2033
- Threat Detection & Prevention
- Incident Response & Recovery
- Data Backup & Restoration
- Identity & Access Management
- Email & Web Security
- Vulnerability & Patch Management
- Others
- East Asia Market Size (US$ Bn) Forecast, by Industry, 2026-2033
- BFSI
- IT & Telecom
- Healthcare
- Manufacturing
- Government & Defense
- Energy & Utilities
- Transportation & Logistics
- Retail & E-commerce
- Others
- South Asia & Oceania Ransomware Protection Market Outlook: Historical (2020 – 2025) and Forecast (2026 – 2033)
- Key Highlights
- South Asia & Oceania Market Size (US$ Bn) Forecast, by Country, 2026-2033
- India
- Southeast Asia
- ANZ
- Rest of SAO
- South Asia & Oceania Market Size (US$ Bn) Forecast, by Component, 2026-2033
- Solution
- Endpoint Protection
- Network & Email Protection
- Backup & Recovery
- Identity & Access Protection
- Security Analytics & Threat Intelligence
- Others
- Services
- Professional Services
- Managed Services
- Solution
- South Asia & Oceania Market Size (US$ Bn) Forecast, by Deployment, 2026-2033
- On-Premises
- Cloud / SaaS
- Hybrid
- South Asia & Oceania Market Size (US$ Bn) Forecast, by Application, 2026-2033
- Threat Detection & Prevention
- Incident Response & Recovery
- Data Backup & Restoration
- Identity & Access Management
- Email & Web Security
- Vulnerability & Patch Management
- Others
- South Asia & Oceania Market Size (US$ Bn) Forecast, by Industry, 2026-2033
- BFSI
- IT & Telecom
- Healthcare
- Manufacturing
- Government & Defense
- Energy & Utilities
- Transportation & Logistics
- Retail & E-commerce
- Others
- Latin America Ransomware Protection Market Outlook: Historical (2020 – 2025) and Forecast (2026 – 2033)
- Key Highlights
- Latin America Market Size (US$ Bn) Forecast, by Country, 2026-2033
- Brazil
- Mexico
- Rest of LATAM
- Latin America Market Size (US$ Bn) Forecast, by Component, 2026-2033
- Solution
- Endpoint Protection
- Network & Email Protection
- Backup & Recovery
- Identity & Access Protection
- Security Analytics & Threat Intelligence
- Others
- Services
- Professional Services
- Managed Services
- Solution
- Latin America Market Size (US$ Bn) Forecast, by Deployment, 2026-2033
- On-Premises
- Cloud / SaaS
- Hybrid
- Latin America Market Size (US$ Bn) Forecast, by Application, 2026-2033
- Threat Detection & Prevention
- Incident Response & Recovery
- Data Backup & Restoration
- Identity & Access Management
- Email & Web Security
- Vulnerability & Patch Management
- Others
- Latin America Market Size (US$ Bn) Forecast, by Industry, 2026-2033
- BFSI
- IT & Telecom
- Healthcare
- Manufacturing
- Government & Defense
- Energy & Utilities
- Transportation & Logistics
- Retail & E-commerce
- Others
- Middle East & Africa Ransomware Protection Market Outlook: Historical (2020 – 2025) and Forecast (2026 – 2033)
- Key Highlights
- Middle East & Africa Market Size (US$ Bn) Forecast, by Country, 2026-2033
- GCC Countries
- South Africa
- Northern Africa
- Rest of MEA
- Middle East & Africa Market Size (US$ Bn) Forecast, by Component, 2026-2033
- Solution
- Endpoint Protection
- Network & Email Protection
- Backup & Recovery
- Identity & Access Protection
- Security Analytics & Threat Intelligence
- Others
- Services
- Professional Services
- Managed Services
- Solution
- Middle East & Africa Market Size (US$ Bn) Forecast, by Deployment, 2026-2033
- On-Premises
- Cloud / SaaS
- Hybrid
- Middle East & Africa Market Size (US$ Bn) Forecast, by Application, 2026-2033
- Threat Detection & Prevention
- Incident Response & Recovery
- Data Backup & Restoration
- Identity & Access Management
- Email & Web Security
- Vulnerability & Patch Management
- Others
- Middle East & Africa Market Size (US$ Bn) Forecast, by Industry, 2026-2033
- BFSI
- IT & Telecom
- Healthcare
- Manufacturing
- Government & Defense
- Energy & Utilities
- Transportation & Logistics
- Retail & E-commerce
- Others
- Competition Landscape
- Market Share Analysis, 2025
- Market Structure
- Competition Intensity Mapping
- Competition Dashboard
- Company Profiles
- Broadcom Inc.
- Company Overview
- Product Portfolio/Offerings
- Key Financials
- SWOT Analysis
- Company Strategy and Key Developments
- McAfee, LLC
- Bitdefender SRL
- FireEye, Inc.
- Malwarebytes Inc.
- SentinelOne, Inc.
- Sophos Ltd.
- Trend Micro Incorporated
- Zscaler, Inc.
- Cisco Systems, Inc.
- Palo Alto Networks, Inc.
- Microsoft Corporation
- CrowdStrike Holdings, Inc.
- Others
- Broadcom Inc.
- Appendix
- Research Methodology
- Research Assumptions
- Acronyms and Abbreviations

Loading page data
Please wait a moment


