


- Executive Summary
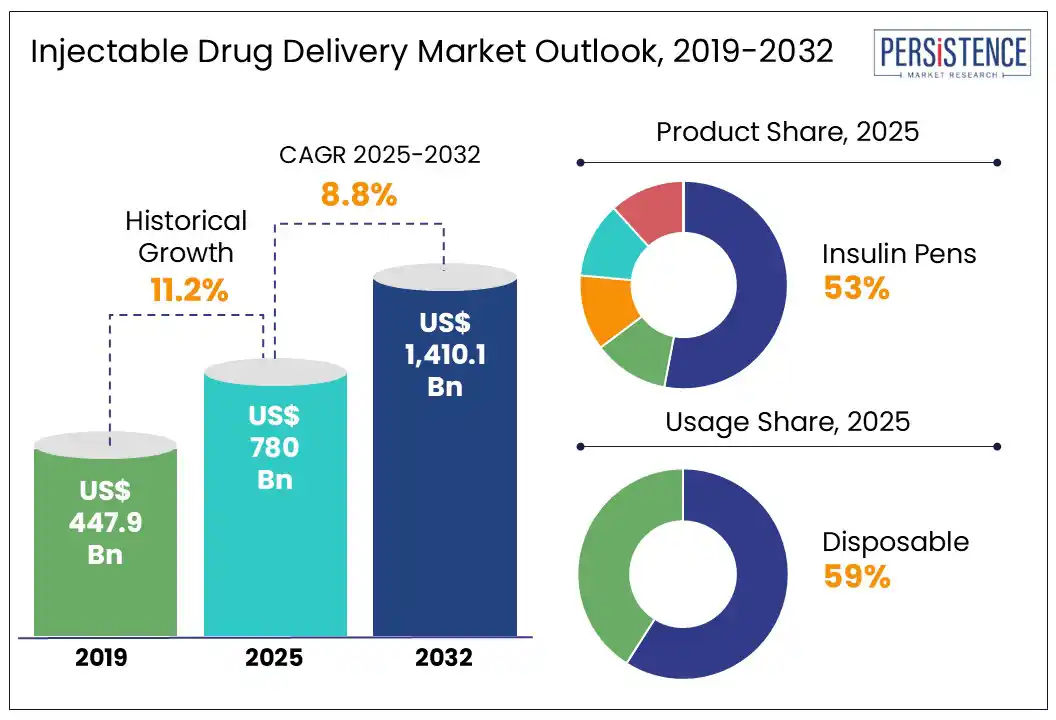
- Global Injectable Drug Delivery Market Snapshot, 2025 and 2032
- Market Opportunity Assessment, 2025 - 2032, US$ Bn
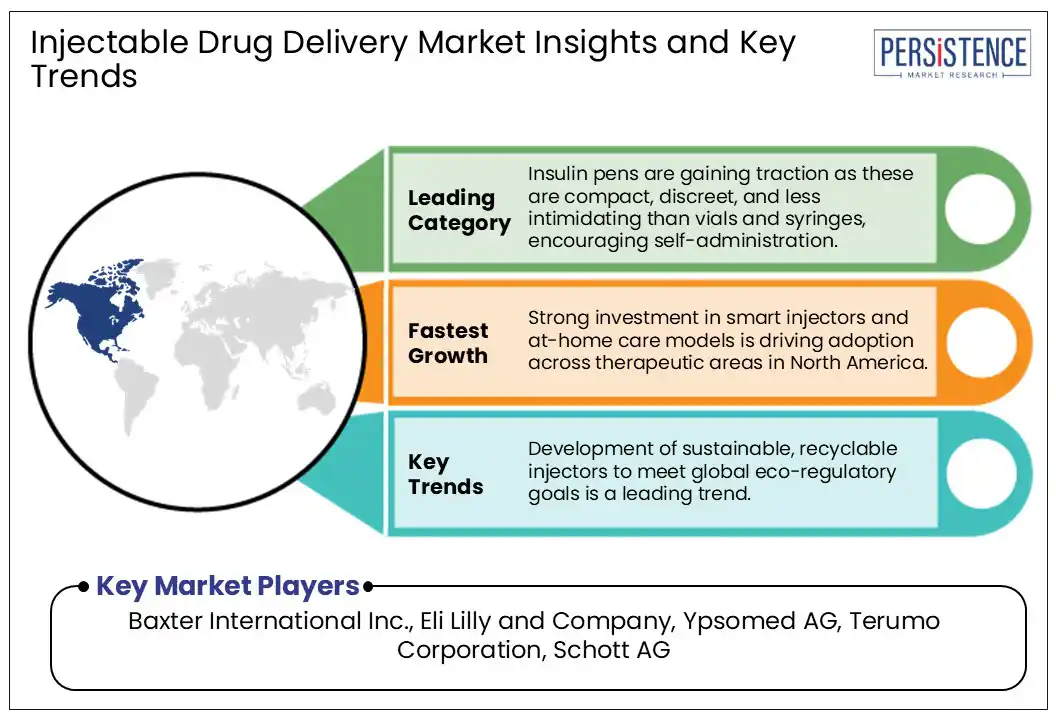
- Key Market Trends
- Future Market Projections
- Premium Market Insights
- Industry Developments and Key Market Events
- PMR Analysis and Recommendations
- Market Overview
- Market Scope and Definition
- Market Dynamics
- Drivers
- Restraints
- Opportunity
- Challenges
- Key Trends
- Macro-Economic Factors
- Global Sectorial Outlook
- Global GDP Growth Outlook
- COVID-19 Impact Analysis
- Forecast Factors - Relevance and Impact
- Value Added Insights
- Regulatory Landscape
- Product Adoption Analysis
- Value Chain Analysis
- Key Deals and Mergers
- PESTLE Analysis
- Porter’s Five Force Analysis
- Global Injectable Drug Delivery Market Outlook
- Key Highlights
- Market Size (US$ Bn) and Y-o-Y Growth
- Absolute $ Opportunity
- Market Size (US$ Bn) Analysis and Forecast
- Historical Market Size (US$ Bn) Analysis, 2019-2024
- Market Size (US$ Bn) Analysis and Forecast, 2025-2032
- Global Injectable Drug Delivery Market Outlook: Product
- Introduction / Key Findings
- Historical Market Size (US$ Bn) Analysis, By Product, 2019 - 2024
- Market Size (US$ Bn) Analysis and Forecast, By Product, 2025 - 2032
- Self-Injectors
- Single Chamber
- Dual Chamber
- Needle Free Injectors
- Prefilled
- Fillable
- Auto Injectors
- Prefilled
- Fillable
- Wearable Injectors
- Wearable Patch Injectors
- Off-body Worn Injectors
- Insulin Pens
- Reusable
- Disposable
- Smart
- Self-Injectors
- Market Attractiveness Analysis: Product
- Global Injectable Drug Delivery Market Outlook: Technology
- Introduction / Key Findings
- Historical Market Size (US$ Bn) Analysis, By Technology, 2019 - 2024
- Market Size (US$ Bn) Analysis and Forecast, By Technology, 2025 - 2032
- Non-Smart Injectors
- Smart Injectors
- Artificial Intelligence (AI) and Machine Learning (ML) Integrated
- Near Filed Communication (NFC)
- Cloud Computing
- Bluetooth
- Market Attractiveness Analysis: Technology
- Global Injectable Drug Delivery Market Outlook: Usage
- Introduction / Key Findings
- Historical Market Size (US$ Bn) Analysis, By Usage, 2019 - 2024
- Market Size (US$ Bn) Analysis and Forecast, By Usage, 2025 - 2032
- Disposable
- Reusable
- Market Attractiveness Analysis: Usage
- Global Injectable Drug Delivery Market Outlook: Indication
- Introduction / Key Findings
- Historical Market Size (US$ Bn) Analysis, By Indication, 2019 - 2024
- Market Size (US$ Bn) Analysis and Forecast, By Indication, 2025 - 2032
- Anaphylaxis
- Diabetes
- Cardiovascular Diseases
- Multiple Sclerosis
- Rheumatoid Arthritis
- Cancer
- Trauma and Emergency
- Others
- Market Attractiveness Analysis: Indication
- Global Injectable Drug Delivery Market Outlook: Distribution Channel
- Introduction / Key Findings
- Historical Market Size (US$ Bn) Analysis, By Distribution Channel, 2019 - 2024
- Market Size (US$ Bn) Analysis and Forecast, By Distribution Channel, 2025 - 2032
- Hospital Pharmacies
- Drug Stores
- Retail Pharmacies
- Online Pharmacies
- Market Attractiveness Analysis: Distribution Channel
- Key Highlights
- Global Injectable Drug Delivery Market Outlook: Region
- Key Highlights
- Historical Market Size (US$ Bn) Analysis, By Region, 2019 - 2024
- Market Size (US$ Bn) Analysis and Forecast, By Region, 2025 - 2032
- North America
- Europe
- East Asia
- South Asia and Oceania
- Latin America
- Middle East & Africa
- Market Attractiveness Analysis: Region
- North America Injectable Drug Delivery Market Outlook
- Key Highlights
- Historical Market Size (US$ Bn) Analysis, By Market, 2019 - 2024
- By Country
- By Product
- By Technology
- By Usage
- By Indication
- By Distribution Channel
- Market Size (US$ Bn) Analysis and Forecast, By Country, 2025 - 2032
- U.S.
- Canada
- Market Size (US$ Bn) Analysis and Forecast, By Product, 2025 - 2032
- Self-Injectors
- Single Chamber
- Dual Chamber
- Needle Free Injectors
- Prefilled
- Fillable
- Auto Injectors
- Prefilled
- Fillable
- Wearable Injectors
- Wearable Patch Injectors
- Off-body Worn Injectors
- Insulin Pens
- Reusable
- Disposable
- Smart
- Self-Injectors
- Market Size (US$ Bn) Analysis and Forecast, By Technology, 2025 - 2032
- Non-Smart Injectors
- Smart Injectors
- Artificial Intelligence (AI) and Machine Learning (ML) Integrated
- Near Filed Communication (NFC)
- Cloud Computing
- Bluetooth
- Market Size (US$ Bn) Analysis and Forecast, By Usage, 2025 - 2032
- Disposable
- Reusable
- Market Size (US$ Bn) Analysis and Forecast, By Indication, 2025 - 2032
- Anaphylaxis
- Diabetes
- Cardiovascular Diseases
- Multiple Sclerosis
- Rheumatoid Arthritis
- Cancer
- Trauma and Emergency
- Others
- Market Size (US$ Bn) Analysis and Forecast, By Distribution Channel, 2025 - 2032
- Hospital Pharmacies
- Drug Stores
- Retail Pharmacies
- Online Pharmacies
- Market Attractiveness Analysis
- Europe Injectable Drug Delivery Market Outlook
- Key Highlights
- Historical Market Size (US$ Bn) Analysis, By Market, 2019 - 2024
- By Country
- By Product
- By Technology
- By Usage
- By Indication
- By Distribution Channel
- Market Size (US$ Bn) Analysis and Forecast, By Country, 2025 - 2032
- Germany
- France
- U.K.
- Italy
- Spain
- Russia
- Türkiye
- Rest of Europe
- Market Size (US$ Bn) Analysis and Forecast, By Product, 2025 - 2032
- Self-Injectors
- Single Chamber
- Dual Chamber
- Needle Free Injectors
- Prefilled
- Fillable
- Auto Injectors
- Prefilled
- Fillable
- Wearable Injectors
- Wearable Patch Injectors
- Off-body Worn Injectors
- Insulin Pens
- Reusable
- Disposable
- Smart
- Self-Injectors
- Market Size (US$ Bn) Analysis and Forecast, By Technology, 2025 - 2032
- Non-Smart Injectors
- Smart Injectors
- Artificial Intelligence (AI) and Machine Learning (ML) Integrated
- Near Filed Communication (NFC)
- Cloud Computing
- Bluetooth
- Market Size (US$ Bn) Analysis and Forecast, By Usage, 2025 - 2032
- Disposable
- Reusable
- Market Size (US$ Bn) Analysis and Forecast, By Indication, 2025 - 2032
- Anaphylaxis
- Diabetes
- Cardiovascular Diseases
- Multiple Sclerosis
- Rheumatoid Arthritis
- Cancer
- Trauma and Emergency
- Others
- Market Size (US$ Bn) Analysis and Forecast, By Distribution Channel, 2025 - 2032
- Hospital Pharmacies
- Drug Stores
- Retail Pharmacies
- Online Pharmacies
- Market Attractiveness Analysis
- East Asia Injectable Drug Delivery Market Outlook
- Key Highlights
- Historical Market Size (US$ Bn) Analysis, By Market, 2019 - 2024
- By Country
- By Product
- By Technology
- By Usage
- By Indication
- By Distribution Channel
- Market Size (US$ Bn) Analysis and Forecast, By Country, 2025 - 2032
- China
- Japan
- South Korea
- Market Size (US$ Bn) Analysis and Forecast, By Product, 2025 - 2032
- Self-Injectors
- Single Chamber
- Dual Chamber
- Needle Free Injectors
- Prefilled
- Fillable
- Auto Injectors
- Prefilled
- Fillable
- Wearable Injectors
- Wearable Patch Injectors
- Off-body Worn Injectors
- Insulin Pens
- Reusable
- Disposable
- Smart
- Self-Injectors
- Market Size (US$ Bn) Analysis and Forecast, By Technology, 2025 - 2032
- Non-Smart Injectors
- Smart Injectors
- Artificial Intelligence (AI) and Machine Learning (ML) Integrated
- Near Filed Communication (NFC)
- Cloud Computing
- Bluetooth
- Market Size (US$ Bn) Analysis and Forecast, By Usage, 2025 - 2032
- Disposable
- Reusable
- Market Size (US$ Bn) Analysis and Forecast, By Indication, 2025 - 2032
- Anaphylaxis
- Diabetes
- Cardiovascular Diseases
- Multiple Sclerosis
- Rheumatoid Arthritis
- Cancer
- Trauma and Emergency
- Others
- Market Size (US$ Bn) Analysis and Forecast, By Distribution Channel, 2025 - 2032
- Hospital Pharmacies
- Drug Stores
- Retail Pharmacies
- Online Pharmacies
- Market Attractiveness Analysis
- South Asia & Oceania Injectable Drug Delivery Market Outlook
- Key Highlights
- Historical Market Size (US$ Bn) Analysis, By Market, 2019 - 2024
- By Country
- By Product
- By Technology
- By Usage
- By Indication
- By Distribution Channel
- Market Size (US$ Bn) Analysis and Forecast, By Country, 2025 - 2032
- India
- Southeast Asia
- ANZ
- Rest of South Asia & Oceania
- Market Size (US$ Bn) Analysis and Forecast, By Product, 2025 - 2032
- Self-Injectors
- Single Chamber
- Dual Chamber
- Needle Free Injectors
- Prefilled
- Fillable
- Auto Injectors
- Prefilled
- Fillable
- Wearable Injectors
- Wearable Patch Injectors
- Off-body Worn Injectors
- Insulin Pens
- Reusable
- Disposable
- Smart
- Self-Injectors
- Market Size (US$ Bn) Analysis and Forecast, By Technology, 2025 - 2032
- Non-Smart Injectors
- Smart Injectors
- Artificial Intelligence (AI) and Machine Learning (ML) Integrated
- Near Filed Communication (NFC)
- Cloud Computing
- Bluetooth
- Market Size (US$ Bn) Analysis and Forecast, By Usage, 2025 - 2032
- Disposable
- Reusable
- Market Size (US$ Bn) Analysis and Forecast, By Indication, 2025 - 2032
- Anaphylaxis
- Diabetes
- Cardiovascular Diseases
- Multiple Sclerosis
- Rheumatoid Arthritis
- Cancer
- Trauma and Emergency
- Others
- Market Size (US$ Bn) Analysis and Forecast, By Distribution Channel, 2025 - 2032
- Hospital Pharmacies
- Drug Stores
- Retail Pharmacies
- Online Pharmacies
- Market Attractiveness Analysis
- Latin America Injectable Drug Delivery Market Outlook
- Key Highlights
- Historical Market Size (US$ Bn) Analysis, By Market, 2019 - 2024
- By Country
- By Product
- By Technology
- By Usage
- By Indication
- By Distribution Channel
- Market Size (US$ Bn) Analysis and Forecast, By Country, 2025 - 2032
- Brazil
- Mexico
- Rest of Latin America
- Market Size (US$ Bn) Analysis and Forecast, By Product, 2025 - 2032
- Self-Injectors
- Single Chamber
- Dual Chamber
- Needle Free Injectors
- Prefilled
- Fillable
- Auto Injectors
- Prefilled Auto Injectors
- Fillable
- Wearable Injectors
- Wearable Patch Injectors
- Off-body Worn Injectors
- Insulin Pens
- Reusable
- Disposable
- Smart
- Self-Injectors
- Market Size (US$ Bn) Analysis and Forecast, By Technology, 2025 - 2032
- Non-Smart Injectors
- Smart Injectors
- Artificial Intelligence (AI) and Machine Learning (ML) Integrated
- Near Filed Communication (NFC)
- Cloud Computing
- Bluetooth
- Market Size (US$ Bn) Analysis and Forecast, By Usage, 2025 - 2032
- Disposable
- Reusable
- Market Size (US$ Bn) Analysis and Forecast, By Indication, 2025 - 2032
- Anaphylaxis
- Diabetes
- Cardiovascular Diseases
- Multiple Sclerosis
- Rheumatoid Arthritis
- Cancer
- Trauma and Emergency
- Others
- Market Size (US$ Bn) Analysis and Forecast, By Distribution Channel, 2025 - 2032
- Hospital Pharmacies
- Drug Stores
- Retail Pharmacies
- Online Pharmacies
- Market Attractiveness Analysis
- Middle East & Africa Injectable Drug Delivery Market Outlook
- Key Highlights
- Historical Market Size (US$ Bn) Analysis, By Market, 2019 - 2024
- By Country
- By Product
- By Technology
- By Usage
- By Indication
- By Distribution Channel
- Market Size (US$ Bn) Analysis and Forecast, By Country, 2025 - 2032
- GCC Countries
- Egypt
- South Africa
- Northern Africa
- Rest of Middle East & Africa
- Market Size (US$ Bn) Analysis and Forecast, By Product, 2025 - 2032
- Self-Injectors
- Single Chamber
- Dual Chamber
- Needle Free Injectors
- Prefilled
- Fillable
- Auto Injectors
- Prefilled
- Fillable
- Wearable Injectors
- Wearable Patch Injectors
- Off-body Worn Injectors
- Insulin Pens
- Reusable
- Disposable
- Smart
- Self-Injectors
- Market Size (US$ Bn) Analysis and Forecast, By Technology, 2025 - 2032
- Non-Smart Injectors
- Smart Injectors
- Artificial Intelligence (AI) and Machine Learning (ML) Integrated
- Near Filed Communication (NFC)
- Cloud Computing
- Bluetooth
- Market Size (US$ Bn) Analysis and Forecast, By Usage, 2025 - 2032
- Disposable
- Reusable
- Market Size (US$ Bn) Analysis and Forecast, By Indication, 2025 - 2032
- Anaphylaxis
- Diabetes
- Cardiovascular Diseases
- Multiple Sclerosis
- Rheumatoid Arthritis
- Cancer
- Trauma and Emergency
- Others
- Market Size (US$ Bn) Analysis and Forecast, By Distribution Channel, 2025 - 2032
- Hospital Pharmacies
- Drug Stores
- Retail Pharmacies
- Online Pharmacies
- Market Attractiveness Analysis
- Competition Landscape
- Market Share Analysis, 2024
- Market Structure
- Competition Intensity Mapping By Market
- Competition Dashboard
- Company Profiles (Details - Overview, Financials, Strategy, Recent Developments)
- Baxter International Inc.
- Overview
- Segments and Products
- Key Financials
- Market Developments
- Market Strategy
- Eli Lilly and Company
- Ypsomed AG
- Terumo Corporation
- Schott AG
- Sanofi
- Becton, Dickinson and Company
- Unilife Corporation
- Gerresheimer AG
- Elcam Medical
- Digital Medics Pty Ltd
- AbbVie Inc.
- West Pharmaceutical Services, Inc.
- Vetter Pharma-Fertigung GmbH & Co.KG
- Others
- Baxter International Inc.
- Appendix
- Research Methodology
- Research Assumptions
- Acronyms and Abbreviations

Loading page data
Please wait a moment


