


- Processed Food
- Edible Insects Market
Edible Insects Market Size, Share, and Growth Forecast 2026 - 2033
Edible Insects Market by Insect Type (Crickets and Grasshoppers, Beetles, Caterpillars, Ants, Bees, and Wasps, Others), Form (Whole, Powder, Specialty Food Ingredients), Distribution Channel (B2B, B2C), by Regional Analysis, 2026 - 2033
Edible Insects Market Share and Trends Analysis
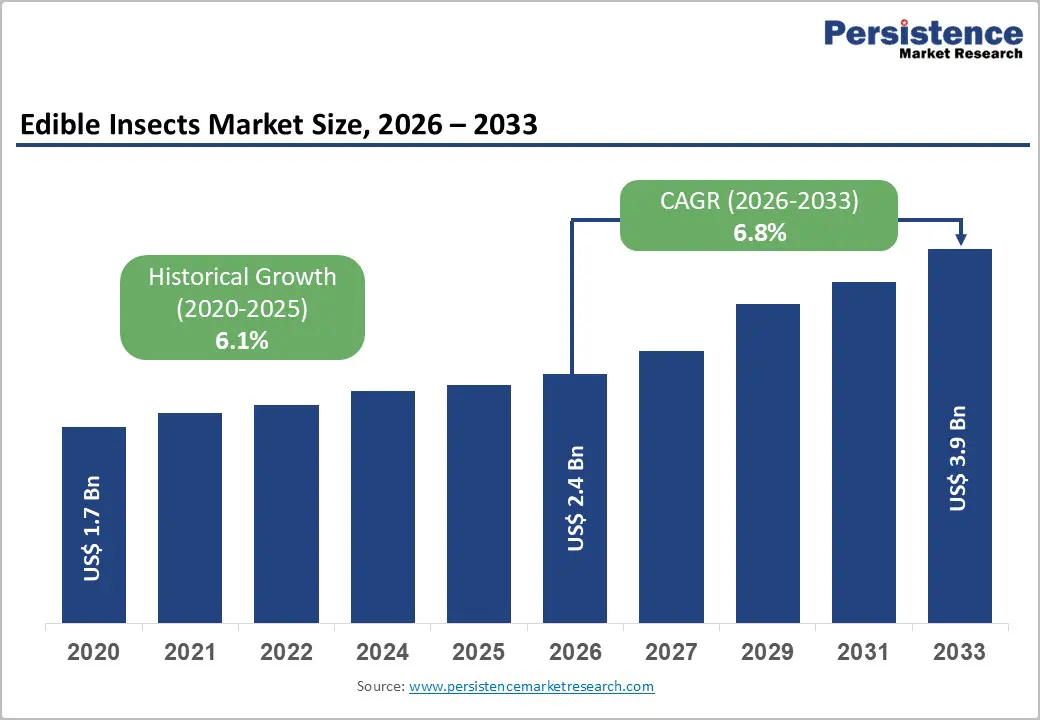
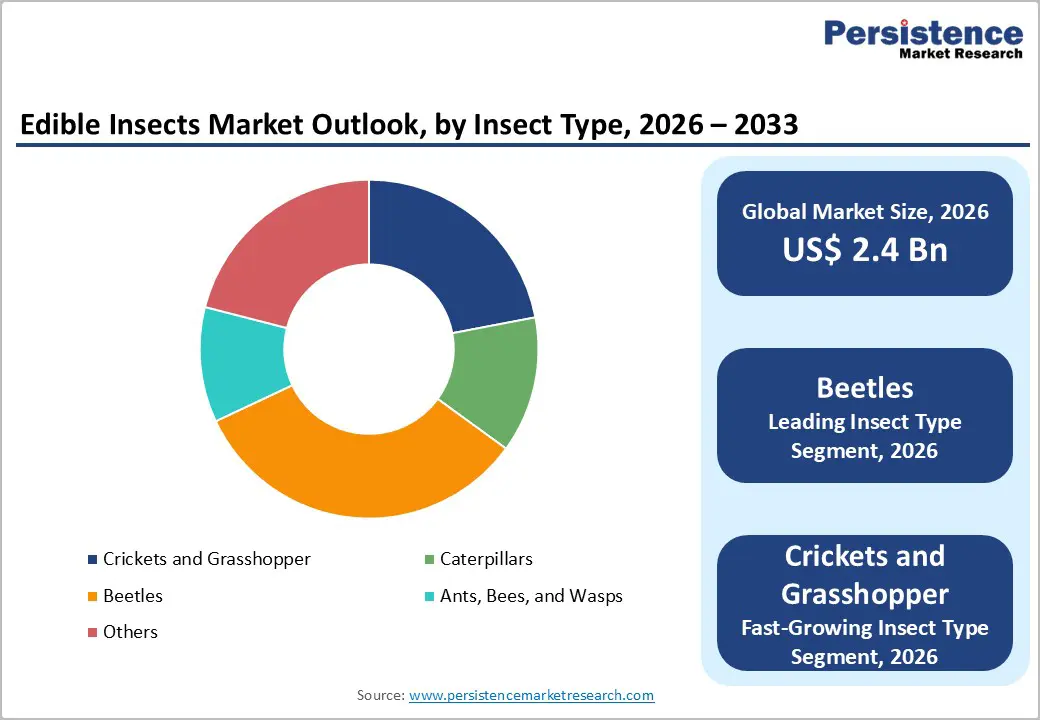
The global Edible Insects market size is expected to be valued at US$ 2.4 billion in 2026 and projected to reach US$ 3.9 billion by 2033, growing at a CAGR of 6.8% between 2026 and 2033.
The rise in global demand for sustainable, high-protein alternative food sources, landmark regulatory approvals in Europe and North America unlocking mainstream market access, and growing food industry adoption of insect protein and insect-derived ingredients in human food and animal feed formulations. The Food and Agriculture Organization (FAO) has formally endorsed edible insects as a nutritionally rich, environmentally superior protein source requiring significantly less land, water, and feed than conventional livestock a position that is increasingly translating into government policy support and consumer acceptance across developed and developing markets alike, reinforcing the market's strong forecast trajectory through 2033.
Key Industry Highlights:
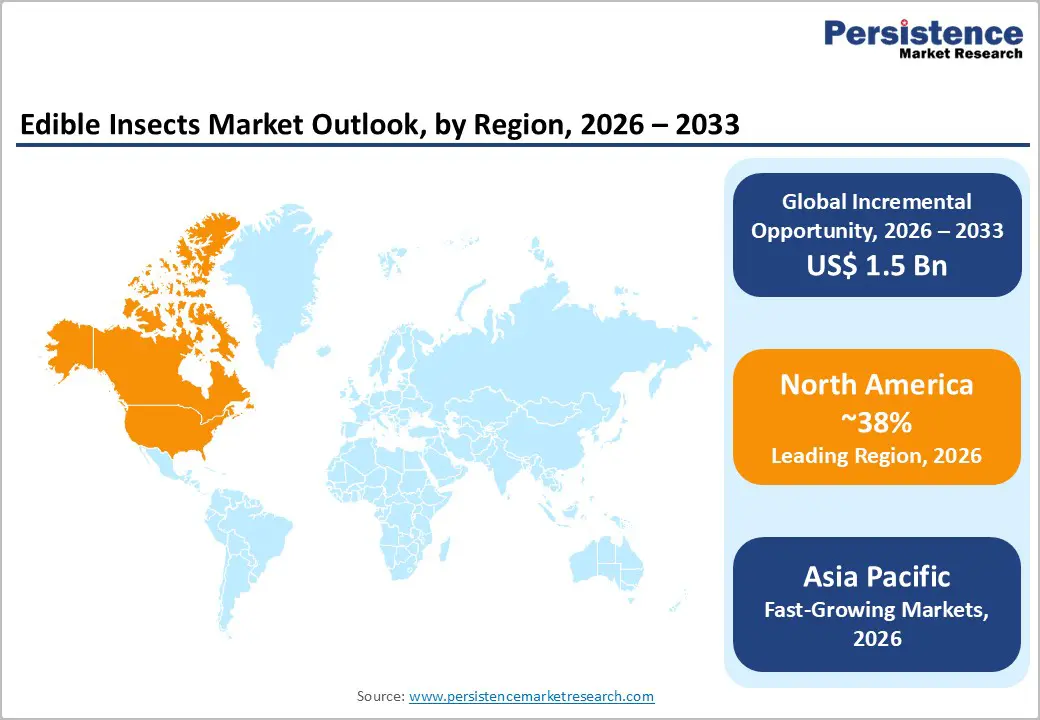
- Regional Leadership: North America leads the global Edible Insects market with approximately 38% share in 2026, supported by a vibrant alternative protein startup ecosystem, FDA permissive regulatory environment for insect food products, and growing mainstream retail penetration of cricket protein snacks driven by consumer sustainability and high-protein dietary trends.
- Fast-growing Market: Asia Pacific is the fast-growing regional edible insects, leveraging Thailand's 20,000+ commercial cricket farms, China's aquafeed-driven insect protein investment, and centuries of traditional insect consumption across Southeast Asian nations, providing both commercial production scale and cultural consumer acceptance foundations.
- Leading Insect Type: Beetles dominate the insect type category with approximately 33% market share in 2025, anchored by EFSA novel food approvals for yellow mealworm (Tenebrio molitor) and lesser mealworm, and large-scale automated production from global leaders Ÿnsect and Protix supplying both human food ingredient and aquafeed markets.
- Fast-growing Insect Type: Crickets and Grasshoppers are the fast-growing insect type segment, fueled by the EFSA's January 2023 approval of house cricket as a novel food ingredient, approximately 65–70% dry-weight protein content, and growing mainstream food manufacturer adoption of cricket flour in protein bars, snacks, and bakery products globally.
- Opportunity: The animal feed and aquaculture sector represents the highest near-term volume opportunity for edible insect producers, following EU approval of insect proteins for poultry, pig, and aquafeed use, with global fishmeal supply constraints creating strong commercial incentive for aquafeed manufacturers to adopt insect meal as a sustainable fishmeal replacement ingredient.
Market Dynamics
How do FAO-endorsed sustainability credentials and growing regulatory support expand market access?
The edible insects market's growth is fundamentally underpinned by its exceptional sustainability profile relative to conventional animal proteins, a distinction formally validated by the Food and Agriculture Organization (FAO) in its landmark 2013 report 'Edible Insects: Future Prospects for Food and Feed Security'. The FAO documented that insects produce approximately 2.2 kg of CO? equivalent per kilogram of protein, compared to 2,850 kg for beef, while requiring as little as 2 kg of feed to produce 1 kg of insect biomass, versus 8 kg of feed for beef production. These environmental metrics are resonating powerfully with food manufacturers, investors, and regulators. The European Food Safety Authority (EFSA) has progressively approved multiple edible insect species under the EU Novel Food Regulation (EU) 2015/2283, including house crickets, yellow mealworms, migratory locusts, and lesser mealworms—each approval opening new commercial pathways for European food manufacturers to incorporate insect protein ingredients into human food products.
Does the Growth in Global Protein Demand and Alternative Protein Acceptance Drive Consumer Markets?
Accelerating global protein demand driven by population growth, rising per-capita protein consumption in emerging economies, and the proliferation of high-protein dietary trends is creating structural demand for alternative protein sources, including insect protein. The United Nations (UN) projects the global population will reach 9.7 billion by 2050, requiring food systems to produce approximately 70% more food than current levels.
Concurrently, consumer acceptance of insect-derived food products is growing meaningfully in Western markets, supported by the success of cricket protein-based snack brands, insect protein-enriched energy bars, and specialty insect food products in natural food retail channels. A 2022 study published in the journal Foods found that consumer willingness to try insect-based foods in the United States and Europe has grown significantly among younger demographics, with environmental sustainability and nutritional benefits cited as primary drivers.
Why do Consumer Neophobia and Psychological Barriers to Insect Consumption in Western Markets, Challenging?
Despite growing regulatory approvals and sustainability credentials, consumer neophobia, the psychological aversion to unfamiliar foods, remains the most significant demand-side restraint in Western markets. Research published in the International Journal of Consumer Studies consistently identifies disgust sensitivity and food neophobia as the primary barriers to insect food adoption among Western consumers. Surveys indicate that while many consumers intellectually accept insects as a sustainable food source, a significantly smaller proportion are willing to purchase and consume insect-derived foods, particularly in whole insect form. Overcoming this psychological barrier requires sustained consumer education investment and product formats that minimize the visibility of insect origins.
Does Allergen Cross-Reactivity and Food Safety Regulatory Complexity Create More Challenges?
Edible insects present specific allergen concerns, particularly cross-reactivity between insect proteins and shellfish and dust mite allergens that create food safety compliance complexities for manufacturers and regulatory authorities. The EFSA has issued specific guidance requiring mandatory allergen labeling for approved novel food insects in the European Union. These allergenicity concerns complicate mass-market product positioning and require comprehensive pre-market safety dossiers, imposing substantial regulatory compliance costs on smaller insect food startups and limiting the pace of new species approvals across major markets.
Are the Rapidly Growing Cricket and Grasshopper Protein Applications in Mainstream Food Formulation Create More Opportunities?
Crickets and grasshoppers represent the fastest-growing insect type segment, driven by their superior protein profile. Cricket flour contains approximately 65–70% protein by dry weight, according to research published in the Journal of Agricultural and Food Chemistry, and their proven consumer acceptability in powder and ingredient form for mainstream food applications.
The EFSA approval of Acheta domesticus (house cricket) as a novel food in January 2023 was a watershed moment, enabling EU food manufacturers to launch cricket protein-enriched food products commercially. Companies including Entomo Farms, Jimini's, and Gryllus Inc. are expanding cricket flour production capacity to serve growing demand from food manufacturers developing protein-enriched crackers, pasta, energy bars, and bakery products targeting health-conscious mainstream consumers. Cricket protein's neutral flavor profile, complete amino acid composition, and high digestibility make it particularly well-suited for mainstream ingredient adoption.
Expanding Insect Protein Applications in Animal Feed and Aquaculture Sectors
Beyond human food applications, the animal feed and aquaculture sectors represent a major near-term commercial opportunity for edible insect producers. The European Commission approved the use of insect-derived proteins in poultry and pig feed in 2021 under Regulation (EC) 999/2001 amendments, recognizing insects' nutritional equivalence to conventional fishmeal and soybean meal protein sources. Global fishmeal demand driven by the aquaculture sector's expansion is outpacing sustainable supply, creating a strong commercial incentive for aquafeed manufacturers to adopt insect meal as a fishmeal replacement. Ÿnsect (France) and Protix (Netherlands) have secured significant investment and supply agreements with major aquafeed producers to supply black soldier fly (Hermetia illucens) protein meal and oil at a commercial scale, validating the commercial viability of insect protein in the feed ingredient sector.
Category-wise Analysis
Insect Type Insights
Beetles (order Coleoptera), encompassing mealworms and lesser mealworms as the primary commercially produced species, lead the global edible insects market by insect type, commanding approximately 33% of global market share in 2026. Beetles' market leadership is anchored by the successful commercialization of yellow mealworm (Tenebrio molitor) and lesser mealworm (Alphitobius diaperinus), both of which have received EFSA novel food approval in the European Union, enabling broad food manufacturer adoption.
Mealworms offer a well-documented nutritional profile, approximately 50–55% protein on a dry weight basis with a favorable amino acid composition, and are amenable to large-scale industrial rearing using agricultural byproducts as feed substrates. Ÿnsect (France) and Protix (Netherlands) are the global market leaders in mealworm production, with significant automated vertical farming facilities supplying both human food ingredient and animal feed markets.
Form Insights
Powder is the leading form segment in the edible insects market, accounting for approximately 45% of global market share in 2026. Insect protein powder produced through drying, defatting, and milling of whole insects into flour or protein concentrate dominates commercial volumes owing to its versatility as a functional food ingredient in baked goods, protein bars, pasta, snacks, and sports nutrition products. The powder format effectively mitigates consumer neophobia by eliminating visual identification of the insect origin, enabling broader mainstream consumer acceptance compared to whole insect products.
Food manufacturers favor insect protein powder for its standardized protein content, ease of incorporation into existing food formulation processes, and neutral-to-mild flavor profile. Leading suppliers, including Entomo Farms, EVO Conversion Systems, and Jimini's, have established powder as the primary commercial product format for both B2B ingredient supply and B2C consumer-facing products.
Distribution Channel Insights
B2B is the leading distribution channel for edible insects, capturing approximately 62% of global market share in 2025. The B2B channel's dominance reflects the current commercial stage of the edible insects market, where the majority of insect biomass is supplied as ingredient inputs, including insect protein meal, insect oil, and insect protein isolates to food manufacturers, aquafeed producers, and pet food manufacturers rather than sold directly to end consumers. Large B2B supply agreements between major insect protein producers and established food ingredient companies represent the primary commercial transaction format. The EU's progressive approval of insect species for food and feed applications has activated significant food manufacturer ingredient procurement activity, with large food conglomerates exploring insect protein as a sustainable ingredient platform. While the B2C segment encompassing insect protein consumer snacks, whole insect retail products, and direct-to-consumer platforms is growing fastest, B2B's scale and institutional procurement dynamics maintain its channel leadership.
Regional Insights
North America Edible Insects Market Trends and Insights
North America leads the global edible insects market with approximately 38% market share in 2025, driven by the United States' vibrant alternative protein startup ecosystem, high consumer awareness of sustainable food trends, and growing retail availability of cricket protein-based snacks and supplements. The U.S. Food and Drug Administration (FDA) has facilitated a permissive regulatory environment for insect food products, classifying most edible insect species as Generally Recognized as Safe (GRAS) for food use, enabling market development ahead of formal rulemaking.
U.S. Edible Insects Market Size
The United States accounts for approximately 86% of North America's edible insects market, anchored by a mature alternative protein consumer segment, a well-capitalized insect food startup ecosystem, and strong natural food retail channel penetration for cricket protein products. Companies including Chapul, EXO Protein, and Aketta (by Aspire Food Group) have pioneered mainstream retail insect food product commercialization in the U.S., demonstrating the commercial viability of insect protein in consumer-facing food categories.
Europe Edible Insects Market Trends and Insights
Europe is the fastest-growing regional market for edible insects, propelled by a series of landmark EFSA novel food approvals that have progressively unlocked commercial food manufacturing adoption across EU member states. The Netherlands, France, Belgium, and Germany are the region's most active insect food markets, supported by leading insect protein producers including Protix, Ÿnsect, Hexafly, and Entomo operating significant production facilities. The EU Farm to Fork Strategy's commitment to sustainable food systems is providing institutional tailwinds for insect protein market development.
Germany Edible Insects Market Size
Germany represents approximately 21% of Europe's edible insects market, anchored by its large food manufacturing sector, strong sustainability consumer consciousness, and active venture investment in insect protein startups. EFSA novel food approvals covering mealworms, crickets, locusts, and lesser mealworms have enabled German food manufacturers to begin commercial integration of insect protein ingredients into mainstream packaged food products, with organic and natural food retailers leading product placement adoption.
U.K. Edible Insects Market Size
The U.K. represents approximately 16% of Europe's edible insects market. Post-Brexit, the U.K. established its own novel food regulatory framework under the Food Standards Agency (FSA), which has been progressively aligning with EU insect food approvals. The U.K.'s vibrant alternative protein consumer culture and strong natural food retail ecosystem anchored by chains including Holland & Barrett and Ocado provide effective retail distribution for insect protein consumer products targeting health-conscios and sustainability-oriented shoppers.
France Edible Insects Market Size
France accounts for approximately 14% of Europe's edible insects market and is home to Ÿnsect, one of the world's largest and most technologically advanced insect protein producers. French government support through BpiFrance financing and public R&D programs has made France a global leader in insect protein production scale-up. ANSES (Agence Nationale de Sécurité Sanitaire) regulations governing insect food safety align with EFSA novel food frameworks, enabling French food manufacturers to actively develop insect protein-enriched consumer food products.
Asia Pacific Edible Insects Market Trends and Insights
Asia Pacific is the fastest-growing regional market for edible insects by CAGR, yet also home to the world's oldest and most established insect consumption traditions, particularly across Thailand, Vietnam, China, Japan, and India. Thailand leads global edible insect production volume, with the Food and Agriculture Organization (FAO) estimating over 20,000 cricket farms operating in Thailand, producing insects primarily for domestic consumption and regional export. China is actively investing in industrialized insect protein production for aquafeed and livestock feed applications under sustainability-driven agricultural modernization programs.
India Edible Insects Market Size
India represents approximately 7% of Asia Pacific's edible insects market, with demand primarily concentrated in northeastern states, including Nagaland, Manipur, and Meghalaya where insect consumption is part of traditional food culture. Growing urban awareness of insect protein's sustainability and nutritional benefits, combined with India's large aquaculture sector requiring alternative fishmeal sources, positions India as an emerging growth market for both food and feed insect protein applications.
Japan Edible Insects Market Size
Japan accounts for approximately 11% of Asia Pacific's edible insects market. Japan's Ministry of Agriculture, Forestry and Fisheries (MAFF) has been actively supporting insect protein development for aquafeed and livestock applications, with several major food companies including Gryllus Inc. (a cricket food startup spun out of Tokushima University) commercializing cricket flour-based food products in domestic markets. Japan's health-conscious consumer culture and premium food positioning are supporting growing consumer insect food product development.
Competitive Landscape
The Edible Insects Market is highly competitive, driven by rising demand for sustainable protein sources and growing consumer interest in alternative nutrition. Companies are focusing on large-scale insect farming, advanced processing technologies, and product innovation in protein powders, snacks, bakery ingredients, and animal feed applications. Strong emphasis is placed on improving taste, safety standards, and regulatory compliance to increase consumer acceptance. Partnerships with food manufacturers and retail expansion are supporting wider market reach.
Key Developments
- In January 2025, the European Commission officially authorized the placing on the market of UV-treated powder of whole Tenebrio molitor larvae (yellow mealworm) as a novel food.
- In August 2024, the Singapore Food Agency (SFA) approved 16 insect species for consumption, allowing industry players to develop insect-based recipes and products.
- In March 2024, East African scientists developed a global insect atlas, analyzing 2,205 species consumed across 128 nations, with Asia, North America, Mexico, and Africa being the largest consumers.
Global Edible Insects Market – Key Insights & Details
| Key Insights | Details |
|---|---|
|
Historical Market Value (2020) |
US$ 1.7 Billion |
|
Current Market Value (2026) |
US$ 2.4 Billion |
|
Projected Market Value (2033) |
US$ 3.9 Billion |
|
CAGR (2026–2033) |
6.8% |
|
Leading Region |
North America, 38% market share (2025) |
|
Dominant Insect Type |
Beetles, ~33% market share (2025) |
|
Top-Ranking Form |
Powder, ~45% market share (2025) |
|
Incremental Opportunity (2026–2033) |
US$ 1.5 Billion |
Companies Covered in Edible Insects Market
- Hologic, Inc.
- GE HealthCare
- Siemens Healthineers
- Koninklijke Philips N.V.
- FUJIFILM Corporation
- Canon Medical Systems Corporation
- Carestream Health
- Planmed Oy
- Metaltronica S.p.A.
- Konica Minolta, Inc.
- Analogic Corporation
- IMS Giotto
Frequently Asked Questions
The global Edible Insects market is estimated to be valued at US$ 2.4 billion in 2026.
The key demand drivers are the FAO-validated exceptional sustainability profile of insect protein requiring approximately 2 kg of feed per 1 kg of biomass versus 8 kg for beef and progressive regulatory approvals unlocking mainstream market access, including EFSA novel food approvals for crickets, mealworms, and locusts in the EU.
North America leads the global Edible Insects market with approximately 38% market share in 2025, primarily driven by the United States' vibrant alternative protein startup ecosystem, FDA permissive regulatory environment for insect food products, and strong natural food retail penetration for cricket protein snacks and supplements.
The largest near-term commercial opportunity is the animal feed and aquaculture sector, following EU approval of insect proteins for use in poultry, pig, and aquafeed in 2021 under EU Regulation (EC) 999/2001 amendments.
Leading companies in the global Edible Insects market include Ÿnsect (France), Protix (Netherlands), Innovafeed (France), Entomo Farms (Canada), Aspire Food Group (USA), Jimini's (France), Hexafly (Ireland), Gryllus Inc. (Japan), AgriProtein (South Africa), Beta Hatch (USA), Chapul Farms (USA), and Crik Nutrition (Canada), among others.


