


- Industrial Automation
- Crystalline Solar Panels Market
Crystalline Solar Panels Market Size, Share, and Growth Forecast, 2026 - 2033
Crystalline Solar Panels Market by Product Type (Standard Crystalline Solar Panels, Flexible Crystalline Solar Panels, Others), Application (Residential, Commercial, Others), End-user (Government and Public Sector, Private Sector, Others), and Regional Analysis for 2026 - 2033
Crystalline Solar Panels Market Size and Trends Analysis
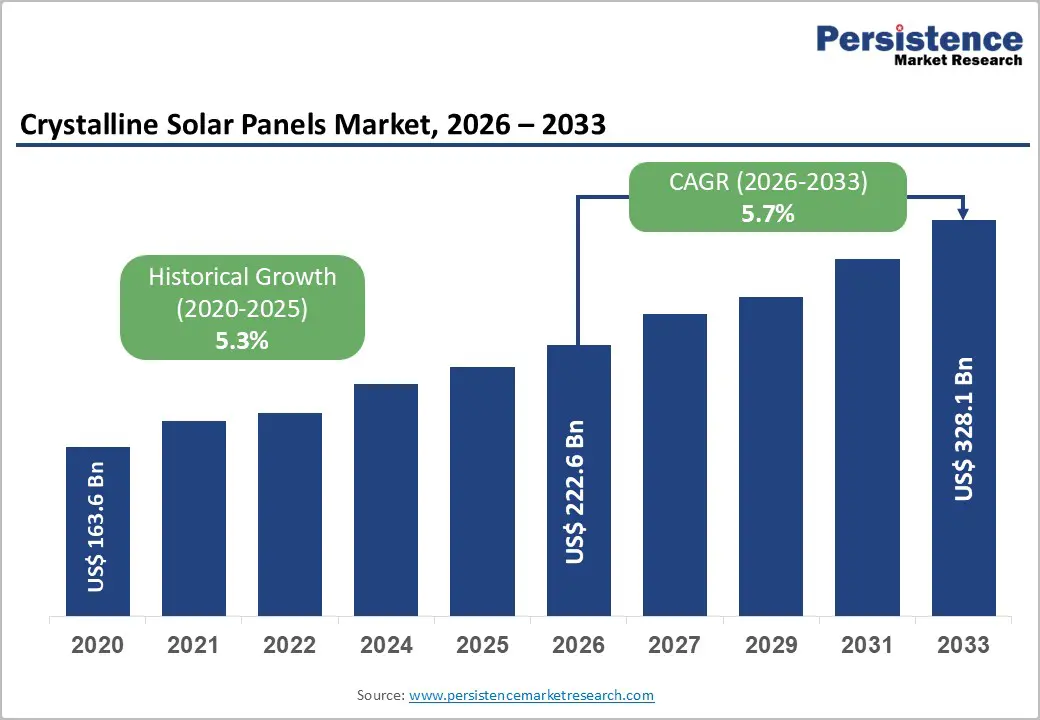
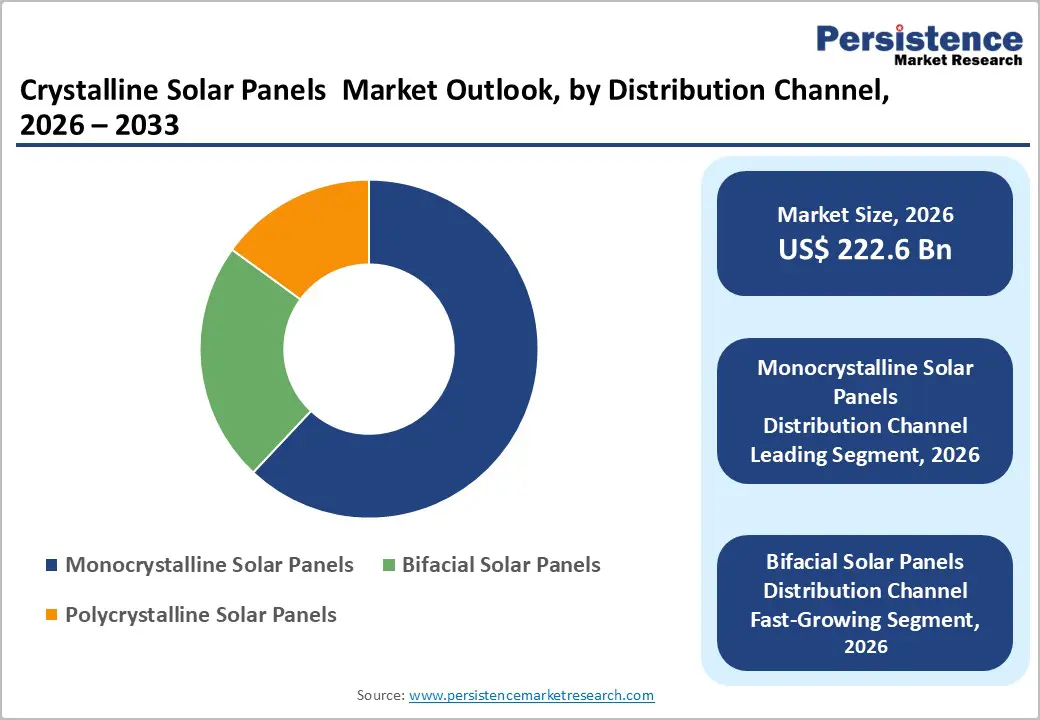
The global crystalline solar panels market size is likely to be valued at US$222.6 billion in 2026, and is expected to reach US$328.1 billion by 2033, growing at a CAGR of 5.7% during the forecast period from 2026 to 2033, driven by the increasing prevalence of renewable energy adoption, declining levelized cost of electricity (LCOE) for solar PV, rising government incentives for clean energy, and growing demand for high-efficiency crystalline modules in utility-scale and residential installations.
Growing demand for monocrystalline and bifacial crystalline solar panels, especially in utility-scale solar power plants and residential rooftops, is accelerating adoption across end-users. Increasing recognition of crystalline solar panels as critical for energy transition, cost-competitive power generation, and carbon footprint reduction in emerging solar markets remains a major driver of market growth.
Key Industry Highlights:
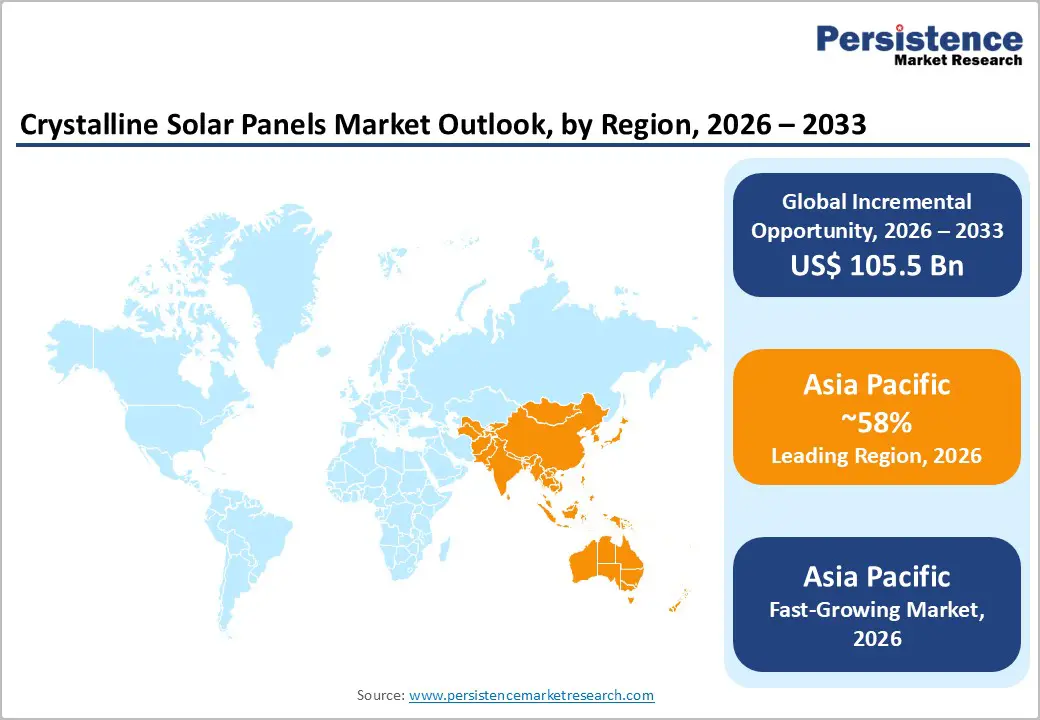
- Leading Region: Asia Pacific, anticipated to account for a 58% market share in 2026, driven by dominant manufacturing capacity, massive domestic installations, and strong export volumes in China.
- Fastest-growing Region: Asia Pacific, fueled by aggressive solar targets, falling module prices, and a rapid utility-scale project pipeline in India and Southeast Asia.
- Leading Product Type: Standard crystalline solar panels are projected to hold about 72% market share in 2026 due to mature manufacturing and proven field reliability.
- Dominant Technology: Monocrystalline solar panels, to hold approximately 62% of the market share, as they remain the highest-efficiency mainstream choice.
- January 2026, JA Solar and Trina Solar tied for the No. 1 position in Wood Mackenzie’s first-half 2025 global solar module manufacturer ranking. Wood Mackenzie introduced a new “Grade A” benchmark to guide utility procurement and project finance decisions.
| Key Insights | Details |
|---|---|
|
Crystalline Solar Panels Market Size (2026E) |
US$222.6 Bn |
|
Market Value Forecast (2033F) |
US$328.1 Bn |
|
Projected Growth CAGR (2026-2033) |
5.7% |
|
Historical Market Growth (2020-2025) |
5.3% |
Market Factors - Growth, Barriers, and Opportunity Analysis
Growth Analysis - Falling Solar LCOE and Policy Support
Crystalline solar panels have become more attractive for energy developers and investors as the levelized cost of electricity (LCOE) for utility-scale solar continued a long-term downward trend, making solar power increasingly competitive with conventional generation. According to the International Renewable Energy Agency, the global weighted average LCOE for utility-scale solar fell by about 90% since 2010, settling at around US$0.044 per kWh in 2023, highlighting sustained cost improvements and stronger project economics. Lower LCOE improves project return on investment and shortens payback periods for installations using crystalline silicon PV, which remains the dominant technology in commercial and utility deployments.
Policy front, governments have implemented incentives and frameworks that reduce financial barriers and enhance market growth for crystalline PV systems. In India, schemes under the Ministry of New & Renewable Energy, such as the Production Linked Incentive (PLI) Scheme for high-efficiency solar PV modules, have allocated capacity incentives to support domestic manufacturing, attracting investment and increasing local module supply. Additionally, programs such as the Pradhan Mantri Surya Ghar Muft Bijli Yojana provide direct consumer subsidies for rooftop solar installations, reducing upfront costs and expanding adoption nationally.
Technological Efficiency Gains and Bifacial Adoption
Rapid efficiency gains in crystalline silicon photovoltaics and wider deployment of bifacial modules are accelerating utility-scale and commercial solar adoption. Laboratory and field performance advances have raised energy yield per installed watt, improving project economics and shortening payback periods across high-irradiance markets. The National Renewable Energy Laboratory reported a certified 26.1% conversion efficiency for crystalline silicon solar cells in its best research results, evidencing sustained technology progress under government-validated testing frameworks. Bifacial designs capture reflected light from the rear side, lifting site productivity on high-albedo surfaces such as concrete and light gravel. These gains translate into higher capacity factors, improved land-use efficiency, and stronger investment returns for developers and asset owners.
Bifacial deployment benefits from standardized testing protocols and bankability criteria adopted in public procurement and grid-connected projects, strengthening lender confidence and procurement scale. The U.S. Department of Energy documented energy-yield uplifts of up to 10–20% for bifacial modules under suitable site conditions in federally supported field studies, supporting portfolio-wide performance modeling and underwriting. Higher yield per tracker row reduces balance-of-system costs per delivered kilowatt-hour, improving levelized cost of electricity outcomes for crystalline solar fleets.
Barrier Analysis - Supply Chain Disruptions and Raw Material Volatility
Tight polysilicon availability and logistics shocks constrain crystalline panel output and delivery schedules, elevating execution risk for utility and commercial projects. Public trade actions and customs enforcement alter supplier access and contract certainty across major importing regions, reshaping procurement strategies and inventory buffers. Input-cost volatility compounds procurement risk across silicon, glass, and aluminum frames, weakening near-term cost visibility for project finance.
The U.S. Energy Information Administration recorded energy price spikes during 2022 that raised electricity input costs for energy-intensive polysilicon manufacturing, transmitting upstream cost pressure into module pricing. Cost swings disrupt long-term offtake pricing and hedging strategies, complicate bankability assessments, and reduce contracting confidence across multi-gigawatt deployment pipelines.
Trade Barriers and Local Content Requirements
Trade barriers and local content requirements shape procurement strategies and project economics in the crystalline solar panels market through tariffs, import restrictions, and domestic manufacturing mandates. These policies re-route supply chains, narrow supplier pools, and extend qualification timelines for modules and components, which raises execution risk for developers and EPC firms. Public trade actions influence landed module prices and contract structures, prompting buyers to diversify sourcing and build inventory buffers to protect schedules.
Policy enforcement also increases compliance costs across traceability, customs documentation, and audits tied to origin verification. Oversight by the U.S. Department of Commerce and trade remedies adjudicated by the U.S. International Trade Commission create regulatory risk that affects long-term supply contracts.
Opportunity Analysis - Developments in Bifacial and High-Efficiency Modules
Rising performance of bifacial and high-efficiency crystalline modules is expanding revenue headroom across utility and commercial solar portfolios. Higher conversion efficiency lifts output per square meter, strengthening project economics through improved capacity factors and lower balance-of-system cost per delivered kilowatt-hour. Government-validated testing underscores the technology trajectory: the National Renewable Energy Laboratory reported a certified 26.1% conversion efficiency for crystalline silicon research cells, providing evidence of sustained headroom for commercial roadmaps. Bifacial architectures capture rear-side irradiance on reflective ground and tracker systems, raising site productivity and supporting tighter land-use planning for high-throughput plants.
Field performance data supports bankability and underwriting for bifacial deployment in large projects. The U.S. Department of Energy documented energy-yield uplifts of up to 10–20% for bifacial modules under suitable site conditions in federally supported field studies, strengthening performance modeling for lenders and asset owners. These gains improve levelized cost outcomes, favor higher-margin product mixes for manufacturers, and accelerate procurement of premium modules within utility tenders and corporate power purchase agreements.
Domestic Manufacturing Incentives
Public policy support for domestic manufacturing is creating a strong growth pathway for the crystalline solar panels market. Incentives tied to local production lower capital intensity for new factories, de-risk scale-up of wafer, cell, and module lines, and improve cost competitiveness against imports. Government-backed credits and procurement preferences strengthen demand visibility for locally produced panels, supporting long-term offtake contracts and capacity utilization. This policy environment encourages upstream integration into polysilicon and ingots, improves quality control through shorter supply chains, and strengthens resilience to trade disruptions. Manufacturers benefit from faster qualification with utilities and EPC firms that prioritize compliant local content in tenders and public-sector projects.
These incentives also catalyze technology transfer and workforce development, improving yields and throughput across production lines. Public funding programs and loan guarantees support automation, energy-efficient furnaces, and advanced cell architectures, lifting factory productivity and lowering unit costs over time. Oversight and implementation by the U.S. Department of Energy and trade facilitation led by the U.S. Department of Commerce provide predictable frameworks for investors.
Category-wise Analysis
Product Type Insights
Standard crystalline solar panels are anticipated to dominate the market, accounting for approximately 72% of the market share in 2026. Their dominance is driven by their mature manufacturing base, proven field reliability, and broad bankability with lenders and utilities. Long operating histories across climates support predictable performance modeling, which accelerates procurement for utility and commercial projects. Established supply chains enable large-volume delivery with stable quality control, shortening project timelines and reducing execution risk for EPC firms. Standard modules integrate smoothly with trackers, inverters, and balance-of-system components already qualified in tenders, lowering engineering complexity. Mono-PERC modules supplied by Canadian Solar in grid-connected solar plants across North America. Utilities and EPC firms favor standard crystalline modules for their proven reliability, predictable degradation rates, and compatibility with existing trackers and inverters.
Building-integrated photovoltaics (BIPV) represents the fastest-growing product type, due to cities’ push for net-zero buildings and developers, integrate power generation into façades, rooftops, and glazing. BIPV replaces conventional cladding materials with energy-producing elements, improving project economics through dual functionality and space efficiency. Urban density and stricter building-energy codes accelerate adoption in commercial offices, transport hubs, and premium residential projects. Onyx Solar in commercial and public buildings, where façade and skylight elements generate on-site electricity while serving as envelope materials. Technical validation and performance guidance for BIPV systems used in U.S. projects are documented by the National Renewable Energy Laboratory through government-supported case studies and design resources on BIPV integration, durability, and energy yield in real buildings. T
Technology Insights
Monocrystalline solar panels are expected to dominate the market, contributing nearly 62% of revenue in 2026, fueled by superior efficiency, stable performance across temperature ranges, and strong bankability with lenders and utilities. Higher power density enables more output per square meter, improving economics for land-constrained utility sites and commercial rooftops. Mature mono wafer supply chains support large-volume delivery with consistent quality, reducing execution risk for EPCs. Compatibility with single-axis trackers and advanced cell designs strengthens yield in utility deployments. High-efficiency mono modules supplied by JinkoSolar in grid-connected solar plants. EPC firms select monocrystalline modules for higher wattage per panel and stable temperature coefficients, which improve energy yield on constrained sites and optimize tracker row spacing.
Bifacial solar panels are the fastest-growing segment in the market, driven by developers seeking greater energy output per installed watt and improved overall project economics. By harvesting reflected light from the rear side, bifacial modules raise output on tracker-based plants and high-albedo sites such as concrete and light gravel. This performance uplift improves capacity factors, lowers levelized cost of electricity, and strengthens bid competitiveness in utility tenders. Standardization of mounting, validation of rear-side gains in field deployments, and lender acceptance accelerate bankability. Bifacial modules supplied by Trina Solar in utility-scale tracker projects. EPC firms specify bifacial designs to lift energy yield on reflective ground surfaces and single-axis trackers, improving project IRR and bid competitiveness in utility tenders. Government-backed field validation of bifacial performance is documented by the National Renewable Energy Laboratory through federally supported studies on rear-side gains and site conditions that maximize bifacial yield.
Regional Insights
North America Crystalline Solar Panels Market Trends
North America growth is stimulated by the region’s strong ITC incentives, large utility-scale pipeline, and high public awareness of solar benefits. Distribution systems in the United States and Canada provide extensive support for crystalline solar panels programs, ensuring wide accessibility across monocrystalline, utility-scale, and private sector populations. Increasing demand for high-efficiency, convenient, and easy-to-install forms is further accelerating adoption, as these formats improve ROI and reduce barriers associated with land constraints.
Innovation in crystalline solar panel technology, including stable bifacial, improved TOPCon delivery, and targeted commercial enhancement, is attracting significant investment from both public and private sectors. Government initiatives and IRA campaigns continue to promote use against energy-cost risks, sustainability concerns, and emerging clean-energy threats, creating sustained market demand. The growing focus on BIPV grades and specialty uses, particularly for utility-scale and other applications, is expanding the target applications for crystalline solar panels.
Europe Crystalline Solar Panels Market Trends
Europe is propelled by increasing awareness of renewable energy benefits, strong regulatory systems, and government-led REPowerEU programs. Countries such as Germany, Spain, France, and Italy have well-established solar frameworks that support routine crystalline solar panels use and encourage the adoption of innovative bifacial and BIPV delivery methods. These high-efficiency formulations are particularly appealing for utility-scale populations, regulation-conscious developers, and commercial users, improving yield and coverage rates.
Technological advancements in crystalline solar panels development, such as enhanced heterojunction, application-targeted delivery, and improved rooftop grades, are further boosting market potential. European authorities are increasingly supporting research and trials for panels against both routine and specialized needs, strengthening market confidence. The growing emphasis on convenient, high-yield options is aligned with the region’s focus on preventive fossil-fuel dependence and energy independence. Public awareness campaigns and promotion drives are expanding reach in both utility-scale and commercial segments, while suppliers are investing in advanced cells and novel variants to increase efficacy.
Asia Pacific Crystalline Solar Panels Market Trends
Asia Pacific is projected to dominate and be the fastest-growing market, capturing the 58% of the share in 2026, driven by rising renewable energy awareness, increasing government initiatives, and expanding application programs across the region. Countries such as China, India, Vietnam, and Australia are actively promoting solar campaigns to address energy demand and emerging net-zero needs. Crystalline solar panels are particularly attractive in these regions due to their cost-effective administration, ease of deployment, and suitability for large-scale utility-scale and rooftop drives in both urban and rural populations.
Technological advancements are supporting the development of stable, effective, and easy-to-install crystalline solar panels, which can withstand challenging climatic conditions and minimize LCOE dependence. These innovations are critical for reaching domestic developers and improving overall clean-energy coverage. Growing demand for monocrystalline, utility-scale, and private sector applications is contributing to market expansion. Public-private partnerships, increased renewable expenditure, and rising investment in solar research and capacity are further accelerating growth. The convenience of panel delivery, combined with improved efficiency and reduced risk of energy shortages, positions it as a preferred choice.
Competitive Landscape
The global crystalline solar panels market shows intense competition between Tier-1 manufacturers and emerging high-efficiency specialists. In Asia Pacific, JinkoSolar and JA Solar lead through large-scale manufacturing, cost leadership, and deep ties with utility developers, supported by the rapid commercialization of monocrystalline and bifacial platforms. Their scale advantages secure long-term supply contracts and shorten delivery cycles for multi-gigawatt pipelines. In North America and Europe, Canadian Solar and SunPower compete with premium, high-efficiency modules tailored to land-constrained utility sites and commercial rooftops, improving project bankability and access to incentives.
Monocrystalline deployment raises energy yield per square meter, stabilizes performance modeling, and reduces LCOE risk across portfolios. Bifacial technology improves site productivity on trackers and reflective surfaces, driving penetration in utility-scale plants. Strategic partnerships, co-development, and selective acquisitions combine device innovation with manufacturing scale, expanding capacity, strengthening regional footprints, and accelerating time-to-market for advanced module lines.
Key Industry Developments:
- In December 2025, JA Solar, a global partner in green energy, ranked No. 1 worldwide in the Wood Mackenzie Global Solar Module Manufacturer Ranking for the first half of 2025. The company secured an overall score of 91.7, the highest among all evaluated manufacturers, reflecting strong performance across bankability, manufacturing scale, and product reliability.
- In October 2024, JinkoSolar announced in October 2024 that it had launched its next-generation TOPCon technology solar panels under the Tiger Neo 3.0 series. The new portfolio delivered what the company described as the industry’s most powerful modules, with utility-oriented models reaching up to 670 W output and a conversion efficiency of up to 24.8 %. The series also included the first-ever 495 W residential modules and featured long-term warranties with low degradation rates, enhancing value for developers and end users.
Companies Covered in Crystalline Solar Panels Market
- Hanwha
- SunPower
- Sharp
- Canadian Solar
- Jinko Solar
- JA Solar
- Yingli
- Shunfeng
- ReneSola
- Risen
- Renogy Solar
- Emerald Sun Energy
- Elkem Solar
- Kyocera Solar
Frequently Asked Questions
The global crystalline solar panels market is projected to reach US$222.6 billion in 2026.
Grid-connected project pipelines continue to scale, sustaining high-volume demand for bankable crystalline modules.
The crystalline solar panels market is poised to witness a CAGR of 5.7% from 2026 to 2033.
Performance gains lift energy yield per site, supporting premium product mixes and higher margins.
Jinko Solar, JA Solar, Canadian Solar, Trina Solar, and LONGi are the key players.


