


- Food Ingredients & Additives
- Natural Food Colors Market
Natural Food Colors Market Size, Share, Growth, and Regional Forecast, 2026 to 2033
Natural Food Colors Market by Product Type (Carotenoids, Anthocyanins, Curcumin, Carmine, Chlorophyll, Others), by Form (Dry, Liquid), by End-user (Beverages, Bakery & Confectionery, Processed Foods, Meat Products, Pharmaceuticals & Nutraceuticals, Others), by Regional Analysis, 2026 - 2033
Natural Food Colors Market Share and Trends Analysis
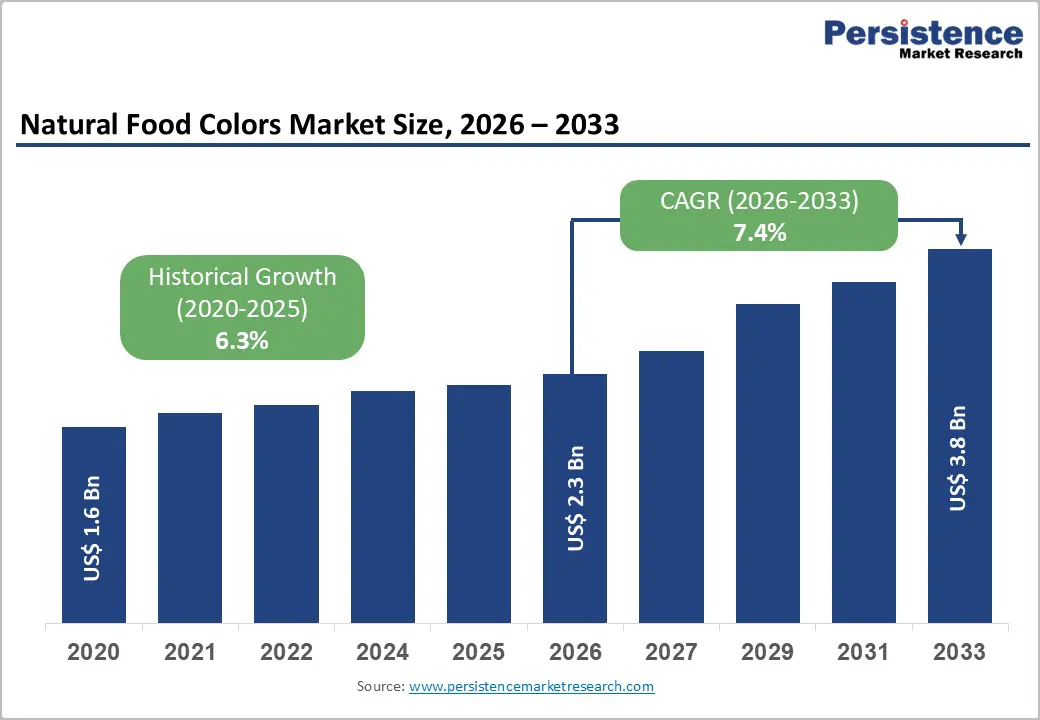
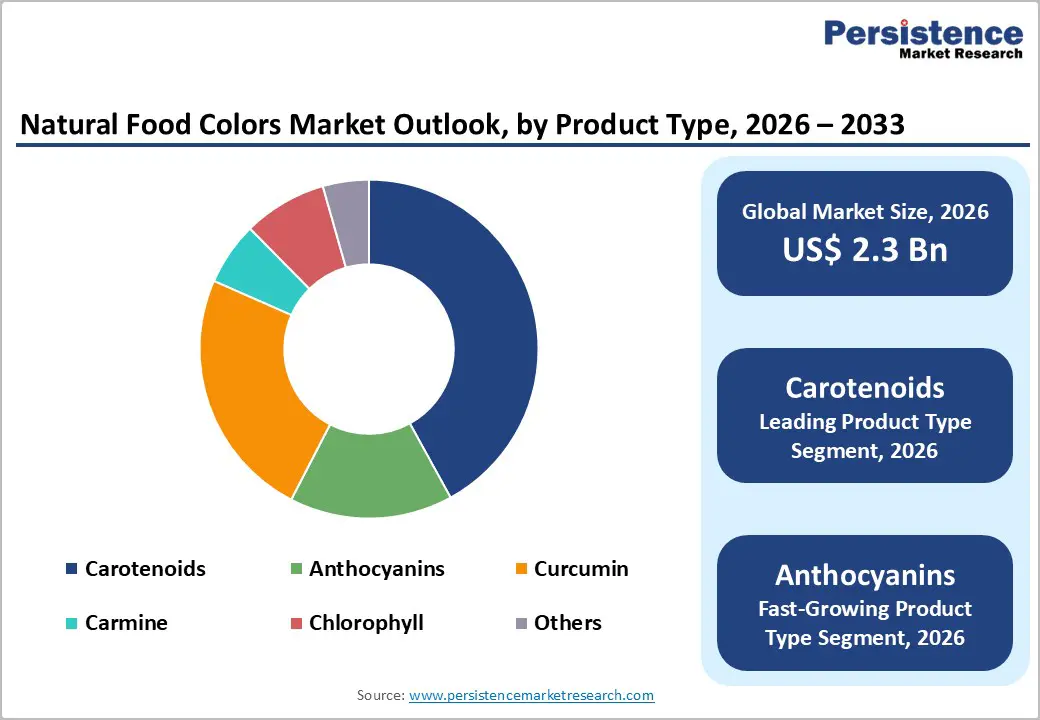
The global natural food colors market size is expected to be valued at US$ 2.3 billion in 2026 and projected to reach US$ 3.8 billion by 2033, growing at a CAGR of 7.4% between 2026 and 2033.
Natural food colors are transitioning from niche clean-label ingredients to strategic formulation tools as brands respond to regulatory pressure, ingredient transparency demands, and evolving consumer trust dynamics. Innovation in fermentation, botanical sourcing, and application-specific color systems is reshaping competitive positioning across regions and end users.
Key Industry Highlights
- Leading Region: North America, holding approximately 37% market share, driven by aggressive removal of synthetic dyes, retailer-led clean-label mandates, and strong investment in fermentation-derived and application-optimized natural color solutions.
- Fastest-Growing Region: Asia Pacific, supported by rapid adoption of packaged foods, rising preference for plant-based ingredients, local sourcing advantages, and strong regulatory encouragement for natural additives across India, China, Japan, and South Korea.
- Dominant Product Type Segment: Carotenoids, accounting for around 41% market share, favored for their formulation versatility, stability across food matrices, broad color spectrum, and compatibility with clean-label and health-positioned products.
- Fastest-Growing End-user Segment: Meat Products, propelled by reformulation away from artificial curing agents, rising clean-label processed meat demand, and increased use of natural pigments to achieve consistent visual cues in fresh and processed formats.
- Market Drivers: Growing preference for natural ingredients perceived as safer alternatives, reinforced by ingredient transparency, retailer audits, regulatory tightening, and consumer distrust of synthetic additives in everyday foods.
- Market Opportunities: Customization of color solutions for plant-based meat and dairy, enabling realistic visual transitions, allergen-free compliance, and application-specific differentiation for both established players and innovation-driven startups.
- Key Developments: In June 2025, Kraft Heinz committed to eliminating FD&C colors from its U.S. portfolio by 2027. In May 2025, the U.S. FDA approved three new natural color additives. In February 2025, Oterra expanded regional capabilities with a new blending and application center in Kerala, India.
| Key Insights | Details |
|---|---|
| Natural Food Colors Market Size (2026E) | US$ 2.3 Bn |
| Market Value Forecast (2033F) | US$ 3.8 Bn |
| Projected Growth (CAGR 2026 to 2033) | 7.4% |
| Historical Market Growth (CAGR 2020 to 2025) | 6.3% |
Market Dynamics
Driver - Growing preference for natural ingredients perceived as safer alternatives
Consumer trust is being reshaped by ingredient transparency, pushing food brands toward colors derived from recognizable botanical and microbial sources. Shoppers increasingly associate plant-based pigments with lower health risks, fewer chemical residues, and improved long-term safety, particularly in products consumed by children and health-conscious adults. This perception is accelerating reformulation efforts as manufacturers respond to scrutiny over synthetic additives, particularly in beverages, confectionery, and dairy products. Natural food colors benefit from alignment with clean-label narratives that prioritize simplicity, traceability, and minimal processing.
Regulatory tightening and retailer-led ingredient audits further reinforce this shift, prompting food producers to proactively replace artificial dyes. Natural pigments also support brand storytelling around wellness, sustainability, and authenticity. As ingredient literacy improves globally, perceived safety is evolving into a competitive differentiator, making natural food colors an essential input rather than an optional enhancement.
Restraints - Limited color spectrum & consistency
Achieving vibrant, repeatable shades remains a persistent challenge for natural food colors due to biological variability in raw materials. Pigment concentration can fluctuate with climate, harvest timing, and crop genetics, leading to batch-to-batch inconsistency. This variability complicates large-scale food production where uniform appearance is critical for brand identity, shelf appeal, and consumer trust across regions.
Functional limitations also restrict the available color range, particularly for stable blues, intense reds, and heat-resistant greens. Many natural pigments degrade under light, oxygen, or thermal processing, narrowing their applicability in baked goods, ready meals, and long shelf-life beverages. These constraints increase formulation complexity, raise production costs, and slow adoption among manufacturers seeking predictable performance at an industrial scale.
Opportunity - Formulations Customization of Color Solutions for Plant-Based Meat and Dairy
Visual realism has become central to the success of plant-based meat and dairy, creating strong demand for customized color systems that mimic animal-derived products. Natural food color suppliers are uniquely positioned to develop tailored pigment blends that replicate raw-to-cooked meat transitions, dairy whiteness, and fermented product hues. This opens space for innovation-led partnerships between ingredient developers and alternative protein brands.
Startups can compete by focusing on application-specific solutions rather than commodity pigments, using fermentation-derived colors, encapsulation, and pH-responsive systems. Customized formulations also allow alignment with allergen-free, vegan, and non-GMO requirements. As plant-based categories diversify, color customization shifts from aesthetics to functionality, enabling differentiation while supporting clean-label positioning and sensory authenticity at scale.
Category-wise Analysis
By Product Type, carotenoids dominate the global market
Carotenoids holds approx. 41% market share as of 2025, reflecting their unmatched versatility across food and beverage applications. Their stability across fat-based systems, beverages, bakery, and dairy enables broad usage without extensive reformulation. Sources such as beta-carotene, paprika, and annatto deliver vibrant yellow to red shades while supporting consumer expectations around familiar, plant-derived ingredients.
Beyond coloration, carotenoids offer added value through antioxidant associations and nutritional positioning, enhancing their appeal to health-focused brands. Their compatibility with emulsions and dry blends simplifies manufacturing integration, reducing technical risk for producers. As global demand for visually appealing yet clean-label products rises, carotenoids continue to outperform alternatives by balancing color intensity, functional reliability, and regulatory acceptance.
By End-user, Meat Products are anticipated to register strong growth during the forecast period
Meat products are projected to grow at a CAGR of 10.2% during the forecast period as processors intensify reformulation to replace artificial curing and appearance agents. Natural food colors are increasingly used to achieve consistent redness, browning effects, and cooked visual cues in fresh, processed, and ready-to-eat meat products. This shift is driven by retailer pressure, regulatory scrutiny, and evolving consumer expectations around ingredient integrity.
Rising demand for clean-label processed meats and hybrid meat products further accelerates adoption. Natural pigments derived from vegetables, fruits, and fermentation sources enable manufacturers to preserve visual appeal while aligning with simplified ingredient decks. As meat brands modernize portfolios, natural color solutions become integral to premium positioning and market differentiation.
Region-wise Insights
North America Natural Food Colors Market Trends
North America holds approximately. 37% market share in the global natural food colors market, supported by strong clean-label penetration and regulatory momentum. In the United States, food brands are actively removing synthetic dyes from beverages, snacks, and children’s products, accelerating demand for stable natural alternatives. Investment in fermentation-derived pigments and application labs is improving color performance across complex formulations.
Canada is seeing parallel momentum, with natural colors gaining traction in dairy, bakery, and plant-based foods amid stricter ingredient disclosure norms. Cross-border harmonization of labeling standards encourages wider adoption, while foodservice chains push suppliers toward naturally colored offerings. Innovation in encapsulation and processing stability continues to strengthen North America’s role as a testing ground for next-generation natural color technologies.
Asia Pacific Natural Food Colors Market Trends
Asia Pacific natural food colors market is expected to grow at a CAGR of 11.3% as regional diets evolve toward packaged and functional foods. India is witnessing rising use of turmeric, paprika, and beet-derived colors in snacks, dairy, and beverages, driven by familiarity with plant-based ingredients. Local sourcing strengthens cost competitiveness and supply security.
China is accelerating adoption through regulatory encouragement and rapid expansion of natural ingredient manufacturing. Japan emphasizes precision coloring for confectionery and beverages, favoring clean, subtle hues aligned with premium aesthetics. South Korea’s innovation-driven food sector integrates natural colors into fermented and functional products. Collectively, regional diversity supports rapid experimentation, making Asia Pacific a key growth engine for natural color suppliers.

Competitive Landscape
The global natural food colors market remains moderately consolidated, with leading players controlling core pigment technologies while regional specialists address local sourcing and application needs. Major companies focus on clean-label compliance, investing in traceable raw materials, plant-based certifications, and regulatory alignment across markets. Product innovation centers on fermentation-derived colors, stability enhancement, and region-specific flavor-color pairings.
Sustainability has become strategic, with suppliers improving water use, waste valorization, and renewable sourcing. B2B partnerships with food manufacturers enable co-development of customized solutions, while export-oriented firms adapt formulations to diverse regulatory frameworks. Government regulations increasingly shape competitive advantage, favoring companies with strong compliance infrastructure and transparent ingredient sourcing networks.
Key Developments:
- In June 2025, The Kraft Heinz Company committed to eliminating FD&C colors from its U.S. portfolio, halting new launches with synthetic dyes immediately and targeting full removal by the end of 2027, signaling a major industry shift toward natural colors.
- In May 2025, the U.S. FDA approved three new natural color additives derived from flowers, algae, and other Product Types, broadening formulation options for food manufacturers seeking clean-label alternatives.
- In February 2025, Oterra inaugurated a new color blending and application center in Kerala, strengthening its regional capabilities to support rising demand for natural color solutions across India, Asia Pacific, and the Middle East.
Companies Covered in Natural Food Colors Market
- ADM
- Sensient Technologies Corporation
- Givaudan SA
- IFF
- Symrise AG
- DSM-Firmenich AG
- Kerry Group PLC
- BASF SE
- ROHA
- Oterra A/S
- Kalsec Inc.
- Others
Frequently Asked Questions
The global natural food colors market is projected to be valued at US$ 2.3 Bn in 2026.
Growing preference for natural ingredients perceived as safer alternatives is a key driver for the global Natural Food Colors market.
The global Natural Food Colors market is poised to witness a CAGR of 7.4% between 2026 and 2033.
Formulations Customization of Color Solutions for Plant-Based Meat and Dairy is key opportunity.
Major players in the global Natural Food Colors market include ADM, Sensient Technologies Corporation, Givaudan SA, IFF, Symrise AG, DSM-Firmenich AG, Kerry Group PLC, and others.


