


- Automotive
- U.S. Golf Cart Market
U.S. Golf Cart Market Size, Share, Trends, Growth, Regional Forecasts 2026 - 2033
U.S. Golf Cart Market by Product Type (Electric Golf Carts, Gasoline Golf Carts), Seating Capacity (Small (2-4) Golf Carts, Medium (6-8) Golf Carts, Large (10+) Golf Carts), End Use (Golf Clubs, Airports, Railways, PSUs, Private Communities, Others), and Regional Analysis for 2026 to 2033
U.S. Golf Cart Market Share and Trends Analysis
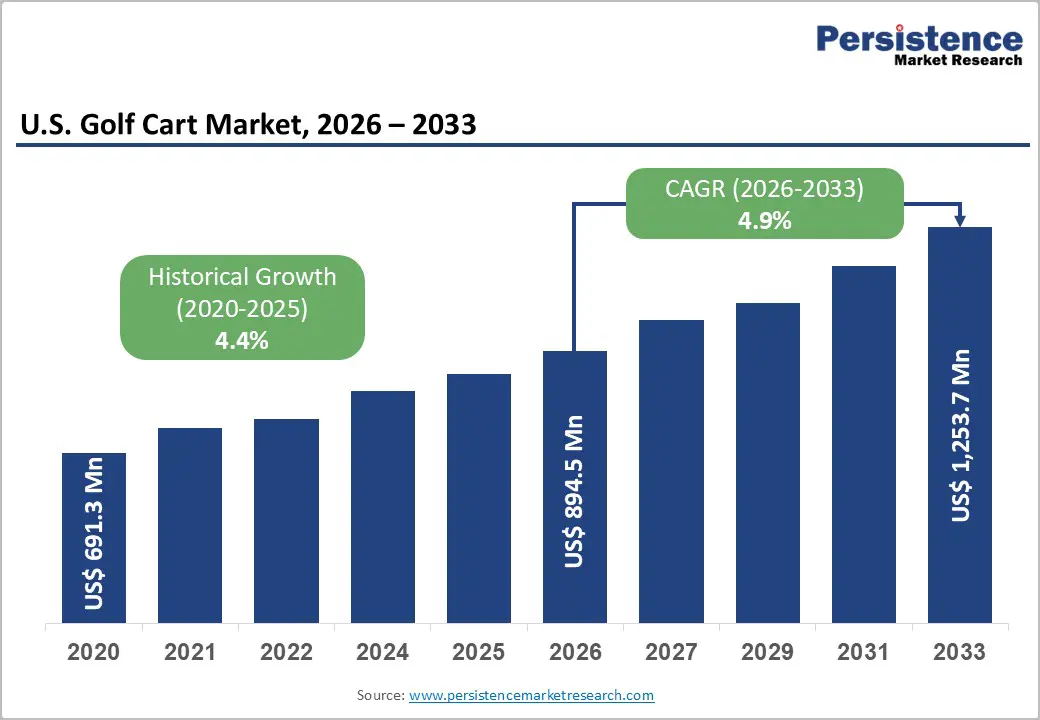
The U.S. golf cart market size is projected at US$894.5 million in 2026 and is projected to reach US$1,253.7 million by 2033, growing at a CAGR of about 4.9% between 2026 and 2033. Demand rises as golf participation expands, retirement communities and resort developments proliferate across the Southeast and Southwest.
The market also benefits from increased adoption of electric carts, driven by sustainability policies and improvements in battery technology. Non-golf uses in private communities, campuses and commercial sites further broaden the installed base and replacement demand.
Key Industry Highlights:
- Electric golf carts dominate the market, capturing around 62% share and advancing at 6%+ CAGR, while gasoline carts grow more moderately near 3.8%, highlighting the shift toward cleaner and lower-maintenance mobility.
- Small 2-4 seater carts remain the backbone of the industry, accounting for nearly 58% of demand, whereas large 10+ passenger carts are the fastest-growing segment (~5.8% CAGR) due to rising deployment across resorts, campuses, and large facilities.
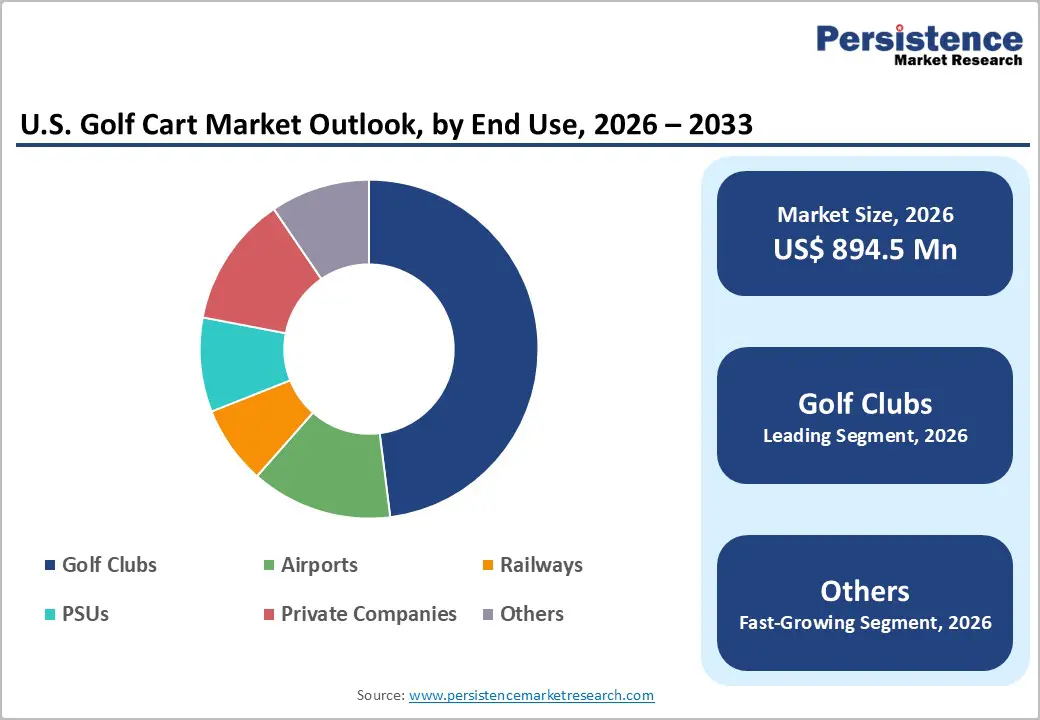
- Golf clubs remain the primary demand center, accounting for about 48% of total sales, while government and public-sector applications are gaining momentum, expanding at a roughly 6.1% CAGR.
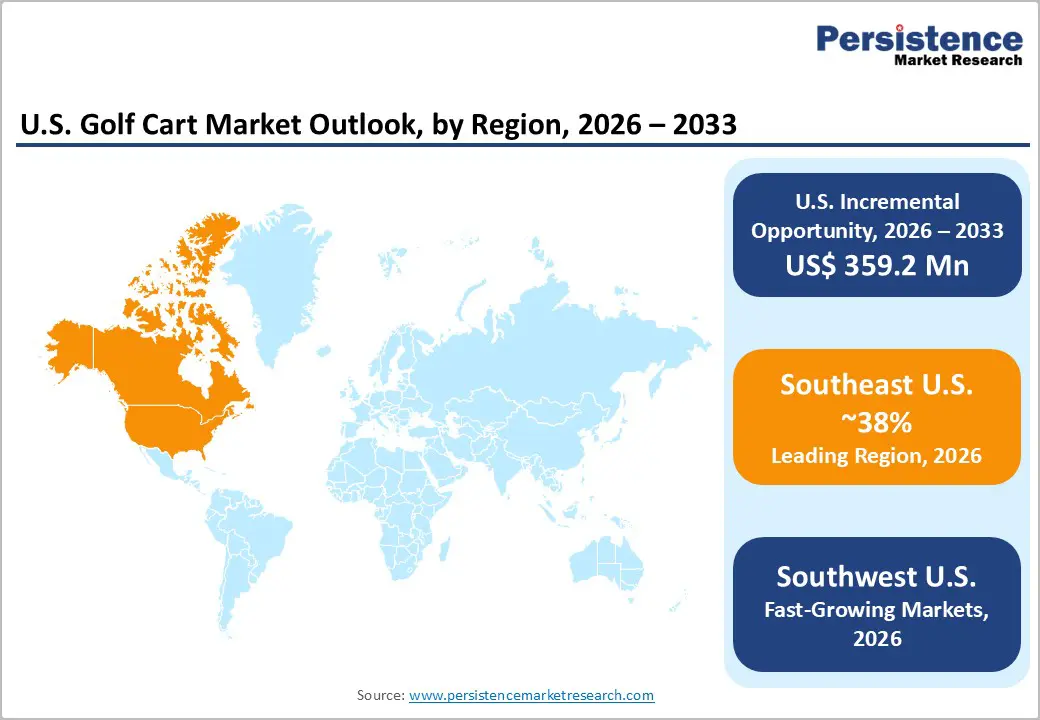
- The Southeast leads the U.S. market with nearly 38% share, supported by dense golf infrastructure and retirement communities, while the Southwest and West regions show steady growth at a CAGR of 5%+ driven by tourism and resort mobility.
- Industry innovation is accelerating, with leading OEMs introducing lithium-ion-powered fleets, telematics-enabled carts, and premium electric models since 2024, improving fleet management, performance, and the user experience.
| Key Insights | Details |
|---|---|
| U.S. Golf Cart Market Size (2026E) | US$ 894.5 million |
| Market Value Forecast (2033F) | US$ 1,253.7 million |
| Projected Growth CAGR (2026 - 2033) | 4.9% |
| Historical Market Growth (2020 - 2025) | 4.4% |
Market Dynamics Analysis
Drivers - Growing golf participation and resort-based leisure economy
The U.S. hosts more than 16,000 golf facilities, representing roughly 43% of global supply, with especially high course density in the Southeast, including Florida, Georgia, and the Carolinas. Rising tourism and resort development, along with stable membership trends in private and semi-private clubs, sustain fleet replacement cycles for carts, often every 5-7 years. This underpins steady volume growth in golf-club fleets and creates demand for higher-value, feature-rich models with GPS, connectivity, and comfort features, directly supporting the segment that already accounts for close to half of U.S. golf cart demand.
Expansion of low-speed vehicle usage beyond golf courses
Golf carts increasingly serve as neighborhood electric vehicles (NEVs) and low-speed vehicles (LSVs) in private communities, resorts, campuses, and some municipal settings where speed limits and infrastructure allow. In the Southeast, golf carts are widely used for daily mobility in retirement communities such as The Villages, highlighting their role as practical transport, not just sports equipment. This trend broadens the addressable market beyond traditional golf clubs and supports demand for customized seating layouts, street-legal features, lighting, and safety equipment, contributing to mid-single-digit annual growth for the overall U.S. golf cart market.
Restraints - Regulatory limitations on road use and safety compliance
Golf carts and LSVs must comply with federal and state regulations regarding maximum speed, lighting, seatbelts, and operation on public roads, which vary significantly across states and municipalities. In stricter jurisdictions, carts cannot access key routes, limiting their appeal as general transport. Compliance upgrades add cost, and uncertainty over future rules introduces risk for fleet operators. This regulatory fragmentation can dampen adoption in some non-golf use cases and requires manufacturers to maintain multiple specifications, increasing engineering and inventory complexity.
Exposure to discretionary spending and seasonal demand
Golf and resort spending in the U.S. is tied to consumer discretionary income and tourism flows, which can weaken during economic downturns, delaying fleet replacements or expansion projects. Seasonality in northern and Midwestern states also compresses the effective usage window, influencing purchasing behavior and financing decisions. Additionally, rising upfront prices for premium electric carts and lithium-ion battery packs may constrain smaller clubs or communities with tight budgets, potentially moderating volume growth in higher price-sensitive segments.
Opportunities - Electrification and lithium-ion upgrades across installed fleets
Retrofitting or replacing older lead-acid or gasoline fleets with lithium-ion electric carts that offer longer range, shorter charging times, and lower maintenance are poised for market growth. With electric carts already comprising most new U.S. sales and the electric segment itself projected to approach US$0.9 billion by 2033, upgrade cycles represent a multi-hundred million dollar opportunity through OEM sales and aftermarket conversions. Suppliers who bundle batteries, telematics and service contracts can capture a larger share of lifecycle value with recurring revenue.
Premiumization and customization for hospitality and private users
High-end resorts, hotels and private users increasingly demand premium carts with advanced features, including infotainment, custom body designs, enhanced seating and connectivity. This segment supports higher margins and encourages differentiation through design, technology and branding partnerships. As luxury hospitality projects expand in coastal and desert destinations, tailored fleets for guest mobility, VIP transport and on-property logistics could add an incremental, high-value niche, estimated in the tens of millions of dollars annually, particularly in the Southeast, Southwest and West.
Category-wise Analysis
Product Type Insights
Electric golf carts are the leading product type, accounting for roughly 62% of the U.S. market by value, driven by strong adoption at golf clubs, resorts and private communities seeking low-emission, low-noise mobility. The U.S. electric golf cart segment alone is projected to reach about US$886.7 million by 2033, reflecting both new purchases and fleet replacements. Gasoline carts remain relevant in demanding terrain and heavy-duty applications, but are increasingly a minority in new installations as sustainability and operating cost considerations favor electric models.
Electric golf carts are also the fastest-growing product type, with segment CAGRs around 5.6% to 6.0%, outpacing the overall U.S. golf cart market growth rate of about 4.9% between 2026 and 2033. Gasoline carts continue to grow at a more modest ~3.8% CAGR, supported by users prioritizing power and range in rural or utility-oriented settings. The combined effect reinforces a gradual mix shift toward electric fleets, particularly in the Southeast and the West U.S., where environmental and noise restrictions are stronger.
Seating Capacity Insights
Small (2-4) golf carts constitute the leading seating-capacity segment, with approximately 58% of the U.S. market share, reflecting their widespread use on golf courses, resorts, private communities, and campuses. These units offer optimal maneuverability and cost efficiency for typical two-person play and short-distance transport, making them the default choice for most fleet operators and personal users. Medium (6-8) carts serve group transport in hospitality and institutional settings, while large (10+) carts currently occupy a smaller but visible niche in high-traffic locations such as resorts and airports.
Large (10+) golf carts are the fastest-growing seating segment, expanding at an estimated ~5.8% CAGR, as resorts, hotels, campuses, and event venues seek higher-capacity shuttles to move guests efficiently. Their ability to consolidate multiple smaller trips into fewer high-capacity movements supports operational efficiency in large properties. As tourism hubs and large private communities grow, demand for 10+ seater carts for internal transit, guided tours, and event logistics is likely to outpace the average market growth rate.
End-user Insights
Golf clubs (including hotels/resorts, housing projects and other private golf facilities) form the leading end-use segment, capturing around 48% share of the U.S. golf cart market. This reflects the central role of carts in course operations, member and guest mobility, and resort experiences. The Southeast, with its high concentration of golf resorts and retirement communities, is particularly significant, while similar patterns exist in parts of the Southwest and West. Airports, railways, PSUs, and private communities collectively contribute a growing secondary demand base, especially for utility and passenger roles.
Among end uses, Others (Gov), which includes municipal, park, campus, and governmental applications, is the fastest-growing segment with an estimated ~6.1% CAGR, driven by increased deployment of low-speed electric vehicles for maintenance, security and visitor transport in public facilities. This segment benefits from federal and state sustainability goals encouraging low-emission fleets, as well as practical cost advantages versus conventional vehicles in low-speed, short-distance duty cycles. As more municipalities adopt green mobility plans, government use of golf carts and utility variants is expected to expand further.
Regional Market Insights
Southeast U.S. Golf Carts Market Trends
The Southeast U.S. holds a dominant 38% share of the U.S. Golf Cart Market, making it the largest regional cluster. States such as Florida, Georgia and the Carolinas host dense networks of golf courses, retirement communities and resort properties, all of which rely heavily on golf carts for mobility. Warm climate enabling year-round golf, strong tourism infrastructure and widespread adoption of carts as neighborhood vehicles underpin sustained demand and frequent fleet renewal. Electric carts are particularly popular due to local environmental regulations and community preferences for quiet, low-emission transport.
The Southeast is expected to maintain leadership while growing at healthy mid-single-digit rates through 2033, supported by ongoing development of master-planned communities and resort projects. Investment opportunities are robust in electric fleet upgrades, premium carts for high-end resorts, and customized solutions for large retirement communities. Regulatory environments increasingly favor sustainable vehicles, which should further accelerate the transition from gasoline to electric models in this region.
Southwest U.S. Golf Carts Market Trends
The Southwest U.S., including states such as Arizona, Nevada and Texas, is a major regional market and accounts for roughly 24% of U.S. golf cart demand. The region benefits from warm, often arid climates that support year-round golfing and outdoor leisure, leading to high cart utilization in golf clubs, resorts and gated communities. Real estate developments oriented around golf and resort living create steady demand for fleets, while rural and desert terrain support continued use of gasoline carts in certain applications.
The Southwest is growing at a robust 5.3% CAGR, outpacing some other U.S. regions as residential and hospitality projects expand. Opportunities center on mid- to high-end electric carts, multi-seater units for guest transport, and robust gasoline- or hybrid-powered models for rugged environments. As local authorities gradually promote sustainability, electric fleets are expected to gain share, particularly in upscale communities and resort corridors.
West U.S. Golf Carts Market Trends
The West U.S., led by California and other western states, accounts for approximately 12% of the U.S. golf cart market. The region emphasizes environmental sustainability and has relatively stringent air-quality and emissions regulations, which encourage adoption of electric carts across golf courses, coastal resorts and private communities. High-end hospitality assets and leisure real estate projects frequently integrate carts into guest mobility solutions, while some urban and suburban areas explore golf carts or LSVs as complementary neighborhood transport.
The West is holding about a 12% share and growing at a pace of around 5.2% CAGR in the U.S. market, supported by ongoing tourism, real estate development and green mobility initiatives. Investment opportunities include premium electric fleets for luxury resorts, street-legal carts for select municipalities, and innovative designs aligned with the region’s technology-oriented consumer base. State-level policies favoring zero-emission vehicles should further accelerate the growth of the electric segment in this region.
Competitive Landscape
Leading players in the U.S. Golf Cart Market emphasize innovation in electric powertrains and lithium-ion batteries, cost-efficient manufacturing and sourcing, and market expansion into non-golf applications such as communities and commercial campuses. Differentiation is built on performance, reliability, customization options and aftersales service. Emerging business models include fleet leasing, subscription services and digital fleet-management platforms that deepen customer relationships and generate recurring revenue streams.
Strategic Developments:
- In July 2025, Club Car, LLC introduced a lithium-ion battery option for its CRU neighborhood electric vehicle in the U.S., offering faster charging, lighter weight, longer range and lower maintenance, targeting residential communities, resorts and premium leisure mobility markets.
- In January 2024, Yamaha Motor Corporation unveiled the DRIVE H2 hydrogen-powered golf cart concept at the PGA Show in Florida, showcasing zero-CO2 hydrogen combustion technology aimed at supporting decarbonized mobility and strengthening its market expansion strategy in the U.S. golf industry.
- In January 2025, Garia Inc. expanded its U.S. portfolio with premium two-seater and street-legal golf carts featuring lithium-ion batteries, automotive-inspired interiors and extended driving range, targeting luxury residential communities, private buyers and high-end resorts seeking upscale mobility.
Companies Covered in U.S. Golf Cart Market
- Club Car, LLC
- Yamaha Golf-Car Company
- E‑Z‑GO
- Cushman
- Garia Inc.
- Polaris Industries Inc.
- Star EV Corporation
- Columbia Vehicle Group Inc.
- Bintelli LLC
- Cruise Car, Inc.
- Motocaddy / PowaKaddy
- HDK Electric Vehicles
- ICON EV
Frequently Asked Questions
The U.S. Golf Cart Market is projected at about US$894.5 million in 2026 and is expected to reach roughly US$1,253.7 million by 2033 across golf, community and commercial applications.
Market growth is driven by expanding golf and resort activity, rising adoption of electric carts in communities and campuses, and demographic shifts favoring retirement and master‑planned developments.
Between 2026 and 2033, the U.S. Golf Cart Market is expected to grow at a CAGR of around 4.9%, supported by stable demand and electrification trends.
Key opportunities lie in lithium‑ion electric fleet upgrades, growth of carts in master‑planned and retirement communities, and premium customized models for high‑end resorts and private users.
Major players include Club Car, Yamaha Golf-Car Company, E‑Z‑GO, Cushman, Garia, Polaris (GEM), Star EV, Columbia Vehicle Group, Bintelli, and Cruise Car, supported by several regional and niche manufacturers.


