


- Advanced Materials
- U.S. Geocomposites Market
U.S. Geocomposites Market Size, Share, and Growth Forecast, 2026 - 2033
U.S. Geocomposites Market by Product Type (Geonet Composites, Geomembrane Composites, Geotextile – Geogrid Composites, Geomembrane – Geogrid Composites, Other), Function (Drainage, Separation, Reinforcement, Protection /Containment, Others), Industry (Transportation Infrastructure (roads, highways, railways), Waste Management & Landfills, Mining, Water & Wastewater Management, Building & Civil Construction, Energy (oil & gas, renewables), and Others.) and Regional Analysis for 2026 - 2033
U.S. Geocomposites Market Size and Trends Analysis
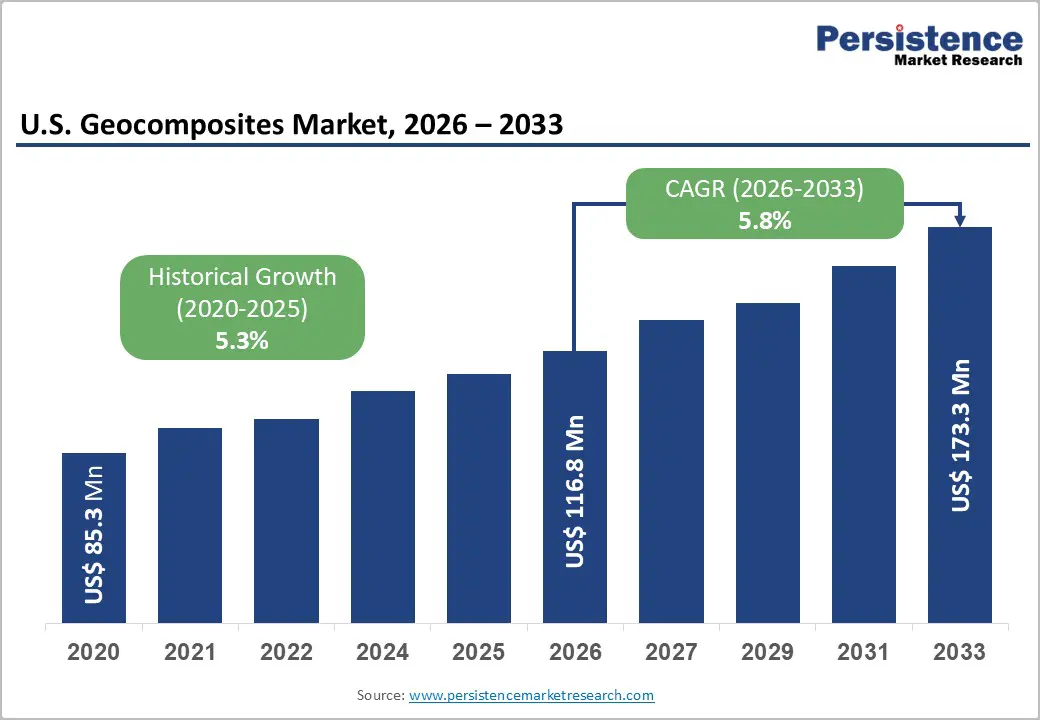
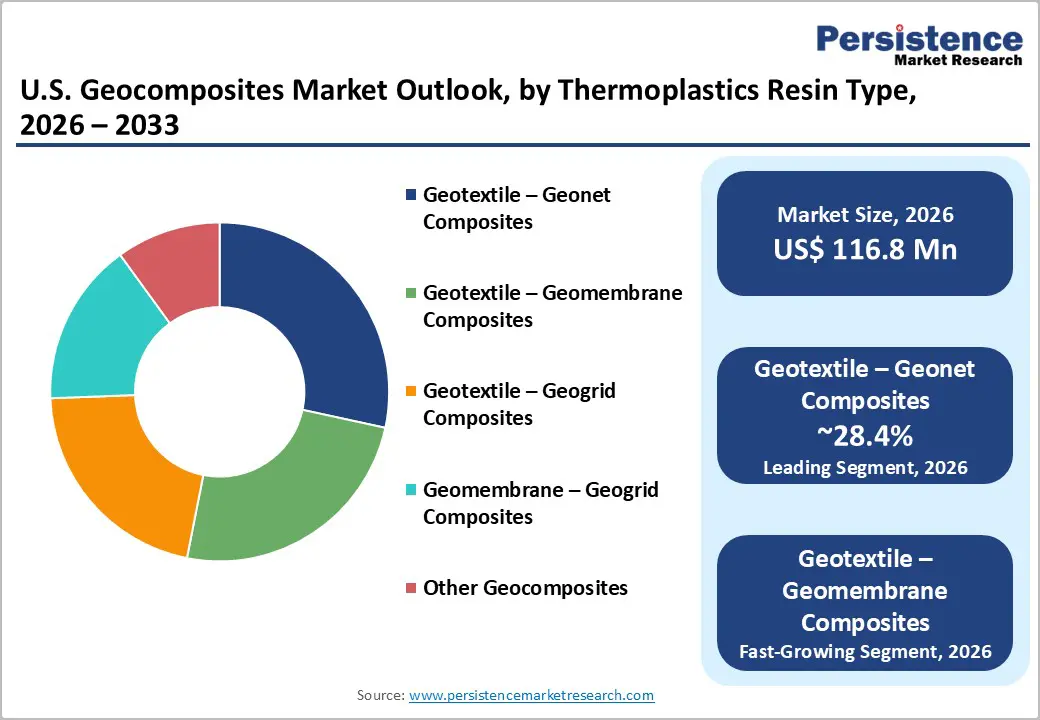
The U.S. Geocomposites Market size is likely to be valued at US$ 116.8 Million in 2026 and is projected to reach US$ 173.3 Million by 2033, growing at a CAGR of 5.8% between 2026 and 2033. This growth is anchored by the $1.2 trillion Bipartisan Infrastructure Investment and Jobs Act (IIJA), which has directed $350 billion toward highway programs and over $50 billion toward water infrastructure, generating sustained multi-year procurement demand for advanced geosynthetic solutions.
The U.S. construction sector registered total annual spending of $2.2 trillion in 2024, representing 4.5% of GDP, while the transportation system contributes $2.5 trillion to GDP, underscoring the structural scale of industries that depend on geocomposites for drainage, containment, and reinforcement. North America's geosynthetics demand reached USD 3.9 billion in 2024, with the United States accounting for over half of global geomembrane sales and remaining the dominant country-level consumer of geosynthetics.
Key Industry Highlights
- Drainage Leads Demand: The Drainage function dominates with ~34.2% market share in 2026, driven by highway subgrade, landfill leachate management, and foundation drainage applications.
- Geotextile-to-Geonet Dominance: Geotextile-to-Geonet composites account for ~28.4% of the market, serving as the standard solution for road, retaining wall, and landfill drainage applications.
- Fastest-Growing Product Segment: Geotextile-to-Geomembrane composites are expanding rapidly, driven by PFAS containment, dual-function liner systems, and industrial solid-waste applications.
- Reinforcement as Growth Engine: The Reinforcement function is the fastest-growing segment, supported by soft-ground foundations, mechanically stabilised earth (MSE) walls, and pavement base stabilisation.
- Regulatory & Sustainability Drivers: EPA mandates on landfill liners, PFAS remediation, and leachate collection are boosting speciality geocomposite adoption and compliance-driven procurement.
- Regional Infrastructure Impact: U.S. highways, bridges, railroads, and water networks, backed by IIJA and BABAA funding, drive sustained domestic demand and domestic sourcing opportunities.
- Opportunities: Integrated Drainage Systems (IDS), PFAS-protective geocomposites, and conductive leak detection products present high-value, innovation-led growth across transportation, energy, and environmental segments.
| Key Insights | Details |
|---|---|
|
U.S. Geocomposites Market Size (2026E) |
US$ 116.8 Mn |
|
Market Value Forecast (2033F) |
US$ 173.3 Mn |
|
Projected Growth (CAGR 2026 to 2033) |
5.8% |
|
Historical Market Growth (CAGR 2020 to 2025) |
5.3% |
Market Dynamics
Drivers - Federal Infrastructure Investment Channels Multi-Year Demand into Road, Bridge, and Drainage Applications
The Infrastructure Investment and Jobs Act represents the single most consequential federal policy driver for the U.S. Geocomposites Market in recent history, committing $350 billion to highway programs through the Federal Highway Administration (FHWA), with funding for roads, bridges, and erosion control applications that directly require geocomposite installations.
As of January 2024, $415 billion of total IIJA funding had been announced and directed to states, tribes, and local governments, with thousands of specific projects identified. Road construction remains the dominant application under this law, with FHWA guidance issued in August 2023 confirming that most geosynthetics are classified as construction materials for Build America, Buy America Act (BABAA) compliance purposes, directly enabling domestic geocomposite procurement.
The U.S. highway network spans over 4.19 million miles of roads, including nearly 50,000 miles of major arterials, all of which represent recurring maintenance, rehabilitation, and new construction demand. The U.S. geocomposites market benefits structurally from this pipeline through the forecast period, with highway rehabilitation projects consuming geocomposites for subgrade drainage, pavement reinforcement, and erosion management.
EPA Environmental Regulations for Landfill Containment and PFAS Control Drive Speciality Geocomposite Procurement
Environmental regulation from the U.S. Environmental Protection Agency (EPA) is a primary and enduring driver of geocomposite demand, particularly in the landfill containment, leachate collection, and PFAS remediation segments. The EPA has established strict guidelines requiring all municipal solid waste landfills to deploy advanced liner systems, with geocomposite drainage layers serving as a standard engineering solution for leachate management. Geocomposite drains collect up to 98 percent of leachate in lined landfill systems, per EPA technical studies, while managing water flow at rates 50 times faster than conventional gravel layers and reducing hydrostatic pressure by 90 percent, per ASTM D4716 standards. In 2025, EPA regulations on per- and polyfluoroalkyl substances (PFAS) intensified procurement demand for specialised geocomposite barriers, prompting HUESKER Inc. to launch its Tektoseal Active PFAS geocomposite as a direct response to this regulatory pressure.
The Infrastructure Investment and Jobs Act also allocates the single largest water investment in US history, over $50 billion for water infrastructure rehabilitation, with geocomposite-lined drainage systems integral to these projects. These interlocking environmental mandates create a durable regulatory demand floor in the U.S. geocomposites market.
U.S. Transportation and Energy Infrastructure Scale Sustains Geocomposite Applications Across Diverse End-Uses
The United States operates the world's most extensive integrated transportation system, covering 3.8 million square miles and serving 340 million residents across 132.7 million households, with over 4.19 million miles of roads, 91,000 miles of railroad, 299 ports, and an energy pipeline network comprising 83,200 miles of crude oil, 64,200 miles of petroleum products, and 300,900 miles of natural gas transmission infrastructure.
Each of these infrastructure subsystems requires geocomposites for erosion control, drainage, liner systems, and slope stabilisation at installation and during ongoing rehabilitation. The transportation sector alone contributes $2.5 trillion to GDP, 10.8% of national output, representing the scale of the asset base that generates geocomposite demand.
Energy pipelines and storage facilities require geocomposite liners for containment of hydrocarbon spills, and the pivot to resilient infrastructure under federal climate adaptation programs is further expanding the application scope for U.S. Geocomposites Market participants across energy, transportation, and coastal protection segments.
Restraint - Raw Material Price Volatility and Supply Chain Constraints Compress Manufacturer Margins
Geocomposites are manufactured from petroleum-derived polymers, including polyester, polypropylene, and high-density polyethylene, making production costs directly exposed to crude oil price cycles. Global polymer supply disruptions in 2022 and 2024 led to significant cost escalation for geosynthetics manufacturers, with the North American geosynthetics market noting pass-through challenges across the supply chain. Smaller domestic manufacturers without long-term polymer procurement contracts or vertical integration face disproportionate margin compression, constraining their ability to invest in new product development and limiting competitive capacity against larger integrated players in the U.S. Geocomposites Market.
Opportunities - PFAS Remediation and Emerging Contaminant Containment Opens a High-Value Speciality Geocomposite Segment
New regulatory mandates on PFAS and emerging contaminants are driving demand for a specialised class of geocomposites engineered to contain or neutralise these persistent pollutants. The EPA classified PFAS as hazardous substances under the Comprehensive Environmental Response, Compensation, and Liability Act (CERCLA) in 2024, triggering mandatory remediation at hundreds of contaminated sites across the U.S.
HUESKER Inc. launched the Tektoseal Active PFAS geocomposite to directly address this emerging compliance requirement, setting a commercial precedent for innovation-driven speciality geocomposite development in the U.S. Geocomposites Market. With thousands of sites identified for PFAS remediation, including military bases, airports, and industrial facilities and the EPA issuing maximum contaminant levels for six PFAS compounds in drinking water sources in April 2024, the containment infrastructure opportunity for geocomposite manufacturers with validated PFAS-barrier performance is structurally large, compliance-driven, and long-duration, with limited substitutes available at the required performance specifications.
Electric Leak Detection Geocomposites Address a Critical Liner Integrity Monitoring Gap
Leak detection in geomembrane-lined containment systems has historically relied on costly and logistically complex electrical inspection processes that require temporary power installations and specialised crews. Conductive geocomposites that integrate the leak detection function directly into the liner system represent a transformative simplification of containment integrity monitoring.
SKAPS Industries and Layfield Geosynthetics jointly launched GeoVolt, a patented conductive geocomposite that combines a conductive film with a needle-punched nonwoven geotextile, enabling continuous electrical leak detection as an inherent product feature rather than an add-on inspection service. This innovation directly addresses a structural engineering and compliance gap in landfill and industrial containment applications regulated under EPA liner system requirements. For the U.S. Geocomposites Market, the commercialisation of conductive geocomposites represents a premium product tier with superior margins and defensible differentiation, reducing customers' total cost of ownership through integrated liner integrity management while meeting increasingly stringent regulatory leak-detection protocols.
Integrated Drainage System Geocomposites Replace Conventional Aggregate Layers Across High-Value Infrastructure Projects
Conventional aggregate drainage layers in road, rail, and structural foundation applications require significant material volumes, extended installation times, and ongoing maintenance, creating a compelling total cost of ownership case for prefabricated geocomposite drainage systems that eliminate aggregate. The technical performance advantages are substantial: geocomposite drains deploy 405 faster than gravel layers, reduce labour costs by 30%, and provide drainage flow capacities 50 times greater than conventional gravel, per BPM Geosynthetics technical data referencing ASTM D4716 testing.
AGRU America advanced its proprietary Integrated Drainage System (IDS) geocomposite specifically to replace traditional soil and aggregate drainage layers, demonstrating improved shear strength, enhanced long-term drainage performance, and reduced installation costs across infrastructure applications. With the IIJA committing $350 billion to highway programs and the U.S. housing market delivering 1.6 million new homes in 2024, generating foundation drainage demand, the addressable volume for drainage geocomposites in the U.S. Geocomposites Market is broad and capital-program-backed. Manufacturers who can document ASTM-compliant performance data and meet BABAA domestic content requirements are well-positioned to capture specification-led premium volume in this segment.
Category-wise Analysis
Product Type Insights
Geotextile-to-Geonet Composites leads the product type segment, accounting for approximately 28.4% of U.S. market revenue in 2026. These composites serve as the technical workhorse of landfill leachate collection, road subgrade drainage, and retaining wall drainage applications, combining the filtration capability of a geotextile with the in-plane drainage capacity of a geonet to deliver performance that neither component achieves individually. The drainage flow rates achievable up to 1.0 liters per meter per second make them the standard engineering solution in lined landfill systems, where EPA regulations mandate effective leachate collection. Industry leaders, including Tensar International and GSE Environmental, have sustained investment in innovation for geonet composite performance, with GSE expanding its Kingstree, South Carolina, manufacturing line specifically for biplanar and triplanar geocomposites to serve EPA coal ash regulation-driven demand.
Geotextile-to-Geomembrane Composites is the fastest-growing product type in the U.S. Geocomposites Market. This product category addresses the dual need for liquid containment and mechanical protection in a single pre-integrated layer, reducing installation complexity and eliminating interface compatibility issues between separately installed geomembranes and geotextile protection layers. The PFAS regulatory agenda and the expansion of industrial solid waste containment requirements under EPA RCRA regulations are driving sustained demand for composite liner systems. The launch of HUESKER's Tektoseal Active PFAS and similar innovation-led products confirms that this segment is evolving beyond commodity to speciality performance grades, commanding premium pricing and supporting higher revenue per unit area installed.
Function Insights
The Drainage function holds the leading position in the function segment, accounting for approximately 34.2% of market revenue in 2026. Drainage is the most extensively specified geocomposite function across road infrastructure, landfill leachate management, foundation drainage, and slope stabilisation applications, reflecting both the scale of the U.S. transportation system and the regulatory requirements for managed subsurface water in waste containment facilities. Geocomposite drainage systems manage hydrostatic pressure with flow capacities 50 times greater than conventional gravel, per ASTM D4716 benchmarks, enabling cost-competitive replacement of aggregate in high-traffic civil infrastructure. The IIJA's $350 billion commitment to highway programs directly supports long-term procurement of drainage geocomposites as road rehabilitation and new construction proceed over the forecast period.
The reinforcement function is the fastest-growing segment in the U.S. Geocomposites Market. Geotextile to geogrid composites used for reinforcement deliver load transfer to surrounding soil, reducing foundation settlement by up to 40% in multi-layered innovative designs, per TenCate Geosynthetics technical data. With 1.6 million new homes built in the U.S. in 2024 and large-scale commercial and industrial construction proceeding under the IIJA pipeline, reinforcement geocomposites are increasingly being specified for soft ground foundations, mechanically stabilised earth (MSE) walls, and pavement bases. Regulatory emphasis on resilient infrastructure design standards, particularly in coastal and flood-prone regions under federal climate adaptation programs, is further reinforcing specification adoption of geocomposite reinforcement over conventional granular alternatives.
Competitive Landscape
The U.S. Geocomposites Market is moderately consolidated, with several leading players holding significant market influence while numerous regional and niche manufacturers contribute to a competitive landscape. Key companies such as TenCate Geosynthetics Americas, GSE Environmental, Tensar International Corporation, Solmax International Inc., NAUE GmbH & Co. KG, and AGRU America, Inc. dominate through extensive product portfolios, strong distribution networks, and innovation in geocomposite solutions for drainage, reinforcement, and filtration applications.
These major players focus on R&D, strategic partnerships, and regional expansions to strengthen their market positions and develop technologically advanced products tailored to U.S. infrastructure, transportation, and environmental projects. At the same time, smaller and regional suppliers like SKAPS Industries, HUESKER Inc., and TYPAR Geosynthetics create healthy competition by offering specialised solutions and localised services, particularly in landfill lining, erosion control, and drainage systems.
The market’s competitive dynamics are further shaped by mergers, acquisitions, and localised manufacturing, which help companies optimise supply chains and meet growing demand for high-performance geocomposites. While the leading firms maintain a strong presence, the fragmented nature of the smaller players ensures continuous innovation, price competitiveness, and tailored solutions for niche applications.
Key Industry Developments:
- GSE Environmental expanded its U.S. manufacturing capacity with a new geonet and geocomposite production line at its Kingstree, South Carolina, facility. The new line supports biplanar and triplanar geonets and geocomposites, enabling faster and more cost-effective delivery to high-demand regions in the U.S., particularly in response to EPA coal ash regulations. Mark Leigh, President of the Americas at GSE, emphasised that the expansion ensures product availability during peak demand and strengthens the company’s service to U.S. infrastructure and environmental projects.
Companies Covered in U.S. Geocomposites Market
- TenCate Geosynthetics Americas
- GSE Environmental
- SKAPS Industries
- Leggett & Platt, Inc.
- AGRU America, Inc.
- Strata Systems, Inc.
- American Wick Drain
- TYPAR Geosynthetics
Frequently Asked Questions
The U.S. Geocomposites Market is projected to be valued at US$ 116.8 Mn in 2026.
The Geotextile – Geonet Composites segment is expected to account for approximately 28.4% of the U.S. Geocomposites Market by Product Type in 2026.
The market is expected to witness a CAGR of 5.8% from 2026 to 2033.
The U.S. Geocomposites Market growth is driven by federal infrastructure investment under the IIJA and BABAA, expansive highway and water networks, EPA regulations on landfill containment and PFAS remediation, and the extensive U.S. transportation and energy infrastructure requiring drainage, reinforcement, and erosion control solutions.
Key market opportunities in the U.S. Geocomposites Market lie in PFAS and emerging contaminant remediation, conductive leak-detection geocomposites, and Integrated Drainage System (IDS) solutions that replace conventional aggregate layers in high-value infrastructure projects.


