


- Executive Summary
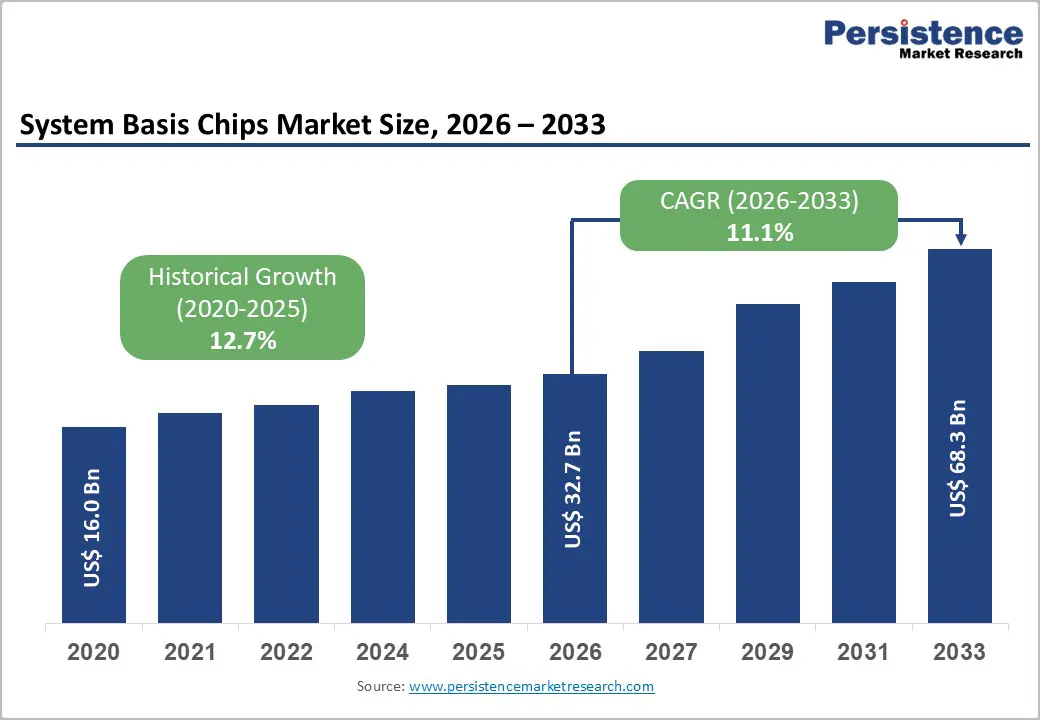
- Global System Basis Chips Market Snapshot 2026 and 2033
- Market Opportunity Assessment, 2026 - 2033, US$ Bn
- Key Market Trends
- Industry Developments and Key Market Events
- Demand Side and Supply Side Analysis
- PMR Analysis and Recommendations
- Market Overview
- Market Scope and Definitions
- Value Chain Analysis
- Macro-Economic Factors
- Global GDP Outlook
- Global Prison Growth Outlook
- Global Crime Rates by Country
- Global Prison Population by Country
- Global Private Prison Market Growth Outlook
- Forecast Factors - Relevance and Impact
- COVID-19 Impact Assessment
- PESTLE Analysis
- Porter's Five Forces Analysis
- Geopolitical Tensions: Market Impact
- Regulatory and Technology Landscape
- Market Dynamics
- Drivers
- Restraints
- Opportunities
- Trends
- Price Trend Analysis, 2020 - 2033
- Region-wise Price Analysis
- Price by Segments
- Price Impact Factors
- Global System Basis Chips Market Outlook: Historical (2020 - 2025) and Forecast (2026 - 2033)
- Key Highlights
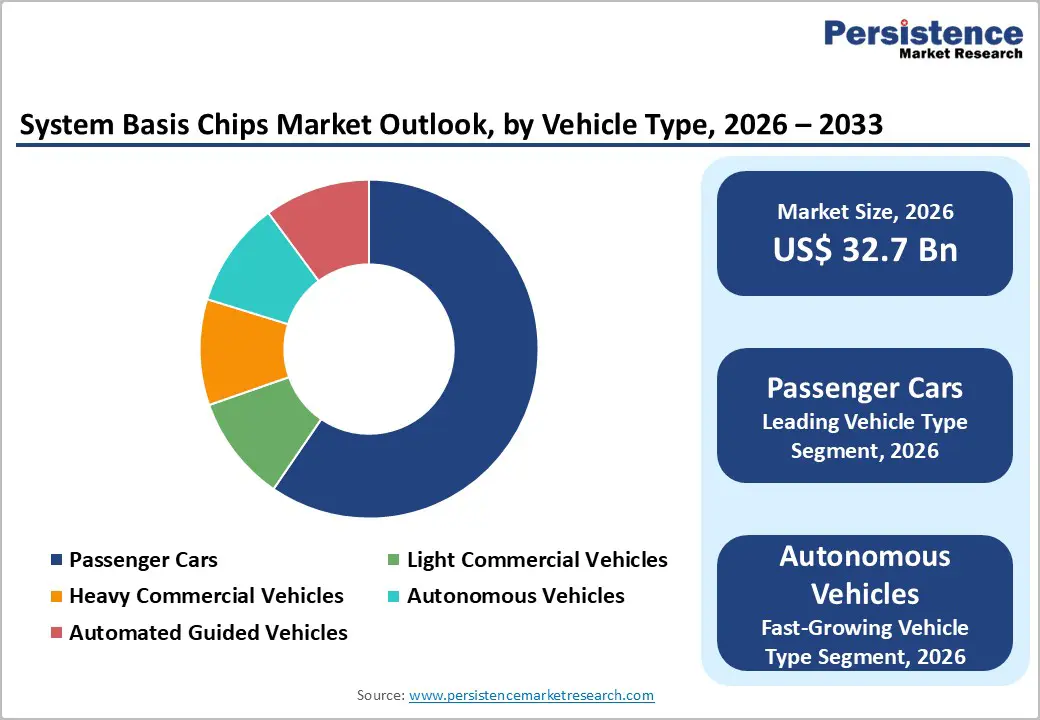
- Global System Basis Chips Market Outlook: Vehicle Type
- Introduction/Key Findings
- Historical Market Size (US$ Bn) Analysis by Vehicle Type, 2020-2025
- Current Market Size (US$ Bn) Forecast, by Vehicle Type, 2026-2033
- Passenger Cars
- Light Commercial Vehicles
- Heavy Commercial Vehicles
- Autonomous Vehicles
- Automated Guided Vehicles
- Market Attractiveness Analysis: Vehicle Type
- Global System Basis Chips Market Outlook: Application
- Introduction/Key Findings
- Historical Market Size (US$ Bn) Analysis by Application, 2020-2025
- Current Market Size (US$ Bn) Forecast, by Application, 2026-2033
- Power Train
- Engine Control Module
- Hev/Ev Motor
- Transmission
- Safety
- Airbags
- Electronic Stability Control
- Adaptive Cruise Control
- Night Vision
- Tire Pressure Monitoring System
- Parking Assistance
- Body Electronics
- Body Control Modules
- Door Control Unit
- Led Lighting
- Mirror & Window Control
- Hvac System
- Chassis
- Brake Control Module
- Steering Control Module
- Suspension Control Module
- Traction Control Module
- Vehicle Dynamics Management
- Telematics & Infotainment
- Power Train
- Market Attractiveness Analysis: Application
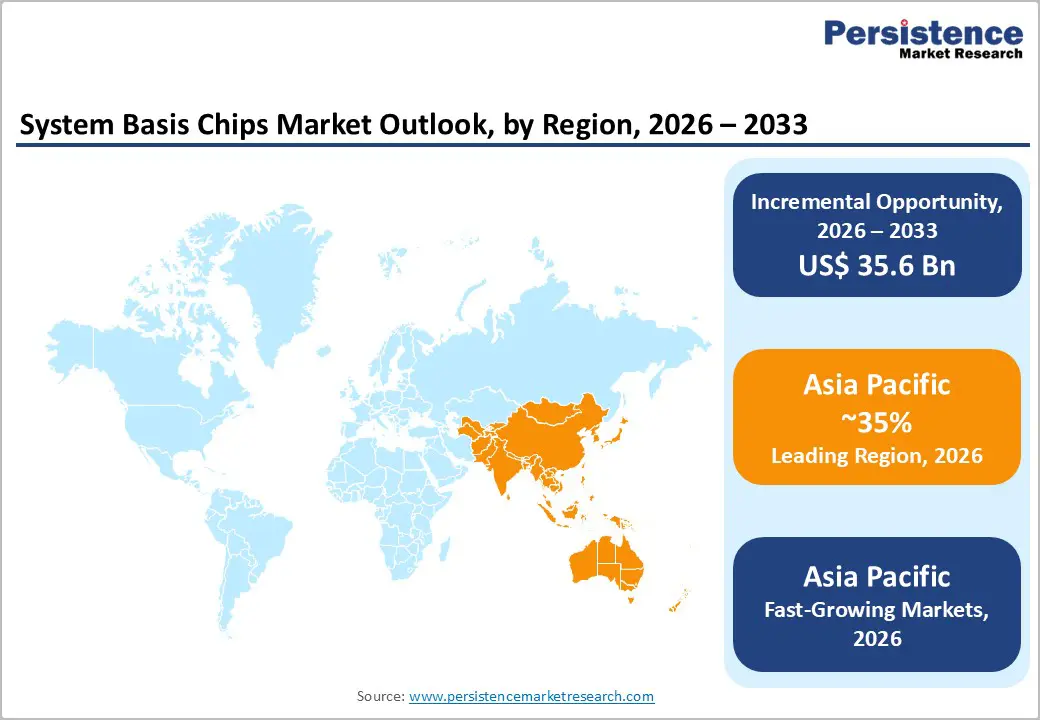
- Global System Basis Chips Market Outlook: Region
- Key Highlights
- Historical Market Size (US$ Bn) Analysis by Region, 2020-2025
- Current Market Size (US$ Bn) Forecast, by Region, 2026-2033
- North America
- Europe
- East Asia
- South Asia & Oceania
- Latin America
- Middle East & Africa
- Market Attractiveness Analysis: Region
- North America System Basis Chips Market Outlook: Historical (2020 - 2025) and Forecast (2026 - 2033)
- Key Highlights
- Pricing Analysis
- North America Market Size (US$ Bn) Forecast, by Country, 2026-2033
- U.S.
- Canada
- North America Market Size (US$ Bn) Forecast, by Vehicle Type, 2026-2033
- Passenger Cars
- Light Commercial Vehicles
- Heavy Commercial Vehicles
- Autonomous Vehicles
- Automated Guided Vehicles
- North America Market Size (US$ Bn) Forecast, by Application, 2026-2033
- Power Train
- Engine Control Module
- Hev/Ev Motor
- Transmission
- Safety
- Airbags
- Electronic Stability Control
- Adaptive Cruise Control
- Night Vision
- Tire Pressure Monitoring System
- Parking Assistance
- Body Electronics
- Body Control Modules
- Door Control Unit
- Led Lighting
- Mirror & Window Control
- Hvac System
- Chassis
- Brake Control Module
- Steering Control Module
- Suspension Control Module
- Traction Control Module
- Vehicle Dynamics Management
- Telematics & Infotainment
- Power Train
- Europe System Basis Chips Market Outlook: Historical (2020 - 2025) and Forecast (2026 - 2033)
- Key Highlights
- Pricing Analysis
- Europe Market Size (US$ Bn) Forecast, by Country, 2026-2033
- Germany
- Italy
- France
- U.K.
- Spain
- Russia
- Rest of Europe
- Europe Market Size (US$ Bn) Forecast, by Vehicle Type, 2026-2033
- Passenger Cars
- Light Commercial Vehicles
- Heavy Commercial Vehicles
- Autonomous Vehicles
- Automated Guided Vehicles
- Europe Market Size (US$ Bn) Forecast, by Application, 2026-2033
- Power Train
- Engine Control Module
- Hev/Ev Motor
- Transmission
- Safety
- Airbags
- Electronic Stability Control
- Adaptive Cruise Control
- Night Vision
- Tire Pressure Monitoring System
- Parking Assistance
- Body Electronics
- Body Control Modules
- Door Control Unit
- Led Lighting
- Mirror & Window Control
- Hvac System
- Chassis
- Brake Control Module
- Steering Control Module
- Suspension Control Module
- Traction Control Module
- Vehicle Dynamics Management
- Telematics & Infotainment
- Power Train
- East Asia System Basis Chips Market Outlook: Historical (2020 - 2025) and Forecast (2026 - 2033)
- Key Highlights
- Pricing Analysis
- East Asia Market Size (US$ Bn) Forecast, by Country, 2026-2033
- China
- Japan
- South Korea
- East Asia Market Size (US$ Bn) Forecast, by Vehicle Type, 2026-2033
- Passenger Cars
- Light Commercial Vehicles
- Heavy Commercial Vehicles
- Autonomous Vehicles
- Automated Guided Vehicles
- East Asia Market Size (US$ Bn) Forecast, by Application, 2026-2033
- Power Train
- Engine Control Module
- Hev/Ev Motor
- Transmission
- Safety
- Airbags
- Electronic Stability Control
- Adaptive Cruise Control
- Night Vision
- Tire Pressure Monitoring System
- Parking Assistance
- Body Electronics
- Body Control Modules
- Door Control Unit
- Led Lighting
- Mirror & Window Control
- Hvac System
- Chassis
- Brake Control Module
- Steering Control Module
- Suspension Control Module
- Traction Control Module
- Vehicle Dynamics Management
- Telematics & Infotainment
- Power Train
- South Asia & Oceania System Basis Chips Market Outlook: Historical (2020 - 2025) and Forecast (2026 - 2033)
- Key Highlights
- Pricing Analysis
- South Asia & Oceania Market Size (US$ Bn) Forecast, by Country, 2026-2033
- India
- Southeast Asia
- ANZ
- Rest of SAO
- South Asia & Oceania Market Size (US$ Bn) Forecast, by Vehicle Type, 2026-2033
- Passenger Cars
- Light Commercial Vehicles
- Heavy Commercial Vehicles
- Autonomous Vehicles
- Automated Guided Vehicles
- South Asia & Oceania Market Size (US$ Bn) Forecast, by Application, 2026-2033
- Power Train
- Engine Control Module
- Hev/Ev Motor
- Transmission
- Safety
- Airbags
- Electronic Stability Control
- Adaptive Cruise Control
- Night Vision
- Tire Pressure Monitoring System
- Parking Assistance
- Body Electronics
- Body Control Modules
- Door Control Unit
- Led Lighting
- Mirror & Window Control
- Hvac System
- Chassis
- Brake Control Module
- Steering Control Module
- Suspension Control Module
- Traction Control Module
- Vehicle Dynamics Management
- Telematics & Infotainment
- Power Train
- Latin America System Basis Chips Market Outlook: Historical (2020 - 2025) and Forecast (2026 - 2033)
- Key Highlights
- Pricing Analysis
- Latin America Market Size (US$ Bn) Forecast, by Country, 2026-2033
- Brazil
- Mexico
- Rest of LATAM
- Latin America Market Size (US$ Bn) Forecast, by Vehicle Type, 2026-2033
- Passenger Cars
- Light Commercial Vehicles
- Heavy Commercial Vehicles
- Autonomous Vehicles
- Automated Guided Vehicles
- Latin America Market Size (US$ Bn) Forecast, by Application, 2026-2033
- Power Train
- Engine Control Module
- Hev/Ev Motor
- Transmission
- Safety
- Airbags
- Electronic Stability Control
- Adaptive Cruise Control
- Night Vision
- Tire Pressure Monitoring System
- Parking Assistance
- Body Electronics
- Body Control Modules
- Door Control Unit
- Led Lighting
- Mirror & Window Control
- Hvac System
- Chassis
- Brake Control Module
- Steering Control Module
- Suspension Control Module
- Traction Control Module
- Vehicle Dynamics Management
- Telematics & Infotainment
- Power Train
- Middle East & Africa System Basis Chips Market Outlook: Historical (2020 - 2025) and Forecast (2026 - 2033)
- Key Highlights
- Pricing Analysis
- Middle East & Africa Market Size (US$ Bn) Forecast, by Country, 2026-2033
- GCC Countries
- South Africa
- Northern Africa
- Rest of MEA
- Middle East & Africa Market Size (US$ Bn) Forecast, by Vehicle Type, 2026-2033
- Passenger Cars
- Light Commercial Vehicles
- Heavy Commercial Vehicles
- Autonomous Vehicles
- Automated Guided Vehicles
- Middle East & Africa Market Size (US$ Bn) Forecast, by Application, 2026-2033
- Power Train
- Engine Control Module
- Hev/Ev Motor
- Transmission
- Safety
- Airbags
- Electronic Stability Control
- Adaptive Cruise Control
- Night Vision
- Tire Pressure Monitoring System
- Parking Assistance
- Body Electronics
- Body Control Modules
- Door Control Unit
- Led Lighting
- Mirror & Window Control
- Hvac System
- Chassis
- Brake Control Module
- Steering Control Module
- Suspension Control Module
- Traction Control Module
- Vehicle Dynamics Management
- Telematics & Infotainment
- Power Train
- Competition Landscape
- Market Share Analysis, 2025
- Market Structure
- Competition Intensity Mapping
- Competition Dashboard
- Company Profiles
- NXP Semiconductors N.V.
- Company Overview
- Product Portfolio/Offerings
- Key Financials
- SWOT Analysis
- Company Strategy and Key Developments
- Infineon Technologies
- Texas Instruments Incorporated
- Robert Bosch GmbH
- STMicroelectronics N.V.
- Onsemiconductor Corp.
- Microchip Technology
- Melexis N.V.
- Elmos Semiconductor AG.
- Renesas Electronics Corporation
- Rohm Co. Ltd.
- Denso Corporation
- NXP Semiconductors N.V.
- Appendix
- Research Methodology
- Research Assumptions
- Acronyms and Abbreviations

Loading page data
Please wait a moment


