


- Executive Summary
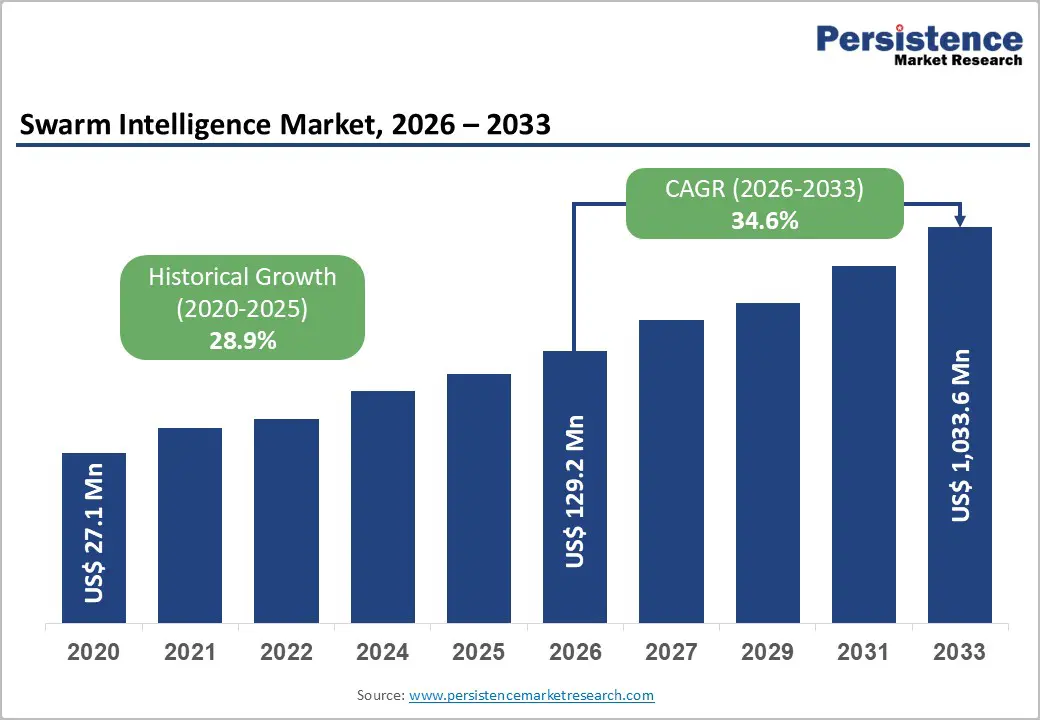
- Global Swarm Intelligence Market Snapshot 2026 and 2033
- Market Opportunity Assessment, 2026-2033, US$ Bn
- Key Market Trends
- Industry Developments and Key Market Events
- Demand Side and Supply Side Analysis
- PMR Analysis and Recommendations
- Market Overview
- Market Scope and Definitions
- Value Chain Analysis
- Macro-Economic Factors
- Global GDP Outlook
- Technology Investment Cycles
- Government R&D Spending
- Infrastructure Investment
- Adoption of Automation & AI
- Forecast Factors – Relevance and Impact
- COVID-19 Impact Assessment
- PESTLE Analysis
- Porter's Five Forces Analysis
- Geopolitical Tensions: Market Impact
- Regulatory and Technology Landscape
- Market Dynamics
- Drivers
- Restraints
- Opportunities
- Trends
- Price Trend Analysis
- Price by Model
- Price Impact Factors
- Global Swarm Intelligence Market Outlook: Historical (2020 – 2025) and Forecast (2026 – 2033)
- Key Highlights
- Global Swarm Intelligence Market Outlook: Model
- Introduction/Key Findings
- Historical Market Size (US$ Bn) Analysis by Model, 2020-2025
- Current Market Size (US$ Bn) Forecast, by Model, 2026-2033
- Ant Colony Optimization
- Particle Swarm Optimization
- Others
- Market Attractiveness Analysis: Model
- Global Swarm Intelligence Market Outlook: Capability
- Introduction/Key Findings
- Historical Market Size (US$ Bn) Analysis by Capability, 2020-2025
- Current Market Size (US$ Bn) Forecast, by Capability, 2026-2033
- Optimization
- Clustering
- Scheduling
- Routing
- Others
- Market Attractiveness Analysis: Capability
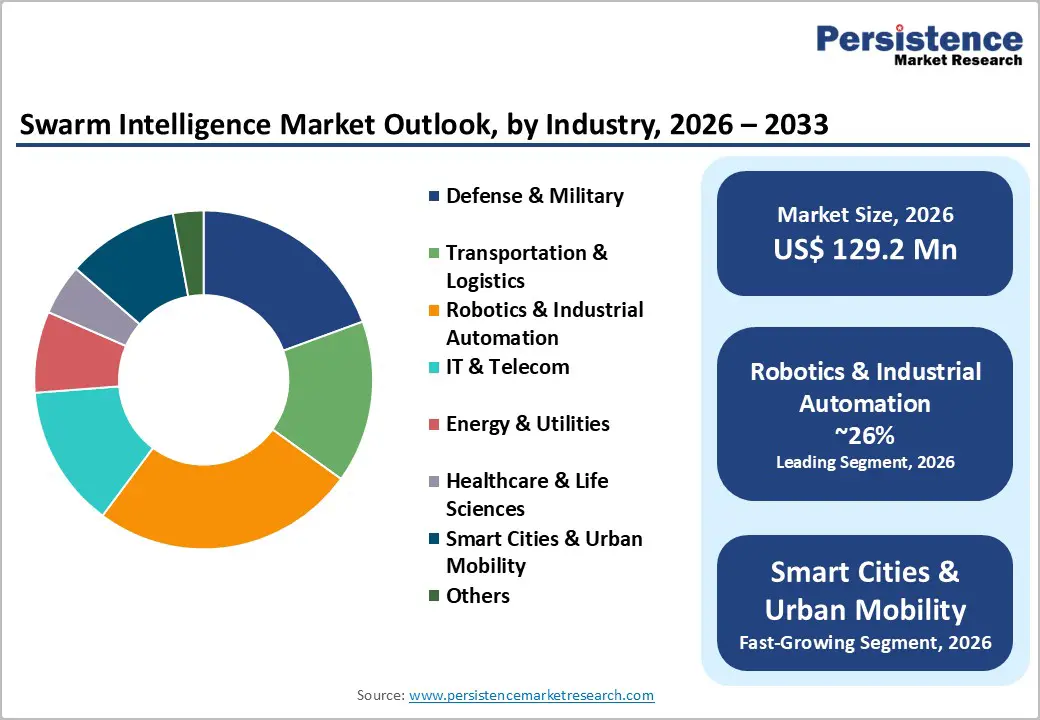
- Global Swarm Intelligence Market Outlook: Industry
- Introduction/Key Findings
- Historical Market Size (US$ Bn) Analysis by Industry, 2020-2025
- Current Market Size (US$ Bn) Forecast, by Industry, 2026-2033
- Defense & Military
- Transportation & Logistics
- Robotics & Industrial Automation
- IT & Telecom
- Energy & Utilities
- Healthcare & Life Sciences
- Smart Cities & Urban Mobility
- Others
- Market Attractiveness Analysis: Industry
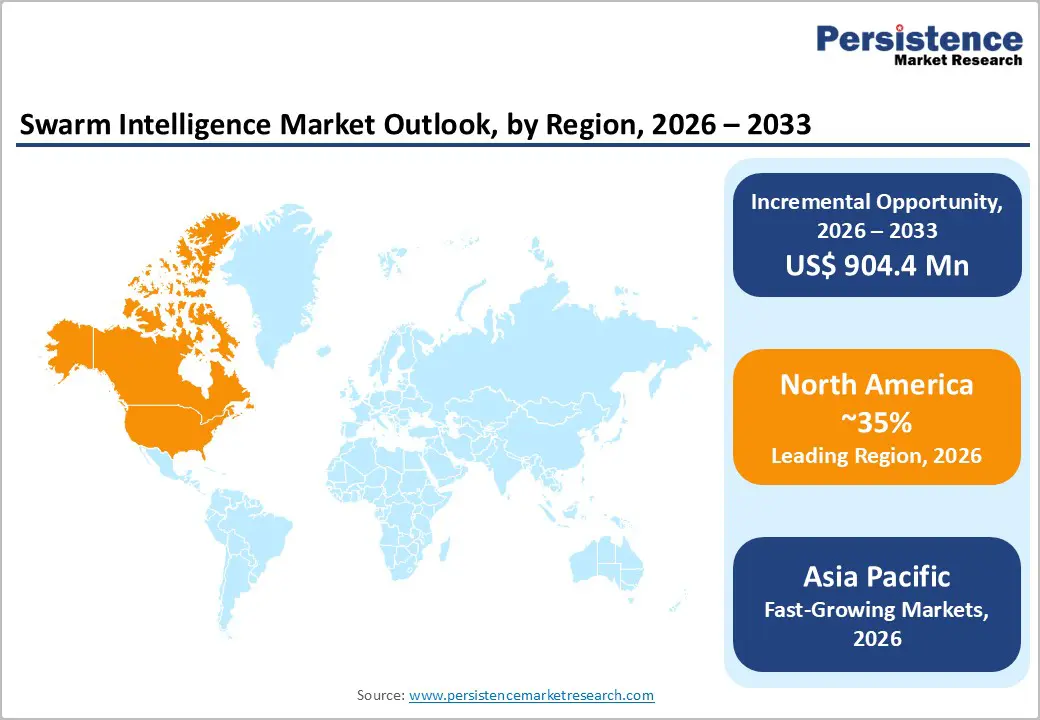
- Global Swarm Intelligence Market Outlook: Region
- Key Highlights
- Historical Market Size (US$ Bn) Analysis by Region, 2020-2025
- Current Market Size (US$ Bn) Forecast, by Region, 2026-2033
- North America
- Europe
- East Asia
- South Asia & Oceania
- Latin America
- Middle East & Africa
- Market Attractiveness Analysis: Region
- North America Swarm Intelligence Market Outlook: Historical (2020 – 2025) and Forecast (2026 – 2033)
- Key Highlights
- North America Market Size (US$ Bn) Forecast, by Country, 2026-2033
- U.S.
- Canada
- North America Market Size (US$ Bn) Forecast, by Model, 2026-2033
- Ant Colony Optimization
- Particle Swarm Optimization
- Others
- North America Market Size (US$ Bn) Forecast, by Capability, 2026-2033
- Optimization
- Clustering
- Scheduling
- Routing
- Others
- North America Market Size (US$ Bn) Forecast, by Industry, 2026-2033
- Defense & Military
- Transportation & Logistics
- Robotics & Industrial Automation
- IT & Telecom
- Energy & Utilities
- Healthcare & Life Sciences
- Smart Cities & Urban Mobility
- Others
- Europe Swarm Intelligence Market Outlook: Historical (2020 – 2025) and Forecast (2026 – 2033)
- Key Highlights
- Europe Market Size (US$ Bn) Forecast, by Country, 2026-2033
- Germany
- Italy
- France
- U.K.
- Spain
- Russia
- Rest of Europe
- Europe Market Size (US$ Bn) Forecast, by Model, 2026-2033
- Ant Colony Optimization
- Particle Swarm Optimization
- Others
- Europe Market Size (US$ Bn) Forecast, by Capability, 2026-2033
- Optimization
- Clustering
- Scheduling
- Routing
- Others
- Europe Market Size (US$ Bn) Forecast, by Industry, 2026-2033
- Defense & Military
- Transportation & Logistics
- Robotics & Industrial Automation
- IT & Telecom
- Energy & Utilities
- Healthcare & Life Sciences
- Smart Cities & Urban Mobility
- Others
- East Asia Swarm Intelligence Market Outlook: Historical (2020 – 2025) and Forecast (2026 – 2033)
- Key Highlights
- East Asia Market Size (US$ Bn) Forecast, by Country, 2026-2033
- China
- Japan
- South Korea
- East Asia Market Size (US$ Bn) Forecast, by Model, 2026-2033
- Ant Colony Optimization
- Particle Swarm Optimization
- Others
- East Asia Market Size (US$ Bn) Forecast, by Capability, 2026-2033
- Optimization
- Clustering
- Scheduling
- Routing
- Others
- East Asia Market Size (US$ Bn) Forecast, by Industry, 2026-2033
- Defense & Military
- Transportation & Logistics
- Robotics & Industrial Automation
- IT & Telecom
- Energy & Utilities
- Healthcare & Life Sciences
- Smart Cities & Urban Mobility
- Others
- South Asia & Oceania Swarm Intelligence Market Outlook: Historical (2020 – 2025) and Forecast (2026 – 2033)
- Key Highlights
- South Asia & Oceania Market Size (US$ Bn) Forecast, by Country, 2026-2033
- India
- Southeast Asia
- ANZ
- Rest of SAO
- South Asia & Oceania Market Size (US$ Bn) Forecast, by Model, 2026-2033
- Ant Colony Optimization
- Particle Swarm Optimization
- Others
- South Asia & Oceania Market Size (US$ Bn) Forecast, by Capability, 2026-2033
- Optimization
- Clustering
- Scheduling
- Routing
- Others
- South Asia & Oceania Market Size (US$ Bn) Forecast, by Industry, 2026-2033
- Defense & Military
- Transportation & Logistics
- Robotics & Industrial Automation
- IT & Telecom
- Energy & Utilities
- Healthcare & Life Sciences
- Smart Cities & Urban Mobility
- Others
- Latin America Swarm Intelligence Market Outlook: Historical (2020 – 2025) and Forecast (2026 – 2033)
- Key Highlights
- Latin America Market Size (US$ Bn) Forecast, by Country, 2026-2033
- Brazil
- Mexico
- Rest of LATAM
- Latin America Market Size (US$ Bn) Forecast, by Model, 2026-2033
- Ant Colony Optimization
- Particle Swarm Optimization
- Others
- Latin America Market Size (US$ Bn) Forecast, by Capability, 2026-2033
- Optimization
- Clustering
- Scheduling
- Routing
- Others
- Latin America Market Size (US$ Bn) Forecast, by Industry, 2026-2033
- Defense & Military
- Transportation & Logistics
- Robotics & Industrial Automation
- IT & Telecom
- Energy & Utilities
- Healthcare & Life Sciences
- Smart Cities & Urban Mobility
- Others
- Middle East & Africa Swarm Intelligence Market Outlook: Historical (2020 – 2025) and Forecast (2026 – 2033)
- Key Highlights
- Middle East & Africa Market Size (US$ Bn) Forecast, by Country, 2026-2033
- GCC Countries
- South Africa
- Northern Africa
- Rest of MEA
- Middle East & Africa Market Size (US$ Bn) Forecast, by Model, 2026-2033
- Ant Colony Optimization
- Particle Swarm Optimization
- Others
- Middle East & Africa Market Size (US$ Bn) Forecast, by Capability, 2026-2033
- Optimization
- Clustering
- Scheduling
- Routing
- Others
- Middle East & Africa Market Size (US$ Bn) Forecast, by Industry, 2026-2033
- Defense & Military
- Transportation & Logistics
- Robotics & Industrial Automation
- IT & Telecom
- Energy & Utilities
- Healthcare & Life Sciences
- Smart Cities & Urban Mobility
- Others
- Competition Landscape
- Market Share Analysis, 2025
- Market Structure
- Competition Intensity Mapping
- Competition Dashboard
- Company Profiles
- Unanimous A.I.
- Company Overview
- Product Portfolio/Offerings
- Key Financials
- SWOT Analysis
- Company Strategy and Key Developments
- Swarm Technology
- SSI Schäfer - Fritz Schäfer
- Valutico UK Ltd.
- Hydromea SA
- DoBots
- Sentien Robotics
- ConvergentAI, Inc.
- Kim Technologies
- Apium Swarm Robotics
- Others
- Unanimous A.I.
- Appendix
- Research Methodology
- Research Assumptions
- Acronyms and Abbreviations

Loading page data
Please wait a moment


