


- Bulk Chemicals
- Solvents Market
Solvents Market Size, Share, and Growth Forecast 2026 - 2033
Solvents Market by Product Type (Oxygenated, Hydrocarbon, Halogenated), Application (Paints & Coatings, Pharmaceuticals, Adhesives, Printing Inks, Personal Care, Agricultural Chemicals), Source (Natural, Derived), and Regional Analysis for 2026 - 2033
Solvents Market Size and Trend Analysis
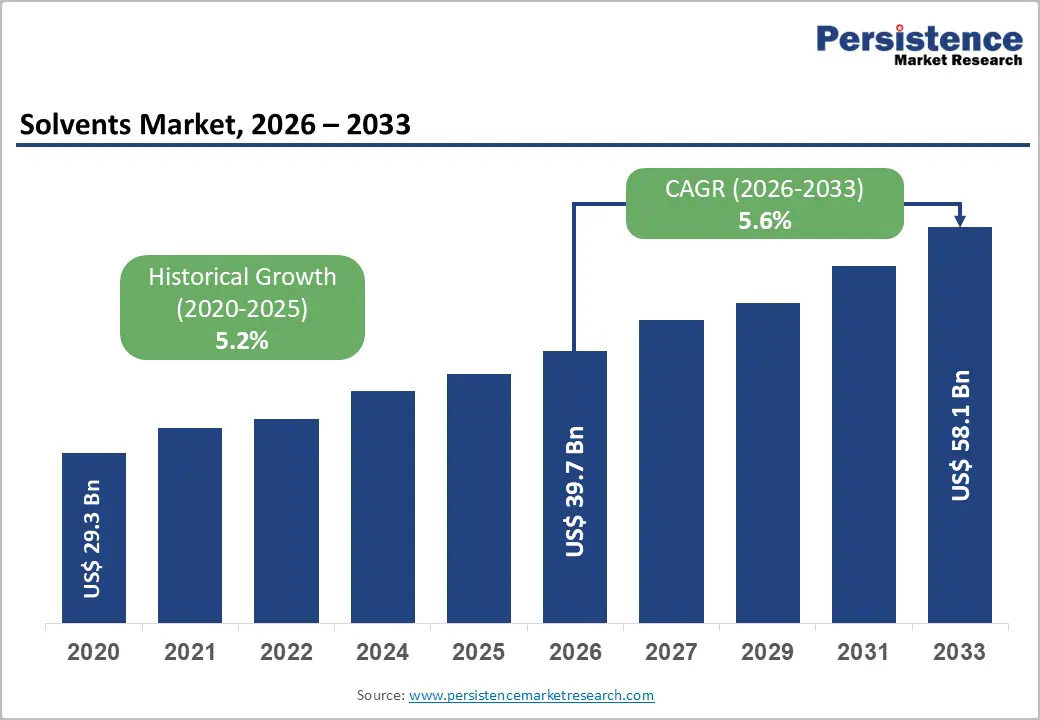
The global solvents market is valued at US$ 39.7 billion in 2026 and is projected to reach US$ 58.1 billion by 2033, growing at a CAGR of 5.6% between 2026 and 2033. Sustained growth is primarily driven by robust demand from the paints and coatings, pharmaceutical manufacturing, and adhesives industries, underpinned by accelerating urbanization and infrastructure investments across emerging markets.
The rising adoption of bio-based solvents aligned with stringent environmental regulations, combined with rapid industrial expansion in Asia Pacific economies, further strengthens the growth outlook. Expanding semiconductor and electronics manufacturing activities are also emerging as high-value demand catalysts, reinforcing steady market expansion throughout the forecast horizon.
Key Industry Highlights:
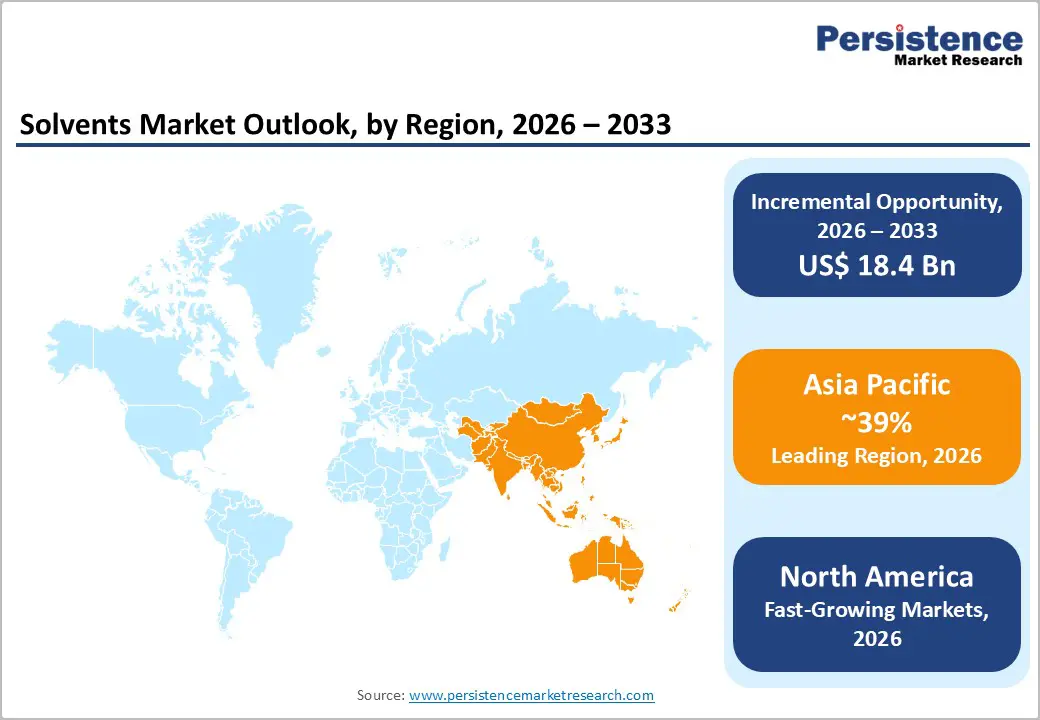
- Leading Region: Asia Pacific leads the global solvents market, with 39% market share, driven by rapid industrialization, expanding manufacturing capacity, and rising consumption across China, India, Japan, and ASEAN economies.
- Fastest Growing Region: North America is the fastest-growing region in the market, driven by an advanced petrochemical infrastructure, with major production hubs located along the Gulf Coast in Texas and Louisiana.
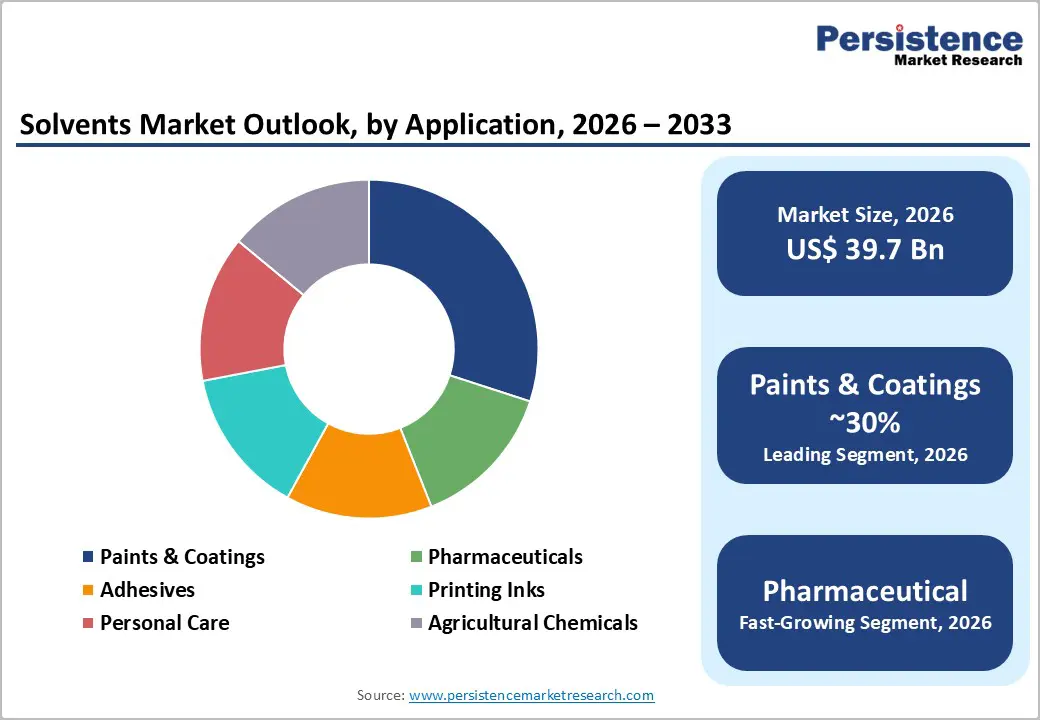
- Dominant Segment: Oxygenated solvents dominate the product type category with approximately 38% market share, owing to versatility across pharmaceuticals, coatings, and personal care applications, and growing adoption of bio-based production pathways.
- Fastest Growing Segment: The pharmaceutical application segment is the fastest-growing end-use, fueled by expanding global API production, increased generic drug manufacturing, rising biosimilar development, and demand growth in emerging pharmaceutical hubs in India and China.
- Key Market Opportunity: The shift toward bio-based and green solvents presents the primary growth opportunity, underpinned by the EU Green Deal, USDA BioPreferred Program, and surging semiconductor manufacturing investment under the U.S. CHIPS and Science Act.
| Key Insights | Details |
|---|---|
| Solvents Market Size (2026E) | US$ 39.7 Bn |
| Market Value Forecast (2033F) | US$ 58.1 Bn |
| Projected Growth CAGR (2026 - 2033) | 5.6% |
| Historical Market Growth (2020 - 2025) | 5.2% |
Market Dynamics
Drivers - Rising Demand from the Paints and Coatings Industry
The paints and coatings industry represents one of the most significant end-use segments driving global solvents consumption. According to the American Coatings Association (ACA), the U.S. coatings industry alone ships more than US$ 30 Bn worth of products annually, with solvent-based formulations maintaining a substantial share. Globally, accelerating infrastructure development programs, rapid urbanization across emerging economies, and the automotive refinishing sector continue to fuel demand for solvent-based coatings. Widely used solvents in this segment include xylene, toluene, and ethyl acetate.
Additionally, global automotive production crossed 90 million units in 2023, according to the International Organization of Motor Vehicle Manufacturers (OICA), sustaining demand for industrial-grade automotive coatings. As construction activity intensifies across the Middle East, Africa, and South and Southeast Asia, architectural coatings consumption continues to advance, creating sustained incremental demand for industrial solvents.
Expanding Pharmaceutical Manufacturing and API Production
The global pharmaceutical sector's consistent growth is a pivotal demand driver for solvents, particularly in active pharmaceutical ingredient (API) synthesis and drug formulation processes. The World Health Organization (WHO) has highlighted a post-pandemic surge in pharmaceutical investment across emerging economies, with countries such as India and China massively expanding API production capacities. Solvents, including ethanol, isopropanol, acetone, and dichloromethane, play indispensable roles in extraction, purification, crystallization, and granulation.
According to the International Pharmaceutical Federation (FIP), global pharmaceutical expenditure exceeded US$ 1.4 trillion in 2023, underscoring robust sectoral growth. The expanding focus on generic drug manufacturing and biosimilar production is prompting pharmaceutical companies to scale up high-purity oxygenated solvent procurement, meeting stringent regulatory and quality standards mandated by agencies such as the U.S. Food and Drug Administration (FDA) and the European Medicines Agency (EMA).
Restraints - Stringent Environmental and Regulatory Compliance Costs
Solvents, particularly VOC-containing halogenated and hydrocarbon variants, face increasingly rigorous regulatory scrutiny from agencies such as the U.S. Environmental Protection Agency (EPA), the European Chemicals Agency (ECHA), and the Registration, Evaluation, Authorisation and Restriction of Chemicals (REACH) framework.
The EU's Industrial Emissions Directive and Solvent Emissions Directive impose strict VOC emission caps, compelling manufacturers to reformulate products or transition to waterborne alternatives. The EPA classifies several common solvents, including perchloroethylene and methylene chloride, as hazardous air pollutants, restricting their application scope, raising compliance costs, and constraining volume growth in key industrial end-use segments.
Volatility in Petrochemical Feedstock Prices
The majority of synthetic solvents are derived from petrochemical feedstocks, making the market acutely sensitive to crude oil price fluctuations. The International Energy Agency (IEA) noted that Brent crude oil prices averaged US$ 82.2 per barrel in 2023, with notable volatility driven by OPEC+ supply decisions and ongoing geopolitical disruptions.
Such feedstock price instability translates into unpredictable production costs for solvent manufacturers, compressing profit margins and complicating long-term pricing strategies for downstream buyers in the pharmaceutical, paints, and adhesives sectors operating under fixed-term procurement contracts.
Opportunities - Shift Toward Bio-Based and Green Solvents
The global transition toward sustainable chemistry and circular economy principles presents a compelling growth opportunity for bio-based and green solvent producers. Regulatory pressure, particularly under the EU Green Deal and the U.S. Inflation Reduction Act, is accelerating the substitution of petroleum-derived solvents with bio-based alternatives derived from corn, sugarcane, and lignocellulosic biomass. Products such as ethyl lactate, dimethyl isosorbide, and 2-MeTHF are gaining traction across pharmaceutical, coatings, and agrochemical industries.
The European Bioplastics Association indicates that bio-based chemicals production capacity in Europe is expanding at double-digit annual rates. Additionally, the U.S. Department of Agriculture (USDA) BioPreferred Program actively incentivizes federal procurement of bio-based solvents, providing a readily accessible institutional market. Companies investing in scalable bio-based production technologies and securing relevant sustainability certifications are well-positioned to capture premium pricing and long-term procurement contracts.
Growth in Electronics and Semiconductor Cleaning Applications
The rapid expansion of the global electronics and semiconductor industry represents a high-value, fast-growing niche opportunity for ultra-high-purity solvents. According to the Semiconductor Industry Association (SIA), global semiconductor sales reached US$ 526.8 Bn in 2023, reinforcing robust underlying demand for cleaning solvents used in wafer fabrication and printed circuit board manufacturing. Solvents such as isopropyl alcohol (IPA), acetone, and N-methyl-2-pyrrolidone (NMP) are critical in semiconductor manufacturing.
Geopolitical dynamics driving supply chain regionalization, including the U.S. CHIPS and Science Act allocating over US$ 52 Bn to domestic chip manufacturing, are spurring new fabrication facility investments, each requiring substantial quantities of high-purity process solvents. This dynamic positions specialty solvent producers to capture significant premium margins and long-term supply agreements with leading semiconductor fabricators.
Category-wise Analysis
Product Type Insights
Oxygenated solvents account for the largest share of the global solvents market, representing approximately 38% of total market revenue. This dominance is attributable to their widespread adoption across high-volume end-use sectors, including paints and coatings, pharmaceuticals, and personal care products. Key oxygenated solvents, ethanol, acetone, ethyl acetate, butanol, and glycol ethers, are valued for their versatile solvating power, favorable toxicological profiles relative to halogenated alternatives, and growing bio-based production pathways.
According to the European Chemical Industry Council (Cefic), oxygenated solvent production in Europe has maintained steady year-on-year growth, supported by pharmaceutical and fine chemical demand. Moreover, regulatory pressure to replace hazardous halogenated solvents under the REACH framework is redirecting industrial consumption toward oxygenated alternatives, further consolidating the segment's dominant market position through the forecast period.
Application Insights
Paints and coatings is the dominant application segment, capturing approximately 30% of global solvents demand. Solvents play an essential function in coatings formulation, influencing viscosity, drying time, film formation, and surface finish quality. The architectural coatings segment, driven by residential and commercial construction activity, remains the largest consumer of industrial solvents, including xylene, toluene, and mineral spirits. According to the World Paint and Coatings Industry Association (WPCIA), global paint and coatings production exceeded 50 million tonnes in 2023.
Automotive OEM and refinishing sectors further sustain solvent demand as vehicle production recovers globally. While regulatory trends toward high-solids and waterborne formulations are moderating solvent intensity per coating unit, absolute demand volumes remain robust given the expanding global construction, infrastructure, and manufacturing base, particularly across Asia Pacific and the Middle East.
Source Insights
Derived (petroleum-based synthetic) solvents dominate the market by source, accounting for approximately 82% of total production volume. This overwhelming dominance reflects established, large-scale petrochemical infrastructure supporting production across North America, Europe, and Asia. Key petroleum-derived solvents, toluene, xylene, benzene, and chlorinated compounds, benefit from decades of optimized production processes, economies of scale, and well-established global supply chains.
Integrated producers such as BASF SE, ExxonMobil Corporation, and Shell PLC provide cost-efficient feedstock supply at scale. While natural and bio-based solvents are gaining momentum due to sustainability imperatives and regulatory support, the technical performance, cost competitiveness, and production scalability of derived solvents ensure their continued market leadership across the forecast period.
Regional Insights
North America Solvents Market Trends
North America maintains a dominant position in the global solvents market, supported by strong industrial activity led by the United States. The region benefits from an advanced petrochemical infrastructure, with major production hubs located along the Gulf Coast in Texas and Louisiana. According to the American Chemistry Council, U.S. chemical shipments surpassed US$665 billion in 2023, with solvents representing a significant share of specialty and commodity output.
Demand is primarily driven by the paints and coatings, pharmaceutical manufacturing, and adhesives sectors, further strengthened by stringent EPA VOC regulations encouraging the use of low-VOC formulations. Although geopolitical tensions between the United States and Iran have placed upward pressure on global feedstock prices, North America’s substantial shale oil production has helped stabilize supply. Additionally, Canada’s pharmaceutical and specialty coatings industries and Mexico’s expanding automotive sector reinforce regional solvent consumption.
Europe Solvents Market Trends
Europe constitutes a mature yet strategically important solvents market, distinguished by stringent environmental regulation under the EU REACH framework and the Industrial Emissions Directive. Major economies, including Germany, France, the United Kingdom, and Spain, account for most regional solvent consumption, driven by robust paints, specialty chemicals, and pharmaceutical manufacturing sectors.
Germany remains the largest consumer, supported by its extensive automotive, chemical, and pharmaceutical industries. According to Cefic, the European chemical sector employs over 1.2 million people, underscoring its economic relevance. Although producers face rising energy costs linked to the Russia-Ukraine conflict and global crude oil volatility, the European Green Deal is accelerating investment in bio-based and recycled solvents. This regulatory environment fosters innovation in green chemistry and creates differentiated opportunities for early-adopting manufacturers.
Asia Pacific Solvents Market Trends
Asia Pacific represents the largest regional solvents market, with 39% market share, driven by rapid industrialization, expanding manufacturing capacity, and rising consumption across China, India, Japan, and ASEAN economies. China remains the principal producer and consumer, supported by extensive petrochemical infrastructure and strong demand from paints, electronics, and pharmaceutical manufacturing. According to the CPCIF, the country’s specialty chemical output, including solvents, has continued to record double-digit growth, reinforced by policies aimed at strengthening chemical self-sufficiency.
India is emerging as a high-growth market, supported by the government’s PLI Scheme, which is attracting significant investment in API and specialty chemical production. Additionally, manufacturing shifts toward Vietnam, Indonesia, and Thailand are creating new demand centers, further strengthening regional solvent consumption across Southeast Asia.
Competitive Landscape
The global solvents market exhibits a moderately consolidated competitive structure, dominated by large integrated petrochemical companies with diversified product portfolios and expansive global production footprints. Market leaders, including BASF SE, Shell PLC, ExxonMobil Corporation, LyondellBasell Industries Holdings B.V., and Eastman Chemical Company, leverage backward integration into feedstock supply, enabling cost-competitive production at scale. Competitive differentiation is driven by product quality certifications, supply reliability, technical application support, and sustainability credentials. Bio-based and recycled solvent offerings are reshaping strategic priorities, with mid-tier specialty producers competing through niche product development and regional distribution advantages. Strategic acquisitions and targeted capacity expansions remain prevalent growth tactics across the competitive landscape.
Key Developments:
- March 2026: BASF’s Intermediates division has introduced new product variants with a reduced product carbon footprint (rPCF) for butanediol (BDO), tetrahydrofuran (THF), polytetrahydrofuran (PolyTHF®), and N-methylpyrrolidone (NMP) produced at its Verbund site in Ludwigshafen, Germany.
- March 2026: ExxonMobil announces price increase on Hydrocarbon Solvents, taking effect on March 11, 2026, unless existing contracts specify otherwise. ExxonMobil Product Solutions Company (EMPSC) announced that prices for several solvent product lines will increase by up to $0.06 per pound. This adjustment reflects ongoing shifts within the chemical supply landscape.
- March 2026: BASF and Silox have entered into a definitive agreement under which Silox acquires selected hydrosulfite-related assets from BASF. The transaction comprises specific assets, including intellectual property rights, special containers, selected production equipment, technical expertise, and related trademarks.
Top Companies in the Solvents Market
- BASF SE (Ludwigshafen, Germany), the world's largest chemical company, commands a leading position in global solvents with an extensive portfolio spanning oxygenated, hydrocarbon, and specialty solvents. Its deep backward integration, global manufacturing network spanning over 90 production sites, and substantial R&D investment in sustainable chemistry make it the market's foremost competitor.
- ExxonMobil Corporation (Spring, Texas, U.S.) is a key global producer of hydrocarbon solvents through its Esso Chemical and Mobil brands. Leveraging its vast refinery and petrochemical infrastructure, processing over 4 million barrels of crude oil per day, the company offers a broad range of aromatic and aliphatic solvents serving paints, adhesives, and industrial cleaning markets globally.
- Eastman Chemical Company (Kingsport, Tennessee, U.S.) is a prominent specialty solvents manufacturer known for its oxygenated solvent portfolio, including esters and ketones. With annual revenues exceeding US$ 9 Bn, the company has strategically invested in bio-based and circular solvents, positioning itself strongly for sustainability-driven demand in pharmaceutical and personal care applications.
Companies Covered in Solvents Market
- BASF SE
- Shell PLC
- Exxon Mobil Corporation
- LyondellBasell Industries Holdings B.V.
- Eastman Chemical Company
- Ashland Global Holdings B.V.
- Celanese Corporation
- Huntsman International LLC
- Solvay S.A.
- Honeywell International Inc.
- Ineos Group Holdings S.A.
- Arkema S.A.
- TotalEnergies SE
- Sasol Ltd.
- BP P.L.C.
Frequently Asked Questions
The global Solvents market is valued at US$ 39.7 Bn in 2026 and is projected to reach US$ 58.1 Bn by 2033, growing at a forecast CAGR of 5.6% from 2026 to 2033. The market was valued at US$ 29.3 Bn in 2020, recording a historical CAGR of 5.2% between 2020 and 2025.
The primary growth drivers include robust demand from the paints and coatings industry, supported by global construction activity and automotive production exceeding 90 million units per OICA, and expanding pharmaceutical manufacturing for API synthesis. Growing adoption of bio-based solvents driven by regulatory mandates under the EU Green Deal and increasing demand from semiconductor manufacturing further accelerates market expansion.
Oxygenated solvents represent the leading product type segment, accounting for approximately 38% of global market revenue. Their dominance is driven by versatile applications across pharmaceuticals, coatings, and personal care industries, an improving bio-based production outlook, and regulatory incentives favoring their substitution for hazardous halogenated alternatives under the REACH framework in Europe.
North America holds a leading position in the global Solvents market, underpinned by the United States' advanced petrochemical infrastructure, large-scale paints and coatings, and pharmaceutical industries, and chemical shipments exceeding US$ 665 Bn as reported by the American Chemistry Council (ACC). Asia Pacific, however, represents the largest and fastest-growing region overall, led by China and India.
The shift toward bio-based and green solvents represents the foremost growth opportunity, supported by the EU Green Deal, USDA BioPreferred Program, and escalating demand from semiconductor fabrication facilities catalyzed by the U.S. CHIPS and Science Act's investment of over US$ 52 Bn. Specialty solvent producers addressing high-purity electronics and bio-based application segments stand to capture superior long-term growth and premium margins.
The global Solvents market is served by leading integrated chemical companies, including BASF SE, Shell PLC, Exxon Mobil Corporation, LyondellBasell Industries Holdings B.V., Eastman Chemical Company, Celanese Corporation, Huntsman International LLC, Solvay S.A., Honeywell International Inc., Arkema S.A., TotalEnergies SE, Ineos Group Holdings S.A., Sasol Ltd., and BP P.L.C., among others.


