


- Industrial Goods & Service
- Simulators Market
Simulators Market Size, Share, and Growth Forecast 2026–2033
Simulators Market by Solution Type (Products, Services), Simulators Type (Airborne, Ground, Marine), Technique (Live, Virtual, Constructive, Hybrid), End-use (Aerospace & Défense, Manufacturing, Oil & Gas, Healthcare, Automotive, Electrical & Electronics, Others), and Regional Analysis for 2026–2033
Simulators Market Size and Trend Analysis
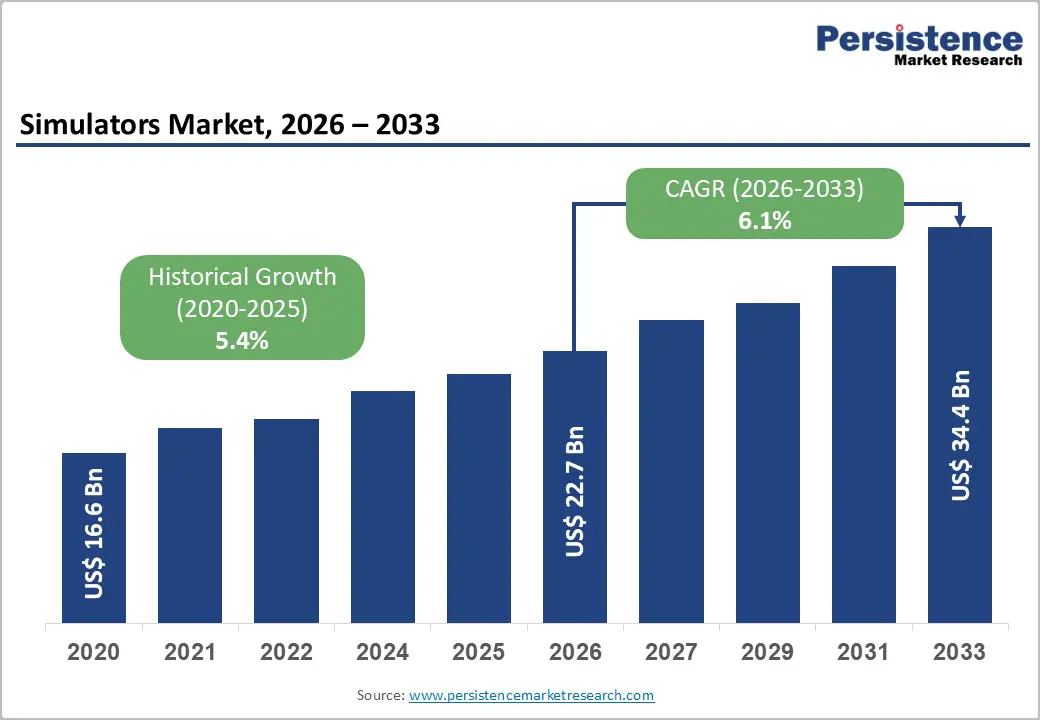
The global simulators market size is expected to be valued at approximately US$ 22.7 Bn in 2026 and is projected to reach US$ 34.4 Bn by 2033, growing at a CAGR of 6.1% between 2026 and 2033. This robust growth trajectory is driven by escalating global defence modernization budgets, the aviation industry's mandatory flight crew training requirements, and the rapid expansion of simulation-based training across healthcare, automotive, and industrial manufacturing sectors seeking to reduce operational risk and training costs.
Record NATO and Asia Pacific defence spending is generating unprecedented simulator procurement cycles, while the International Civil Aviation Organization (ICAO) mandated minimum flight training hours in full-flight simulators.
Key Industry Highlights:
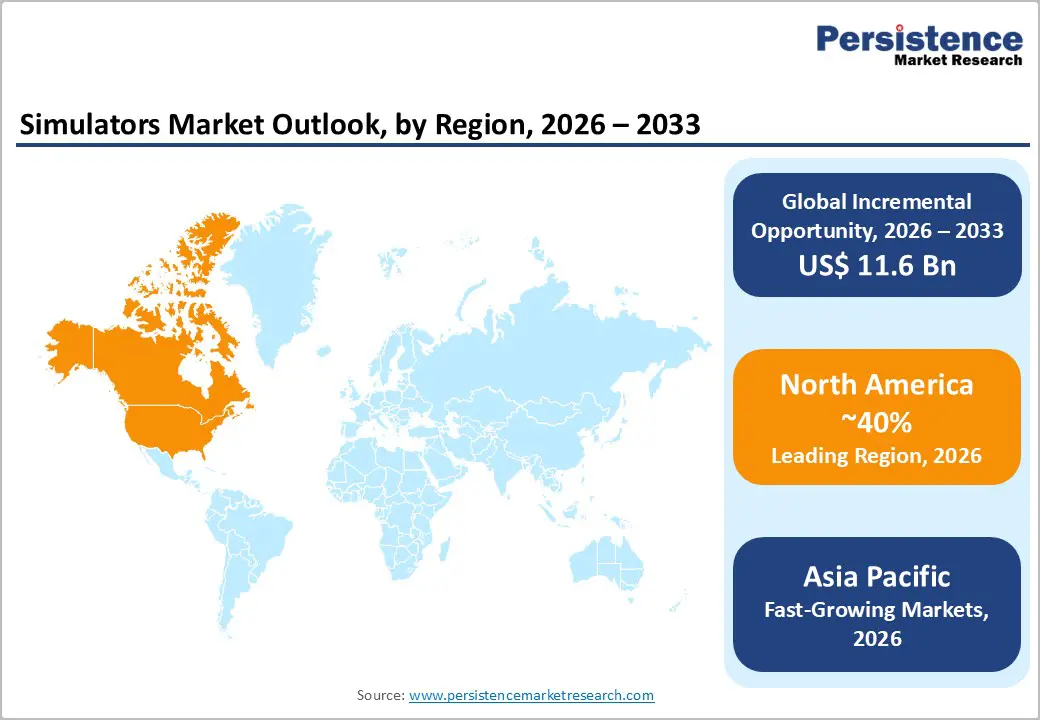
- Leading Region – North America commands the largest global share of the simulators market with approximately 43% revenue share in 2025, anchored by the U.S. DoD's multi-billion-dollar annual simulation procurement and the world's most extensive ICAO/FAA-compliant commercial aviation training simulator infrastructure.
- Fastest Growing Region – Asia Pacific is projected to register the highest CAGR through 2033, driven by the world's fastest-growing commercial aviation fleet requiring FFS capacity expansion, rise in China and India Défense simulation investments, and IATA-documented pilot shortage severity compelling simulator-intensive training programs.
- Dominant End-user Segment– Aerospace and Défense leads end-use with approximately 55% market share in 2025, driven by ICAO mandatory pilot training simulator requirements and U.S. DoD Live, Virtual, and Constructive simulation modernization programs generating consistent high-volume procurement globally.
- Fastest Growing End-user Segment – Virtual simulation is the fastest-growing technique segment, accelerated by the U.S. Army's multi-billion-dollar Synthetic Training Environment (STE) and European Defence Agency LVC guidance recommending cloud-hosted virtual simulation as a cost-effective complement to physical platform simulators.
- Key Opportunity: Healthcare simulation adoption across 1,000+ medical institutions (SSH data) and explosive ADAS automotive HIL simulation demand driven by automakers requiring billions of virtual test miles for software-defined vehicle validation represent the highest-growth adjacent market expansion opportunities for established simulation technology suppliers.
DRO Analysis
Drivers – Rise in Global Défense Budgets Are Driving Unprecedented Military Simulator Procurement Across All Platform Domains
Record-level global Défense spending is the single most consequential structural demand driver for the simulators market, with the Stockholm International Peace Research Institute (SIPRI) reporting that global military expenditure reached USD 2.44 trillion in 2023 the ninth consecutive year of increase and NATO member states accelerating commitments to the 2% of GDP Défense spending target in response to evolving geopolitical threats.
Military simulator procurement is a direct and proportional beneficiary of Défense budget growth: the U.S. Department of Défense (DoD) allocates a consistent share of its training and readiness budget to Live, Virtual, and Constructive (LVC) simulation systems, with the U.S. Army's Synthetic Training Environment (STE) program representing a multi-billion-dollar investment in next-generation combined arms simulation.
ICAO-Mandated Flight Training Requirements and Global Commercial Pilot Demand Are Creating Structural Airborne Simulator Demand
The commercial aviation industry's structural demand for full-flight simulators (FFS) and flight training devices is anchored by ICAO Annex 1 and Annex 6 regulatory requirements that mandate minimum simulator-based training hours for commercial pilot licensing, type rating qualification, and recurrent proficiency check programs, requirements that cannot be substituted with aircraft-based training without significantly higher operating cost. The Boeing Commercial Market Outlook 2023–2042 projects demand for approximately 634,000 new commercial pilots globally over the next 20 years to support fleet growth and replacement retirements, with Asia Pacific requiring the largest regional pilot cohort.
The Civil Aviation Authority (CAA) UK, EASA, and FAA collectively approve full-flight simulator qualification levels under which most commercial type rating and recurrent training programs are conducted, mandating a minimum fleet of certified simulators per active aircraft type that expands proportionally with airline fleet growth.
Restraints - High Capital Cost and Long Development Lead Times Constrain New Entrant Participation and Limit Procurement Flexibility for Buyers
Advanced full-flight simulators and high-fidelity military platform simulators represent among the highest capital-cost items in training equipment procurement with commercial Level D full-flight simulators priced at USD 10–20 million per unit and military combat vehicle or aircraft simulators frequently exceeding USD 50–100 million for complete training system packages.
For aviation training organizations and Défense agencies operating under constrained capital budgets, these procurement thresholds create significant financing barriers that delay acquisition decisions and limit total fleet size, directly suppressing simulator market growth velocity relative to underlying training demand.
Cybersecurity Vulnerabilities in Connected Simulation Environments Create Procurement Risk and Program Delays for Défense Buyers
The progressive networking of military simulation environments enabling Live, Virtual, Constructive (LVC) integrated training across geographically dispersed simulators and live forces introduces significant cybersecurity risk that Défense procurement agencies are responding to with increasingly stringent requirements that add cost and extend acquisition timelines.
The U.S. Department of Défense (DoD) Risk Management Framework (RMF) and NIST SP 800-53 cybersecurity control requirements impose substantial compliance verification obligations on military simulator suppliers, and program schedule slippage attributable to cybersecurity assessment and accreditation processes has been documented in multiple high-profile simulator programs.
For simulator manufacturers, these requirements generate additional compliance engineering costs that compress program margins and reduce competitive differentiation to cybersecurity certification breadth rather than simulation fidelity innovation.
Opportunities - Virtual and Constructive Simulation Techniques Are the Fastest-Growing Segments, Enabled by AI and Cloud Computing Advances
The virtual and constructive simulation technique segments are experiencing accelerating growth as advances in artificial intelligence, real-time ray tracing graphics, and cloud-based simulation infrastructure progressively close the fidelity gap between high-end physical simulators and software-based virtual training environments at dramatically lower cost per training hour.
The U.S. Army's Synthetic Training Environment (STE), a cloud-hosted synthetic environment combining terrain, weather, and opposing force behaviour in a single persistent simulation, represents the most consequential investment signal for the virtual and constructive simulation segment, with the Program Executive Office for Simulation, Training, and Instrumentation (PEO STRI) managing a multi-billion-dollar STE program that is reshaping the U.S. military's simulation acquisition philosophy.
Healthcare and Automotive Simulation Growth Represents a High-Value Adjacent Market Expansion Opportunity Beyond Traditional Défense and Aviation
The healthcare simulation segment is among the fastest-growing end-use categories in the simulators market, driven by evidence-based adoption of medical simulation for surgical training, clinical procedure competency assessment, and emergency response team training applications, where simulation-based practice demonstrably reduces patient safety incidents without exposing real patients to training risk.
The Society for Simulation in Healthcare (SSH) reports that simulation is now integrated into medical education curricula at over 1,000 healthcare institutions globally, and the American College of Surgeons (ACS) has incorporated simulation into its Accredited Education Institutes program as a standard competency requirement.
Category-wise Analysis
Solution Type Insights
Products lead the solution type segment with approximately 58% market share in 2025, reflecting the capital goods nature of the simulators industry, where hardware simulator systems full-flight simulators, driving simulators, naval bridge simulators, and military platform trainers represent the foundational procurement units around which training programs are structured. Simulator product procurement generates the largest individual contract values in the market, and the installed base of certified simulators creates a predictable opportunity for maintenance and upgrade services.
CAE Inc. and L3Harris Technologies are among the world's largest simulator product suppliers by installed base, with thousands of full-flight simulators and military platform trainers deployed globally that sustain consistent replacement and capability upgrade procurement cycles.
Simulators Type Insights
Airborne simulators lead the simulator type segment with approximately 48% market share in 2025, reflecting the aviation industry's unique combination of mandatory regulatory training requirements, high training cost economics that strongly favor simulation over aircraft-based training, and the broad range of platform types, commercial transport, regional, helicopter, military fixed-wing, and unmanned aircraft, each requiring dedicated certified simulator systems.
The FAA and EASA full-flight simulator certification programs qualify Level A through Level D devices based on motion system, visual system, and aerodynamic model fidelity, with Level D certification providing the broadest regulatory credit for mandatory pilot training requirements and commanding the highest market pricing.
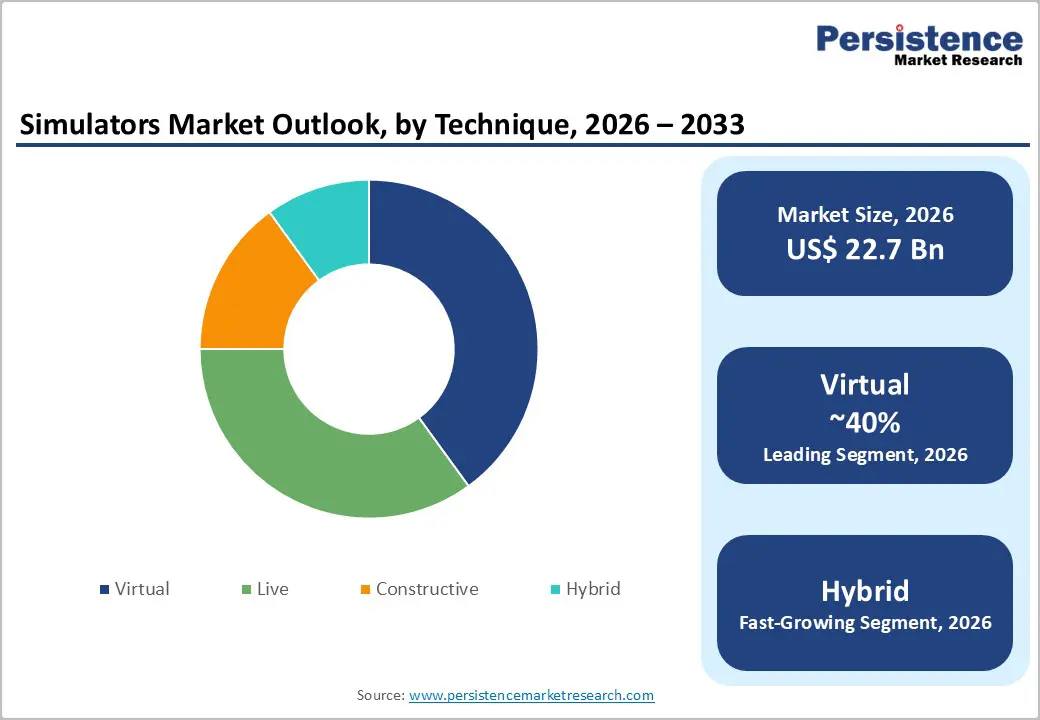
Technique Insights
Virtual simulation technique leads with approximately 38% market share in 2025, encompassing the large category of software-based simulator platforms where trainees interact with high-fidelity visual and instrument representations of vehicle systems, environments, and scenarios without physical platform motion systems a category that includes PC-based part-task trainers, immersive dome-projection visual systems, and desktop synthetic environment workstations that deliver effective training at dramatically lower cost than full-motion simulators.
Virtual simulation's cost advantage over full-motion physical simulators makes it the preferred technique for high-frequency, skill-building training phases where scenario repetition volume matters more than motion cueing fidelity a design rationale supported by military training effectiveness research including the U.S. Army Research Laboratory's published studies on virtual environment training transfer.
End-use Insights
Aerospace & Défense leads the end-use segment with approximately 55% market share in 2025, a dominance rooted in the regulatory-mandated simulator training requirements of commercial aviation combined with the Défense sector's consistent and growing procurement of military platform simulation systems as a cost-effective alternative to live training that reduces both financial cost and operational risk.
The U.S. DoD alone manages one of the world's largest simulator fleets. The Program Executive Office for STRI oversees thousands of simulation systems across all service branches, and comparable programs exist across NATO member nations and the armed forces of major Asia Pacific military powers.
Regional Analysis
North America Simulators Market Trends & Analysis
North America is the world's largest simulators market, anchored by the United States' unmatched Défense simulation investment and the world's most extensive commercial aviation training infrastructure. The U.S. DoD's sustained investment in Live, Virtual, and Constructive simulation modernization spanning the Army's STE, Air Force's Distributed Mission Operations (DMO), and Navy's Live Virtual Constructive-Training Resource Enterprise (LVC-TRE) programs creates consistent multi-billion-dollar annual procurement activity that sustains North America's commanding market revenue share.
U.S. Simulators Market Size
The United States commands approximately 83% of the North American simulators market, representing the world's largest single-country simulation procurement base driven by a Défense budget exceeding USD 886 billion in FY2024 per the U.S. Office of Management and Budget, a commercial aviation fleet of over 7,000 mainline aircraft requiring certified FFS-based pilot training, and the world's most advanced medical simulation education ecosystem.
Europe Simulators Market Trends, Drivers, & Insights
Europe is a highly regulated and technically sophisticated simulators market, shaped by EASA civil aviation training requirements, NATO allied Défense simulation interoperability mandates, and the European Defence Fund (EDF) co-funding programs that are accelerating member nation investment in LVC simulation capabilities. Europe's Défense simulation market is in a period of significant expansion as NATO member states increase Défense budgets toward the 2% of GDP target with Germany, Poland, and the Nordic nation’s leading procurement acceleration.
Germany Simulators Market Size
Germany holds approximately 22% of the European simulators market, driven by its status as Europe's largest economy with both a world-class aerospace and Défense industry including Airbus Defence & Space, Rheinmetall, and Hensoldt, and Europe's largest commercial aviation training market through Lufthansa Aviation Training, which operates one of the world's largest commercial FFS fleets. Germany's Zeitenwende Défense spending reversal committing to the 2% of GDP NATO target, is expanding Bundeswehr simulation procurement significantly.
U.K. Simulators Market Size
The United Kingdom accounts for approximately 18% of the European simulators market, anchored by its large Défense simulation sector. The UK Ministry of Defence (MoD) operates extensive air, land, and maritime simulation programs including the Hawk Advanced Jet Trainer simulator and Typhoon FFS systems, and the CAA-regulated commercial aviation training market is centered on London Heathrow, where major FFS training centres serve British and international airlines. The UK segment grows at approximately 5.9% CAGR through 2033.
France Simulators Market Size
France represents approximately 15% of the European simulators market, with demand driven by the French Air and Space Force's advanced combat aircraft simulation programs, including Rafale full-mission simulators and the Direction Générale de l'Aviation Civile (DGAC)-regulated commercial aviation training market. France's Défense simulation sector is expanding under the Military Programming Law (LPM 2024–2030), committing EUR 413 billion to Défense capability investment, with simulation infrastructure upgrades explicitly included.
Asia Pacific Simulators Market Drivers
Asia Pacific is the fastest-growing regional simulators market, propelled by the world's most intensive commercial aviation fleet expansion with Boeing and Airbus backlogs concentrated in Asian airline orders combined with rapidly escalating Défense simulation investments in China, India, South Korea, and Australia. The region's chronic pilot shortage, documented by IATA as the most acute globally, is compelling airlines to maximize simulator-based training throughput as a strategic response to training bottlenecks.
China Simulators Market Size
China holds approximately 36% of the Asia Pacific simulators market, driven by the world's fastest-growing commercial aviation fleet the Civil Aviation Administration of China (CAAC) projects the domestic fleet to exceed 9,000 aircraft by 2042 and China's substantial military simulation investment as the People's Liberation Army (PLA) modernizes training doctrine to emphasize simulation-based readiness.
India Simulators Market Size
India holds approximately 14% of the Asia Pacific simulators market and is among the region's fastest-growing country markets at approximately 7.8% CAGR through 2033. India's Directorate General of Civil Aviation (DGCA) mandates simulator-based training aligned with ICAO standards, and the country's commercial fleet, projected to reach 2,500 aircraft by 2032 per IATA is generating FFS capacity demand. India's Défense simulation market is expanding under the Make in India Défense indigenization program, with HAL Tejas trainer and advanced helicopter simulator procurement accelerating.
Japan Simulators Market Size
Japan represents approximately 12% of the Asia Pacific simulators market. Japan's mature commercial aviation sector operated by All Nippon Airways (ANA) and Japan Airlines (JAL) maintains world-class FFS training infrastructure at certified training centers, and the Japan Air Self-Défense Force (JASDF) operates advanced combat aircraft simulators including F-35A and F-15J full-mission trainers. Japan's growing investment in V-22 Osprey and maritime patrol aircraft simulators is expanding the Défense training segment.
Competitive Landscape
The global simulators market is moderately consolidated at the prime contractor tier, with CAE Inc., L3Harris Technologies, Thales Group, Leonardo DRS, and Saab AB collectively commanding an estimated 40–45% of global revenue through their diversified portfolios spanning civil aviation FFS, military platform simulation, and naval tactical trainers.
Scale, platform certification credentials, and installed base service relationships are decisive competitive moats particularly in commercial FFS where EASA and FAA Level D certification is a multi-year qualification investment. Strategic themes include AI-powered adaptive training scenario generation, cloud-based LVC integration platforms, and managed training service models that convert capital sales into long-term contracted revenue.
Key Developments:
- In September 2025, Aboa Mare, a Finnish maritime training academy, bolstered its naval training prowess by procuring a K-Sim Engine Full Mission and Desktop Simulator system from Kongsberg Maritime. Scheduled for delivery in the first quarter of 2026, the system boasts cutting-edge simulator models.
- In April 2025, Pan Am Flight Academy acquired a Boeing 767-300ER Level “D” full-flight simulator, representing a strategic move to expand its wide-body aircraft training portfolio. Operational by July 2025 at the Axis Park Campus in Miami, this addition enhanced the Academy’s capacity to meet increasing global demand for advanced pilot training.
Companies Covered in Simulators Market
- CAE Inc.
- L3Harris Technologies
- Thales Group
- Leonardo DRS
- Saab AB
- Lockheed Martin Corporation
- Boeing Défense Space & Security
- Raytheon Technologies (RTX)
- FlightSafety International
- Kongsberg Defence & Aerospace
- Havelsan A.S.
- Cubic Corporation
- UFI Filters
Frequently Asked Questions
In 2024, the market value for simulators was US$ 19.4 Bn.
The global simulators market is estimated to advance at a 6.8% CAGR through 2032.
The market for simulators is forecasted to climb to US$ 32.5 Bn by 2032 end.
Demand for simulators market in China is projected to rise at a CAGR of 8.9% over the forecast period.
In 2024, the North America simulators market held a dominant market share of 29.8%.


