


- Display Technologies
- Night Vision Devices Market
Night Vision Devices Market Size, Share, and Growth Forecast, 2026 - 2033
Night Vision Devices Market by Device Type (Goggles, Cameras, Glasses, Binoculars and Monocular, and Scopes), By Application (Border surveillance, Maritime & Coastal surveillance, Medical, Security, Engineering, Fire and Rescue, Law Enforcement, and Others), and Regional Analysis for 2026 - 2033
Night Vision Devices Market Size and Trends Analysis
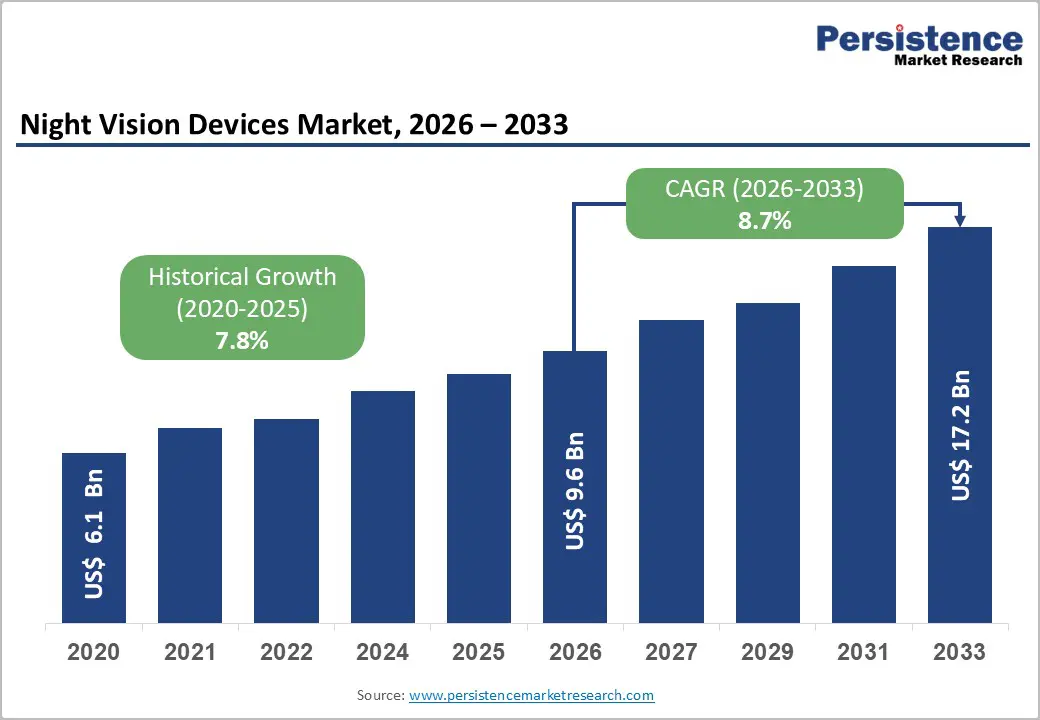
The global night vision devices market size was valued at US$ 6.1 Billion in 2020 and US$ 9.6 Billion in 2026, with projections to reach US$ 17.2 Billion by 2033, growing at a CAGR of 8.7% between 2026 and 2033. The historical CAGR from 2020 - 2026 was 7.8%, demonstrating consistent market acceleration driven by escalating geopolitical tensions, advancing thermal imaging technology, and expanding defense budgets across developed and emerging economies.
Primary growth factors include increased border security investments, rising demand for advanced surveillance systems in maritime operations, and civilian applications spanning firefighting, medical diagnostics, and industrial security. The market demonstrates robust momentum across both government procurement cycles and commercial adoption channels, with Asia Pacific emerging as the fastest-growing regional market at 9.6% CAGR, signaling substantial untapped opportunities in developing nations.
Key Industry Highlights:
- Market Growth Projection: Global night vision devices market valued at US$ 9.6 Billion in 2026, expanding to US$ 17.2 Billion by 2033 at 8.7% CAGR, representing 79% absolute value expansion over seven-year forecast period with consistent growth acceleration from historical 7.8% CAGR baseline.
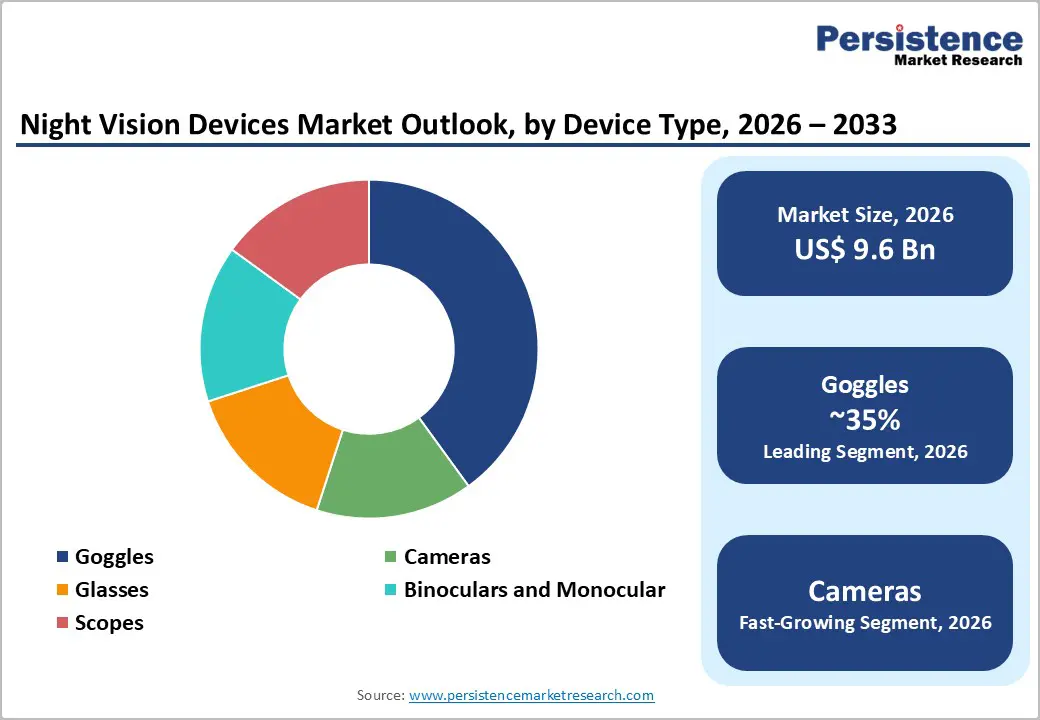
- Device Type Dominance: Goggles maintain market leadership with 35%+ revenue share supported by military procurement priority, while Cameras represent fastest-growing segment at 9.5% CAGR driven by commercial surveillance, medical applications, and unmanned systems integration demand.
- Application Growth Drivers: Border surveillance commands 30%+ market share through government infrastructure investment; Maritime & Coastal surveillance accelerates at 9.7% CAGR reflecting naval modernization, piracy prevention, and maritime security protocol enforcement across developed and developing economies.
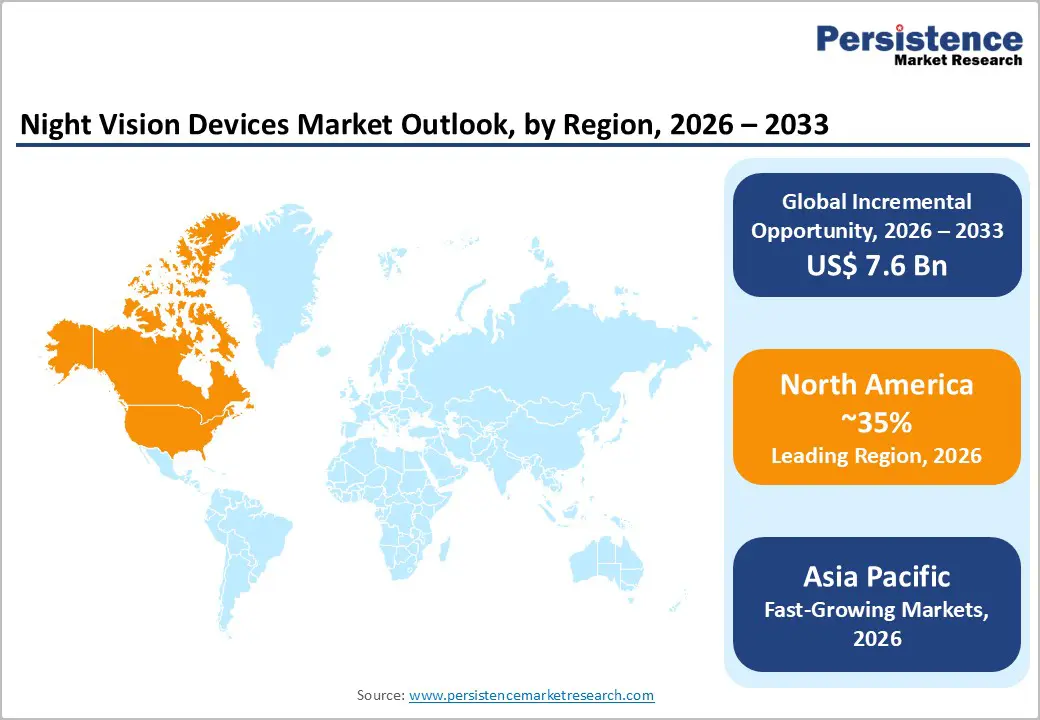
- Regional Growth Leadership: Asia Pacific emerging market demonstrates 9.6% CAGR substantially outpacing 8.2% North American and 7.8% European growth, with China, India, and ASEAN nations driving 50%+ incremental market value creation through 2033 defense modernization and smart city infrastructure investment.
- Competitive Consolidation: Market structure remains concentrated with 3-4 dominant defense contractors controlling 55-60% share; emerging Chinese manufacturers capturing 15-20% commercial segment share through cost-competitive positioning and manufacturing capacity scaling across Southeast Asia.
| Global Market Attributes | Key Insights |
|---|---|
| Night Vision Devices Market Size (2026E) | US$ 9.6 Bn |
| Market Value Forecast (2033F) | US$ 17.2 Bn |
| Projected Growth (CAGR 2026 to 2033) | 8.7% |
| Historical Market Growth (CAGR 2020 to 2025) | 7.8% |
Key Growth Drivers
Escalating Geopolitical Tensions and Defense Budget Expansion
Rising geopolitical instability and regional security concerns have substantially elevated government defense spending globally. According to Stockholm International Peace Research Institute (SIPRI) data, global military expenditure exceeded US$ 2.4 trillion in 2023, with night vision capability modernization representing a critical procurement priority for defense establishments. Border security applications represent over 30% of current market demand, particularly across U.S.-Mexico, India-Pakistan, and European borders where night vision devices facilitate enhanced surveillance and threat detection.
The U.S. Department of Defense continues investing heavily in advanced thermal imaging and generation-4 night vision goggle systems, while NATO allies have substantially increased defense technology budgets. China's military modernization program includes significant procurement of night vision and infrared systems for surveillance and tactical operations. This driver directly correlates with the market's historical 7.8% CAGR and accelerating trajectory toward 8.7% through 2033, as defense spending remains structurally resilient across political cycles.
Market Restraining Factors
Regulatory Restrictions and Export Control Frameworks
Night vision technology remains classified as dual-use equipment subject to stringent export control regulations under International Traffic in Arms Regulations (ITAR) in the U.S. and similar frameworks globally. European Union export restrictions limit market accessibility for non-NATO aligned countries, significantly constraining market expansion in emerging economies across Southeast Asia, Middle East, and Africa. These regulatory frameworks create substantial compliance costs (estimated 8-12% of manufacturing expenses for export-certified manufacturers), reduce market participation by smaller competitors, and extend product commercialization timelines by 18-24 months. Supply chain fragmentation and restricted access to critical components (specialized optics, infrared sensors from regulated suppliers) limit new entrant participation.
Compliance monitoring requirements and potential penalization for unauthorized technology transfer create institutional risk, particularly for multinational manufacturers with diverse geographic footprints, constraining market velocity despite strong underlying demand signals.
Night Vision Devices Market Trends and Opportunities
Medical and Civil Safety Applications Market Expansion
FDA approval pathways for thermal imaging in medical diagnostics (fever screening, inflammatory condition detection, cardiac abnormality visualization) create substantial commercial market expansion distinct from government procurement cycles. Global medical device market expansion (particularly in point-of-care diagnostics and telemedicine applications) offers recurring revenue opportunities through healthcare institutional procurement. Civilian fire rescue, search and rescue operations, and disaster response agencies increasingly adopt thermal imaging with institutional funding support from government and international organizations.
Climate change adaptation investments in flood management, wildfire prevention, and disaster preparedness create government spending mechanisms supporting thermal imaging adoption across civil agencies. Estimated commercial and medical market opportunity exceeds US$ 1.9 billion by 2033, with lower price-point requirements enabling smaller manufacturers and technology entrepreneurs to capture segment share while reducing export control regulatory burdens.
Night Vision Devices Market Insights and Trends
Device Type Insights
Goggles Dominate Defense Demand While Cameras Accelerate Commercial Thermal Imaging Adoption Globally
Goggles remain the leading device type in the market, accounting for over 35% of total revenue, largely due to their critical role in military and law enforcement operations. Head-mounted night vision goggles are essential for hands-free use, binocular vision, and extended tactical missions lasting four to eight hours. Defense procurement across the U.S. military, NATO allies, and emerging defense economies continues to prioritize goggles, with unit prices typically ranging between US$ 3,000 and US$ 8,000 depending on generation and thermal integration. Strict ergonomic requirements, compatibility with heads-up displays, and compliance with military-grade specifications create high entry barriers, limiting competition from low-cost manufacturers. Ongoing modernization programs and generational upgrades from third- to fourth-generation systems further sustain replacement-driven demand, while adoption by law enforcement and commercial security agencies expands the segment beyond traditional defense users.
In contrast, cameras represent the fastest-growing device segment, registering a CAGR of 9.5%, driven by expanding non-defense applications. Growth is fueled by fixed thermal surveillance for infrastructure security, medical diagnostics, industrial maintenance, and UAV-based operations such as search and rescue and firefighting. Affordable portable and smartphone-integrated thermal cameras under US$ 500 are widening market access, while cloud analytics and subscription-based monitoring models are transforming revenue structures and attracting technology-focused investors.
Application Insights
Government Security Investments Drive Border Dominance and Accelerate Maritime Surveillance Growth Globally
Border surveillance represents the leading application segment, accounting for over 30% of total revenue, largely due to sustained government investment priorities worldwide. Both developed and emerging economies continue to allocate substantial budgets toward strengthening border security in response to rising transnational threats, illegal migration, and smuggling activities. Large-scale initiatives across regions such as North America, Europe, South Asia, and the Middle East involve extensive deployment of fixed surveillance infrastructure, including thermal imaging towers, night vision cameras, and integrated sensor networks. These systems require continuous upgrades, maintenance, and technology refresh cycles, ensuring stable, long-term procurement demand. Importantly, border security budgets remain resilient across political administrations, providing manufacturers with predictable, multiyear contracts and strong revenue visibility.
In contrast, maritime and coastal surveillance is the fastest-growing application segment, projected to expand at a CAGR of 9.7%. Growth is driven by naval modernization programs, rising concerns around piracy, illegal trafficking, and fisheries protection, as well as the enforcement of exclusive economic zones. Increasing port security upgrades, climate-induced maritime disputes, and geopolitical competition further accelerate demand. Additionally, commercial shipping, search and rescue operations, and humanitarian monitoring initiatives are creating new opportunities for advanced thermal and night vision surveillance technologies.
Regional Insights and Trends
North America Leads Global Night Vision Market Through Defense Spending, Innovation, and Regulation
North America remains the dominant region in the global night vision devices market, accounting for over 35% of total revenue. This leadership is supported by strong defense budgets, a highly advanced manufacturing ecosystem, and regulatory frameworks that emphasize national security and technological innovation. The United States alone contributes nearly 28% of global market revenue, driven by sustained Department of Defense procurement, ongoing military modernization programs, and widespread adoption by federal, state, and local law enforcement agencies.
The North American market is valued at approximately US$ 3.4-3.6 billion in 2026 and is projected to reach US$ 5.8-6.2 billion by 2033, growing at a CAGR of around 8.2%. While this growth rate is slightly below the global average due to market maturity, Canada and Mexico are emerging as secondary markets, supported by rising defense and border security investments.
Key growth drivers include replacement of aging third-generation equipment with advanced fourth-generation thermal systems, expanding use of thermal imaging in law enforcement and civilian security, and increased focus on critical infrastructure protection. Additionally, ITAR regulations strengthen regional manufacturers’ positions, while rising private equity and venture capital investments are accelerating innovation beyond traditional defense applications.
Asia Pacific Thermal Imaging Market Accelerates Through Defense Modernization And Expanding Civil Applications
Asia Pacific is the fastest-growing regional market, registering a robust 9.6% CAGR, driven by accelerated defense modernization across China, India, Japan, and ASEAN countries, alongside rising adoption in commercial and civil security applications. Manufacturing cost advantages and the region’s strong concentration of semiconductor and sensor production further enhance supply chain efficiency, making Asia Pacific increasingly attractive for global manufacturers.
The regional market is valued at approximately US$ 2.8-3.0 billion in 2026 and is projected to reach US$ 5.8-6.4 billion by 2033, significantly outpacing the global average growth rate. China dominates with an estimated 35-40% market share, supported by aggressive military upgrades and strong domestic sensor manufacturing capabilities.
Defense spending exceeding US$ 230 billion annually in China, India’s large-scale border security modernization, and Japan and South Korea’s focus on precision thermal imaging for maritime and island defense collectively underpin demand. ASEAN countries, while smaller in absolute spending, are witnessing a rapid growth of 12-14% CAGR as regional security investments expand.
Beyond defense, growth is reinforced by geopolitical tensions, maritime security requirements, and rising urbanization. Expanding smart city projects, healthcare applications, and industrial uses are pushing adoption into new domains. A relatively flexible regulatory environment, especially in China, India, and ASEAN, supports indigenous development, cost-competitive manufacturing, and faster commercialization, positioning the Asia Pacific as a global growth engine for thermal imaging technologies.
Night Vision Devices Market Competitive Landscape
The night vision devices market exhibits a moderately concentrated competitive structure, with three to four major defense contractors accounting for nearly 55-60% of global revenue. These leading companies benefit from entrenched government relationships, long-term defense contracts, strict compliance with military specifications, and vertically integrated supply chains that reinforce durable competitive advantages. As a result, the defense procurement segment remains highly consolidated, protected by significant barriers to entry, extended qualification cycles, and continual technology differentiation.
Alongside this mature core, the market is witnessing the rapid expansion of a commercial and civilian segment characterized by fragmented competition and a growing number of new entrants. This emerging segment is driven by applications such as outdoor recreation, surveillance, security, and automotive assistance, where price sensitivity is higher and product lifecycles are shorter. Intense competition, particularly from cost-focused Asian manufacturers, is accelerating innovation while exerting downward pressure on pricing. Manufacturing capabilities remain concentrated across North America, Europe, and Japan, supporting incumbent leadership in high-performance systems. However, gradual production decentralization toward Asia is reshaping cost structures and introducing disruption risks. Overall, the market reflects a “mature core with an emerging periphery,” combining stable defense demand.
Key Industry Developments
- In November 2025, Iris Innovations announced the launch of Photon, a compact ultra-low-light 4K night vision camera aimed at improving safe nighttime navigation by making advanced marine night vision accessible to a broader boating audience.
- On 12 September 2025, Theon International Plc unveiled its new NYX-BiNOD night vision binocular at the DSEI London 2025 Exhibition, introducing a production-ready, state-of-the-art system engineered to fully comply with stringent U.S. Army program specifications for defense and security applications.
- In April 2025, researchers at Massachusetts Institute of Technology developed an ultrathin electronic “skin” capable of sensing heat and other signals, a breakthrough innovation with the potential to significantly reduce the weight and bulk of conventional night-vision goggles and scopes.
- In 2023, Cambridge-based Thermoteknix Systems launched the Fused Night Vision Goggle with Augmented Reality (FNVG-AR) at the DSEI 2023 defence exhibition in London, introducing a lightweight fused binocular NVG integrating white phosphor night vision tubes with a high-resolution thermal imager and advanced optical sensor fusion.
Companies Covered in Night Vision Devices Market
- L-3 Technologies
- ITT Inc.
- Elbit Systems
- Thales Group
- Hensoldt
- Iris Innovations Ltd
- Safran Electronics & Defense
- Hikvision Digital Technology
- Dahua Technology
- FLIR Systems
- Axis Communications
- Pulsar
- Tele-Lux Electronics
- Raytheon Technologies
- Leonardo S.p.A.
- DRS Technologies
- Other Market Players
Frequently Asked Questions
The Night Vision Devices market is estimated to be valued at US$ 9.6 Bn in 2026.
The key demand driver for the Night Vision Devices market is the continuous modernization of military and homeland security forces, driven by rising geopolitical tensions, border surveillance needs, and asymmetric warfare scenarios.
In 2026, the North America region will dominate the market with an exceeding 35% revenue share in the global Night Vision Devices market.
Among applications, border surveillance has the highest preference, capturing beyond 30% of the market revenue share in 2026, surpassing other applications.
L-3 Technologies, Iris Innovations Ltd, ITT Inc., Elbit Systems, Thales Group Hensoldt, Safran Electronics & Defense, and Hikvision Digital Technology. There are a few leading players in the Night Vision Devices market.


