


- Executive Summary
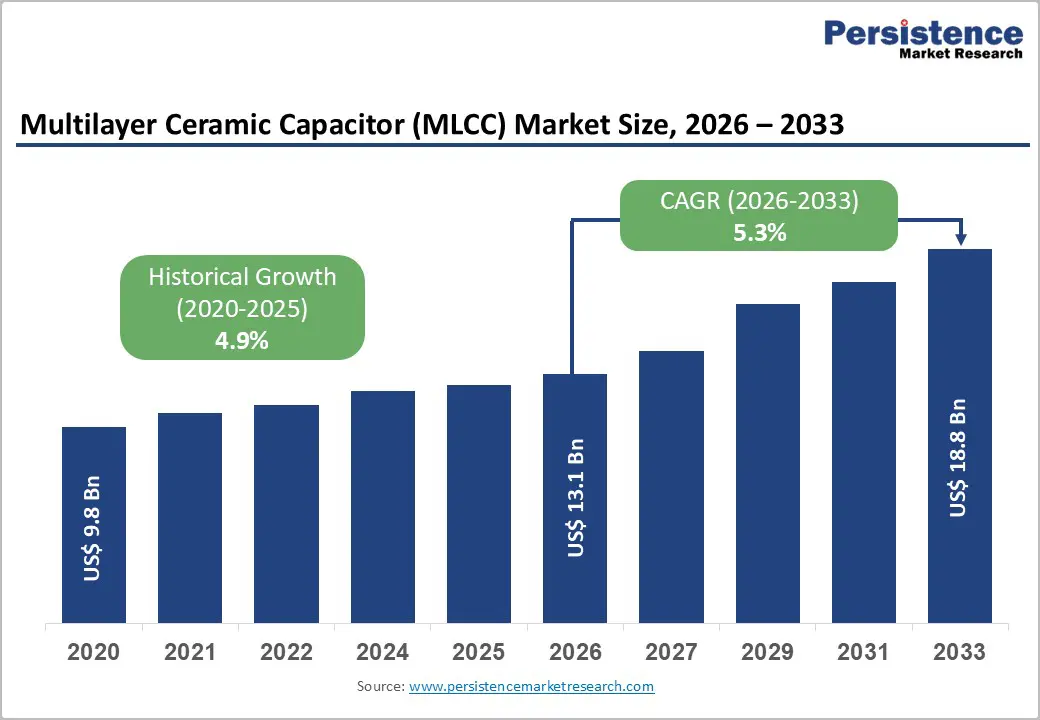
- Global Multilayer Ceramic Capacitor (MLCC) Market Snapshot 2026 and 2033
- Market Opportunity Assessment, 2026-2033, US$ Bn
- Key Market Trends
- Industry Developments and Key Market Events
- Demand Side and Supply Side Analysis
- PMR Analysis and Recommendations
- Market Overview
- Market Scope and Definitions
- Market Dynamics
- Driver
- Restraint
- Opportunities
- Trends
- Macro-Economic Factors
- Global GDP Outlook
- Global Prison Growth Outlook
- Global Crime Rates by Country
- Global Prison Population by Country
- Global Private Prison Market Growth Outlook
- Other Macro-economic Factors
- Forecast Factors – Relevance and Impact
- COVID-19 Impact Assessment
- Value Added Insights
- Value Chain analysis
- Key Market Players
- Product Adoption Analysis
- Key Promotional Strategies by key players
- PESTLE Analysis
- Porter's Five Forces Analysis
- Regulatory and Technology Landscape
- Price Trend Analysis, 2025
- Region-wise Price Analysis
- Price by Segments
- Price Impact Factors
- Global Multilayer Ceramic Capacitor (MLCC) Market Outlook: Historical (2020 – 2025) and Forecast (2026 – 2033)
- Key Highlights
- Global Multilayer Ceramic Capacitor (MLCC) Market Outlook: Product Type
- Introduction/Key Findings
- Historical Market Size (US$ Bn) and Volume (Units) Analysis by Product Type, 2020-2025
- Current Market Size (US$ Bn) and Volume (Units) Forecast, by Product Type, 2026-2033
- General Capacitor
- Array
- Serial Construction
- Mega Cap
- Others
- Market Attractiveness Analysis: Product Type
- Global Multilayer Ceramic Capacitor (MLCC) Market Outlook: Rated Voltage Range
- Introduction/Key Findings
- Historical Market Size (US$ Bn) and Volume (Units) Analysis by Rated Voltage Range, 2020-2025
- Current Market Size (US$ Bn) and Volume (Units) Forecast, by Rated Voltage Range, 2026-2033
- Low range
- Mid-range
- High range
- Market Attractiveness Analysis: Rated Voltage Range
- Global Multilayer Ceramic Capacitor (MLCC) Market Outlook: Dielectric Type
- Introduction/Key Findings
- Historical Market Size (US$ Bn) and Volume (Units) Analysis by Dielectric Type, 2020-2025
- Current Market Size (US$ Bn) and Volume (Units) Forecast, by Dielectric Type, 2026-2033
- X7R
- X5R
- C0G
- Y5V
- Others
- Market Attractiveness Analysis: Dielectric Type
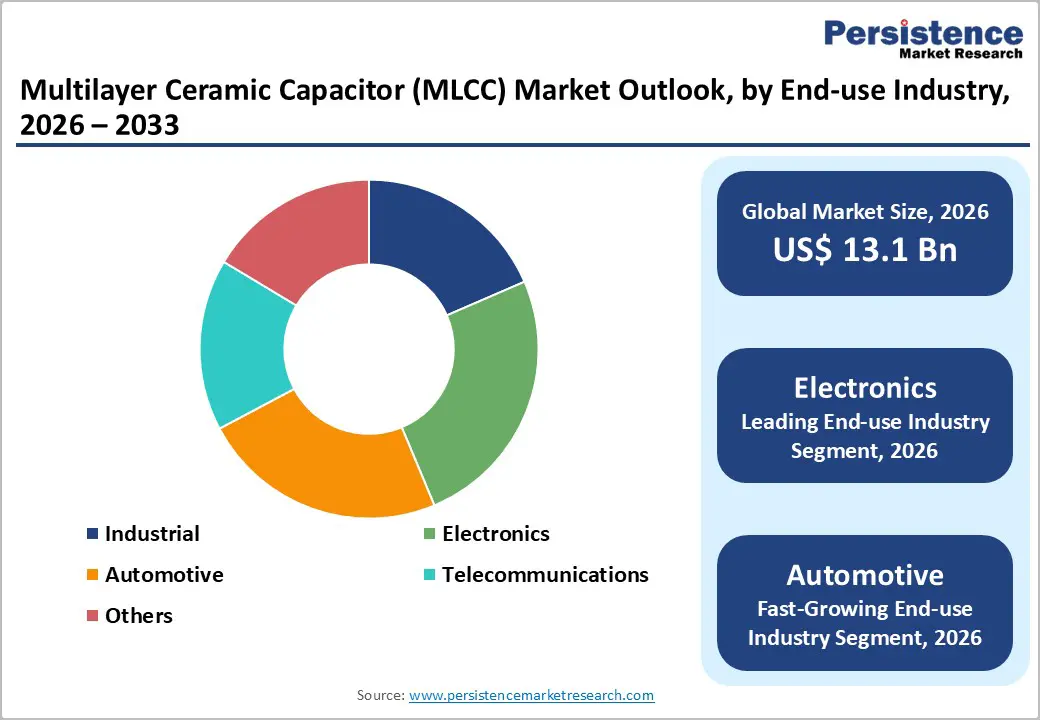
- Global Multilayer Ceramic Capacitor (MLCC) Market Outlook: End-use Industry
- Introduction/Key Findings
- Historical Market Size (US$ Bn) and Volume (Units) Analysis by End-use Industry, 2020-2025
- Current Market Size (US$ Bn) and Volume (Units) Forecast, by End-use Industry, 2026-2033
- Industrial
- Electronics
- Automotive
- Telecommunications
- Others
- Market Attractiveness Analysis: End-use Industry
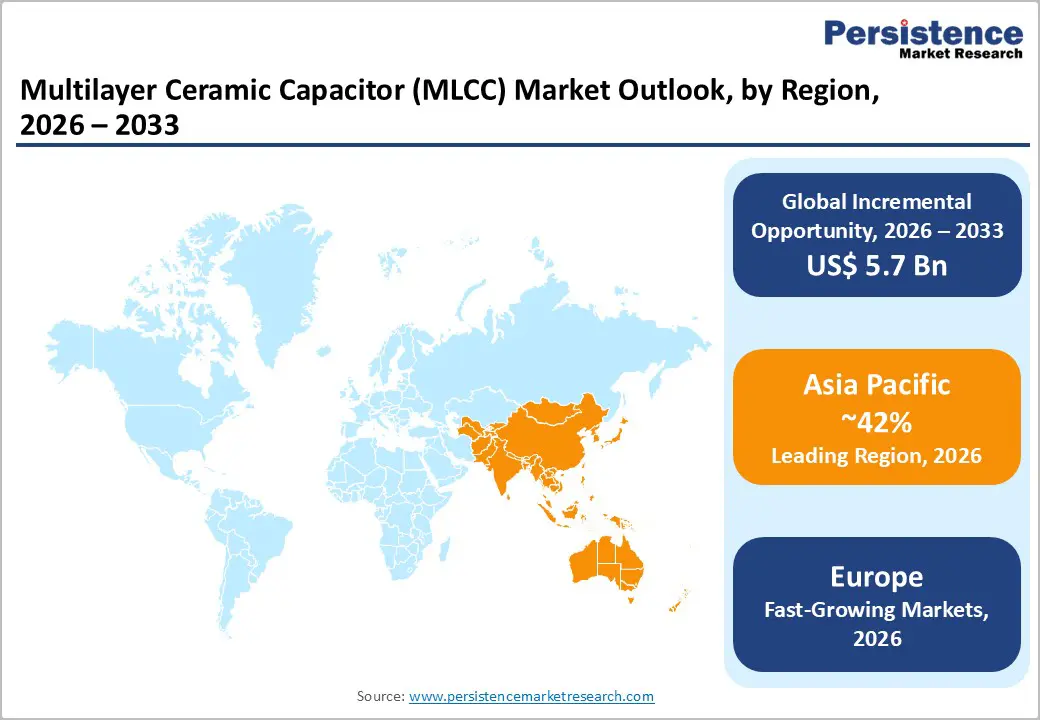
- Global Multilayer Ceramic Capacitor (MLCC) Market Outlook: Region
- Key Highlights
- Historical Market Size (US$ Bn) and Volume (Units) Analysis by Region, 2020-2025
- Current Market Size (US$ Bn) and Volume (Units) Forecast, by Region, 2026-2033
- North America
- Europe
- East Asia
- South Asia & Oceania
- Latin America
- Middle East & Africa
- Market Attractiveness Analysis: Region
- North America Multilayer Ceramic Capacitor (MLCC) Market Outlook: Historical (2020 – 2025) and Forecast (2026 – 2033)
- Key Highlights
- Pricing Analysis
- North America Market Size (US$ Bn) and Volume (Units) Forecast, by Country, 2026-2033
- U.S.
- Canada
- North America Market Size (US$ Bn) and Volume (Units) Forecast, by Product Type, 2026-2033
- General Capacitor
- Array
- Serial Construction
- Mega Cap
- Others
- North America Market Size (US$ Bn) and Volume (Units) Forecast, by Rated Voltage Range, 2026-2033
- Low range
- Mid-range
- High range
- North America Market Size (US$ Bn) and Volume (Units) Forecast, by Dielectric Type, 2026-2033
- X7R
- X5R
- C0G
- Y5V
- Others
- North America Market Size (US$ Bn) and Volume (Units) Forecast, by End-use Industry, 2026-2033
- Industrial
- Electronics
- Automotive
- Telecommunications
- Others
- Europe Multilayer Ceramic Capacitor (MLCC) Market Outlook: Historical (2020 – 2025) and Forecast (2026 – 2033)
- Key Highlights
- Pricing Analysis
- Europe Market Size (US$ Bn) and Volume (Units) Forecast, by Country, 2026-2033
- Germany
- Italy
- France
- U.K.
- Spain
- Russia
- Rest of Europe
- Europe Market Size (US$ Bn) and Volume (Units) Forecast, by Product Type, 2026-2033
- General Capacitor
- Array
- Serial Construction
- Mega Cap
- Others
- Europe Market Size (US$ Bn) and Volume (Units) Forecast, by Rated Voltage Range, 2026-2033
- Low range
- Mid-range
- High range
- Europe Market Size (US$ Bn) and Volume (Units) Forecast, by Dielectric Type, 2026-2033
- X7R
- X5R
- C0G
- Y5V
- Others
- Europe Market Size (US$ Bn) and Volume (Units) Forecast, by End-use Industry, 2026-2033
- Industrial
- Electronics
- Automotive
- Telecommunications
- Others
- East Asia Multilayer Ceramic Capacitor (MLCC) Market Outlook: Historical (2020 – 2025) and Forecast (2026 – 2033)
- Key Highlights
- Pricing Analysis
- East Asia Market Size (US$ Bn) and Volume (Units) Forecast, by Country, 2026-2033
- China
- Japan
- South Korea
- East Asia Market Size (US$ Bn) and Volume (Units) Forecast, by Product Type, 2026-2033
- General Capacitor
- Array
- Serial Construction
- Mega Cap
- Others
- East Asia Market Size (US$ Bn) and Volume (Units) Forecast, by Rated Voltage Range, 2026-2033
- Low range
- Mid-range
- High range
- East Asia Market Size (US$ Bn) and Volume (Units) Forecast, by Dielectric Type, 2026-2033
- X7R
- X5R
- C0G
- Y5V
- Others
- East Asia Market Size (US$ Bn) and Volume (Units) Forecast, by End-use Industry, 2026-2033
- Industrial
- Electronics
- Automotive
- Telecommunications
- Others
- South Asia & Oceania Multilayer Ceramic Capacitor (MLCC) Market Outlook: Historical (2020 – 2025) and Forecast (2026 – 2033)
- Key Highlights
- Pricing Analysis
- South Asia & Oceania Market Size (US$ Bn) and Volume (Units) Forecast, by Country, 2026-2033
- India
- Southeast Asia
- ANZ
- Rest of SAO
- South Asia & Oceania Market Size (US$ Bn) and Volume (Units) Forecast, by Product Type, 2026-2033
- General Capacitor
- Array
- Serial Construction
- Mega Cap
- Others
- South Asia & Oceania Market Size (US$ Bn) and Volume (Units) Forecast, by Rated Voltage Range, 2026-2033
- Low range
- Mid-range
- High range
- South Asia & Oceania Market Size (US$ Bn) and Volume (Units) Forecast, by Dielectric Type, 2026-2033
- X7R
- X5R
- C0G
- Y5V
- Others
- South Asia & Oceania Market Size (US$ Bn) and Volume (Units) Forecast, by End-use Industry, 2026-2033
- Industrial
- Electronics
- Automotive
- Telecommunications
- Others
- Latin America Multilayer Ceramic Capacitor (MLCC) Market Outlook: Historical (2020 – 2025) and Forecast (2026 – 2033)
- Key Highlights
- Pricing Analysis
- Latin America Market Size (US$ Bn) and Volume (Units) Forecast, by Country, 2026-2033
- Brazil
- Mexico
- Rest of LATAM
- Latin America Market Size (US$ Bn) and Volume (Units) Forecast, by Product Type, 2026-2033
- General Capacitor
- Array
- Serial Construction
- Mega Cap
- Others
- Latin America Market Size (US$ Bn) and Volume (Units) Forecast, by Rated Voltage Range, 2026-2033
- Low range
- Mid-range
- High range
- Latin America Market Size (US$ Bn) and Volume (Units) Forecast, by Dielectric Type, 2026-2033
- X7R
- X5R
- C0G
- Y5V
- Others
- Latin America Market Size (US$ Bn) and Volume (Units) Forecast, by End-use Industry, 2026-2033
- Industrial
- Electronics
- Automotive
- Telecommunications
- Others
- Middle East & Africa Multilayer Ceramic Capacitor (MLCC) Market Outlook: Historical (2020 – 2025) and Forecast (2026 – 2033)
- Key Highlights
- Pricing Analysis
- Middle East & Africa Market Size (US$ Bn) and Volume (Units) Forecast, by Country, 2026-2033
- GCC Countries
- South Africa
- Northern Africa
- Rest of MEA
- Middle East & Africa Market Size (US$ Bn) and Volume (Units) Forecast, by Product Type, 2026-2033
- General Capacitor
- Array
- Serial Construction
- Mega Cap
- Others
- Middle East & Africa Market Size (US$ Bn) and Volume (Units) Forecast, by Rated Voltage Range, 2026-2033
- Low range
- Mid-range
- High range
- Middle East & Africa Market Size (US$ Bn) and Volume (Units) Forecast, by Dielectric Type, 2026-2033
- X7R
- X5R
- C0G
- Y5V
- Others
- Middle East & Africa Market Size (US$ Bn) and Volume (Units) Forecast, by End-use Industry, 2026-2033
- Industrial
- Electronics
- Automotive
- Telecommunications
- Others
- Competition Landscape
- Market Share Analysis, 2025
- Market Structure
- Competition Intensity Mapping
- Competition Dashboard
- Company Profiles
- Murata Manufacturing Co., Ltd.
- Company Overview
- Product Portfolio/Offerings
- Key Financials
- SWOT Analysis
- Company Strategy and Key Developments
- Samsung Electro‑Mechanics Co., Ltd.
- TDK Corporation
- Taiyo Yuden Co., Ltd.
- Yageo Corporation
- Kyocera AVX Components
- Vishay Intertechnology, Inc.
- Walsin Technology Corporation
- KEMET Corporation
- Holy Stone Enterprise Co., Ltd.
- Samwha Capacitor Group
- Johanson Dielectrics
- Darfon Electronics Corp.
- Guangdong Fenghua Advanced Technology
- Eyang Technology Development Co., Ltd.
- Murata Manufacturing Co., Ltd.
- Appendix
- Research Methodology
- Research Assumptions
- Acronyms and Abbreviations

Loading page data
Please wait a moment


