


- Executive Summary
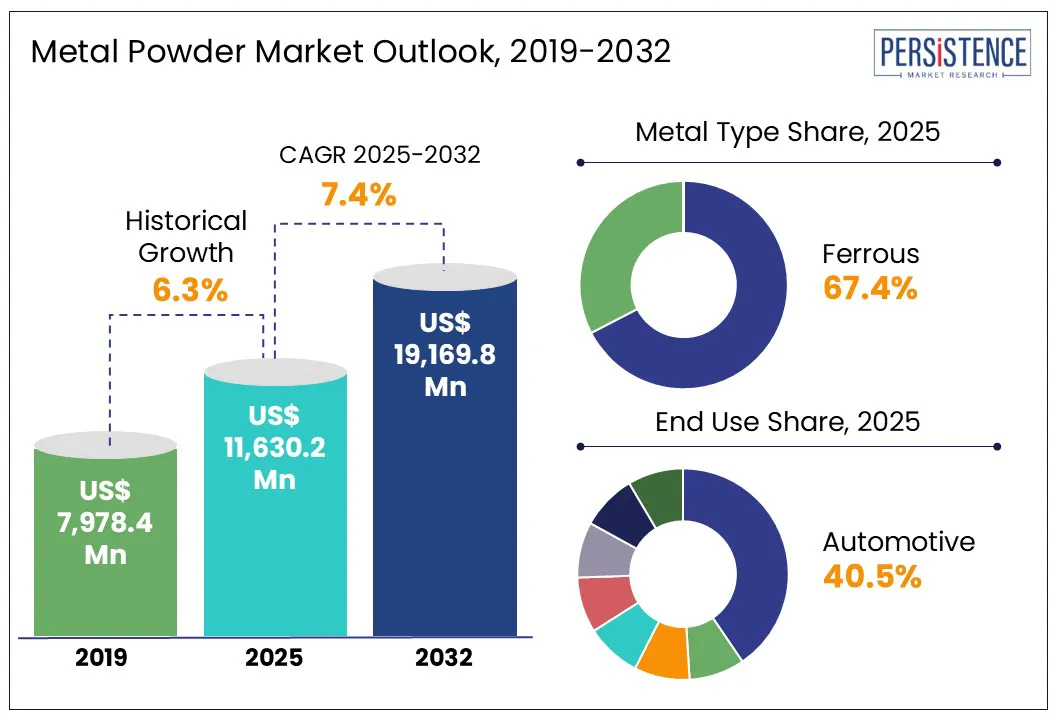
- Global Metal Powder Market Snapshot, 2025 and 2032
- Market Opportunity Assessment, 2025 - 2032, US$ Bn
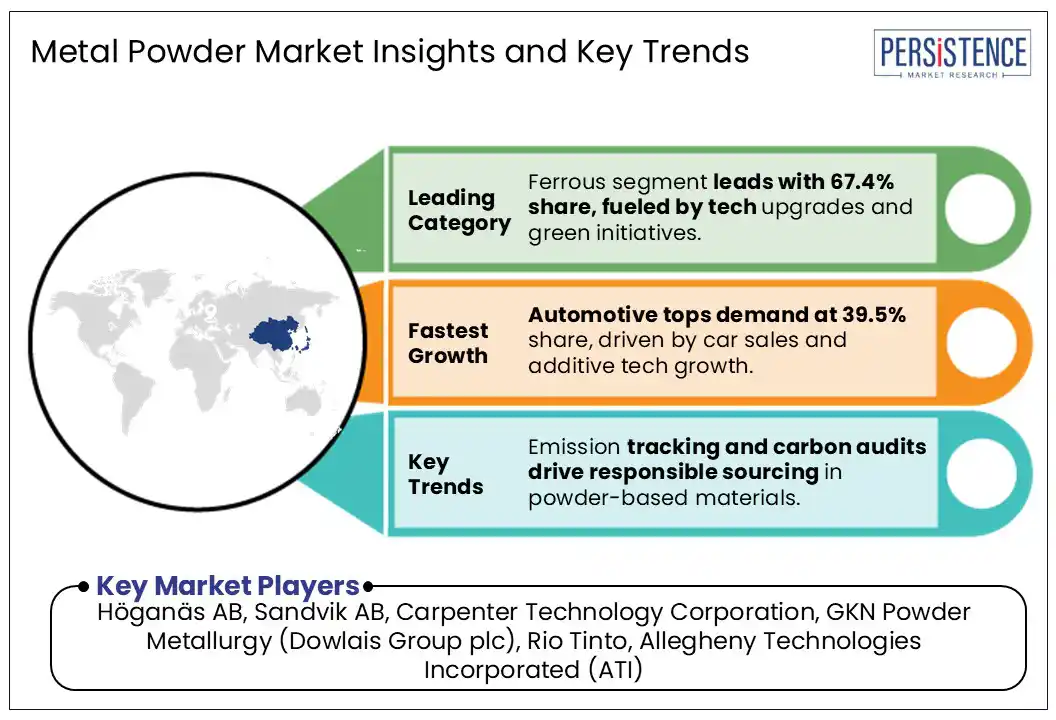
- Key Market Trends
- Future Market Projections
- Premium Market Insights
- Industry Developments and Key Market Events
- PMR Analysis and Recommendations
- Market Overview
- Market Scope and Definition
- Market Dynamics
- Drivers
- Restraints
- Opportunity
- Challenges
- Key Trends
- Product Lifecycle Analysis
- Global Parent Market Overview
- Metal Powder Market: Value Chain
- List of Raw Production Method Supplier
- List of Manufacturers
- List of Distributors
- List of End Uses
- Profitability Analysis
- Forecast Factors - Relevance and Impact
- Covid-19 Impact Assessment
- PESTLE Analysis
- Porter Five Force’s Analysis
- Geopolitical Tensions: Market Impact
- Regulatory and Production Method Landscape
- 3.1. Macro-Economic Factors
- Global Sectorial Outlook
- Global GDP Growth Outlook
- Other Macro-economic Factors
- Price Trend Analysis, 2019 - 2032
- Key Highlights
- Key Factors Impacting Product Prices
- Prices By Metal Type/Production Method/End Use
- Regional Prices and Product Preferences
- Global Metal Powder Market Outlook: Historical (2019 - 2024) and Forecast (2025 - 2032)
- Key Highlights
- Market Size and Y-o-Y Growth
- Absolute $ Opportunity
- Market Size (US$ Bn) Volume (Tons) Analysis and Forecast
- Historical Market Size Analysis, 2019-2023
- Current Market Size Forecast, 2024-2031
- Global Metal Powder Market Outlook: Type
- Introduction / Key Findings
- Historical Market Size (US$ Bn) and Volume (Tons) Analysis By Metal Type, 2019 - 2024
- Current Market Size (US$ Bn) and Volume (Tons) Forecast By Metal Type, 2025 - 2032
- Ferrous
- Non-Ferrous
- Market Attractiveness Analysis: Metal Type
- Global Metal Powder Market Outlook: Production Method
- Introduction / Key Findings
- Historical Market Size (US$ Bn) and Volume (Tons) Analysis By Production Method, 2019 - 2024
- Current Market Size (US$ Bn) and Volume (Tons) Forecast By Production Method, 2025 - 2032
- Atomization
- Reduction
- Electrolysis
- Mechanical Milling
- Chemical Methods
- Misc.
- Market Attractiveness Analysis: Production Method
- Global Metal Powder Market Outlook: End Use
- Introduction / Key Findings
- Historical Market Size (US$ Bn) and Volume (Tons) Analysis By End Use, 2019 - 2024
- Current Market Size (US$ Bn) and Volume (Tons) Forecast By End Use, 2025 - 2032
- Automotive
- Aerospace & Defense
- Additive Manufacturing / 3D Printing
- Construction
- Electronics & Semiconductors
- Medical & Dental
- Industrial Machinery
- Misc.
- Market Attractiveness Analysis: End Use
- Key Highlights
- Global Metal Powder Market Outlook: Region
- Key Highlights
- Historical Market Size (US$ Bn) and Volume (Tons) Analysis By Region, 2019 - 2024
- Current Market Size (US$ Bn) and Volume (Tons) Forecast By Region, 2025 - 2032
- North America
- Europe
- East Asia
- South Asia and Oceania
- Latin America
- Middle East & Africa
- Market Attractiveness Analysis: Region
- North America Metal Powder Market Outlook: Historical (2019 - 2024) and Forecast (2025 - 2032)
- Key Highlights
- Pricing Analysis
- Historical Market Size (US$ Bn) and Volume (Tons) Analysis By Market, 2019 - 2024
- By Country
- By Metal Type
- By Production Method
- By End Use
- Current Market Size (US$ Bn) and Volume (Tons) Forecast By Country, 2025 - 2032
- U.S.
- Canada
- Current Market Size (US$ Bn) and Volume (Tons) Forecast By Metal Type, 2025 - 2032
- Ferrous
- Non-Ferrous
- Current Market Size (US$ Bn) and Volume (Tons) Forecast By Production Method, 2025 - 2032
- Atomization
- Reduction
- Electrolysis
- Mechanical Milling
- Chemical Methods
- Misc.
- Current Market Size (US$ Bn) and Volume (Tons) Forecast By End Use, 2025 - 2032
- Automotive
- Aerospace & Defense
- Additive Manufacturing / 3D Printing
- Construction
- Electronics & Semiconductors
- Medical & Dental
- Industrial Machinery
- Misc.
- Market Attractiveness Analysis
- Europe Metal Powder Market Outlook: Historical (2019 - 2024) and Forecast (2025 - 2032)
- Key Highlights
- Pricing Analysis
- Historical Market Size (US$ Bn) and Volume (Tons) Analysis By Market, 2019 - 2024
- By Country
- By Metal Type
- By Production Method
- By Current Market Size (US$ Bn) and Volume (Tons) Forecast By Country, 2025 - 2032
- Germany
- Italy
- France
- U.K.
- Spain
- Russia
- Rest of Europe
- Current Market Size (US$ Bn) and Volume (Tons) Forecast By Metal Type, 2025 - 2032
- Ferrous
- Non-Ferrous
- Current Market Size (US$ Bn) and Volume (Tons) Forecast By Production Method, 2025 - 2032
- Atomization
- Reduction
- Electrolysis
- Mechanical Milling
- Chemical Methods
- Misc.
- Current Market Size (US$ Bn) and Volume (Tons) Forecast By End Use, 2025 - 2032
- Automotive
- Aerospace & Defense
- Additive Manufacturing / 3D Printing
- Construction
- Electronics & Semiconductors
- Medical & Dental
- Industrial Machinery
- Misc.
- Market Attractiveness Analysis
- East Asia Metal Powder Market Outlook: Historical (2019 - 2024) and Forecast (2025 - 2032)
- Key Highlights
- Pricing Analysis
- Historical Market Size (US$ Bn) and Volume (Tons) Analysis By Market, 2019 - 2024
- By Country
- By Metal Type
- By Production Method
- By End Use
- Current Market Size (US$ Bn) and Volume (Tons) Forecast By Country, 2025 - 2032
- China
- Japan
- South Korea
- Current Market Size (US$ Bn) and Volume (Tons) Forecast By Metal Type, 2025 - 2032
- Ferrous
- Non-Ferrous
- Current Market Size (US$ Bn) and Volume (Tons) Forecast By Production Method, 2025 - 2032
- Atomization
- Reduction
- Electrolysis
- Mechanical Milling
- Chemical Methods
- Misc.
- Current Market Size (US$ Bn) and Volume (Tons) Forecast By End Use, 2025 - 2032
- Automotive
- Aerospace & Defense
- Additive Manufacturing / 3D Printing
- Construction
- Electronics & Semiconductors
- Medical & Dental
- Industrial Machinery
- Misc.
- Market Attractiveness Analysis
- South Asia & Oceania Metal Powder Market Outlook: Historical (2019 - 2024) and Forecast (2025 - 2032)
- Key Highlights
- Pricing Analysis
- Historical Market Size (US$ Bn) and Volume (Tons) Analysis By Market, 2019 - 2024
- By Country
- By Metal Type
- By Production Method
- By End Use
- Current Market Size (US$ Bn) and Volume (Tons) Forecast By Country, 2025 - 2032
- India
- Southeast Asia
- ANZ
- Rest of South Asia & Oceania
- Current Market Size (US$ Bn) and Volume (Tons) Forecast By Metal Type, 2025 - 2032
- Ferrous
- Non-Ferrous
- Current Market Size (US$ Bn) and Volume (Tons) Forecast By Production Method, 2025 - 2032
- Atomization
- Reduction
- Electrolysis
- Mechanical Milling
- Chemical Methods
- Misc.
- Current Market Size (US$ Bn) and Volume (Tons) Forecast By End Use, 2025 - 2032
- Automotive
- Aerospace & Defense
- Additive Manufacturing / 3D Printing
- Construction
- Electronics & Semiconductors
- Medical & Dental
- Industrial Machinery
- Misc.
- Market Attractiveness Analysis
- Latin America Metal Powder Market Outlook: Historical (2019 - 2024) and Forecast (2025 - 2032)
- Key Highlights
- Pricing Analysis
- Historical Market Size (US$ Bn) and Volume (Tons) Analysis By Market, 2019 - 2024
- By Country
- By Metal Type
- By Production Method
- By End Use
- Current Market Size (US$ Bn) and Volume (Tons) Forecast By Country, 2025 - 2032
- Brazil
- Mexico
- Rest of Latin America
- Current Market Size (US$ Bn) and Volume (Tons) Forecast By Metal Type, 2025 - 2032
- Ferrous
- Non-Ferrous
- Current Market Size (US$ Bn) and Volume (Tons) Forecast By Production Method, 2025 - 2032
- Atomization
- Reduction
- Electrolysis
- Mechanical Milling
- Chemical Methods
- Misc.
- Current Market Size (US$ Bn) and Volume (Tons) Forecast By End Use, 2025 - 2032
- Automotive
- Aerospace & Defense
- Additive Manufacturing / 3D Printing
- Construction
- Electronics & Semiconductors
- Medical & Dental
- Industrial Machinery
- Misc.
- Market Attractiveness Analysis
- Middle East & Africa Metal Powder Market Outlook: Historical (2019 - 2024) and Forecast (2025 - 2032)
- Key Highlights
- Pricing Analysis
- Historical Market Size (US$ Bn) and Volume (Tons) Analysis By Market, 2019 - 2024
- By Country
- By Metal Type
- By Production Method
- By End Use
- Current Market Size (US$ Bn) and Volume (Tons) Forecast By Country, 2025 - 2032
- GCC
- South Africa
- Northern Africa
- Rest of Middle East & Africa
- Current Market Size (US$ Bn) and Volume (Tons) Forecast By Metal Type, 2025 - 2032
- Ferrous
- Non-Ferrous
- Current Market Size (US$ Bn) and Volume (Tons) Forecast By Production Method, 2025 - 2032
- Atomization
- Reduction
- Electrolysis
- Mechanical Milling
- Chemical Methods
- Misc.
- Current Market Size (US$ Bn) and Volume (Tons) Forecast By End Use, 2025 - 2032
- Automotive
- Aerospace & Defense
- Additive Manufacturing / 3D Printing
- Construction
- Electronics & Semiconductors
- Medical & Dental
- Industrial Machinery
- Misc.
- Market Attractiveness Analysis
- Competition Landscape
- Market Share Analysis, 2024
- Market Structure
- Competition Intensity Mapping By Market
- Competition Dashboard
- Apparent Production Capacity
- Company Profiles (Details - Overview, Financials, Strategy, Recent Developments)
- GKN PLC (Dowlais Group plc)
- Overview
- Segments and Products
- Key Financials
- Market Developments
- Market Strategy
- Sandvik AB
- Höganäs AB
- Carpenter Technology Corporation
- Rio Tinto
- Allegheny Technologies Incorporated
- MolyWorks Materials Corporation
- POLEMA
- Rusal
- CRS Holdings Inc.
- Liberty House Group Advanced Micro Devices
- GKN PLC (Dowlais Group plc)
- Note: List of companies is not exhaustive in Metal Type. It is subject to further augmentation during course of research
- Appendix
- Research Methodology
- Research Assumptions
- Acronyms and Abbreviations

Loading page data
Please wait a moment


