


- Automotive
- Intercity and Transit Bus Market
Intercity and Transit Bus Market Size, Share, and Growth Forecast 2026 - 2033
Intercity and Transit Bus Market by Bus Type (Intercity Buses, Transit Buses), Propulsion (ICE, Hybrid, Electric), Seating Capacity (Up to 30 Seats, 31-50 Seats, 51-70 Seats, Above 70 Seats), Bus Length (Up to 9 Meters, 9-12 Meters, 12-14 Meters, Above 14 Meters), Powertrain Configuration (Front-engine, Mid-engine, Rear-engine, In-wheel Motor), and Regional Analysis for 2026 - 2033
Intercity and Transit Bus Market Size and Trend Analysis
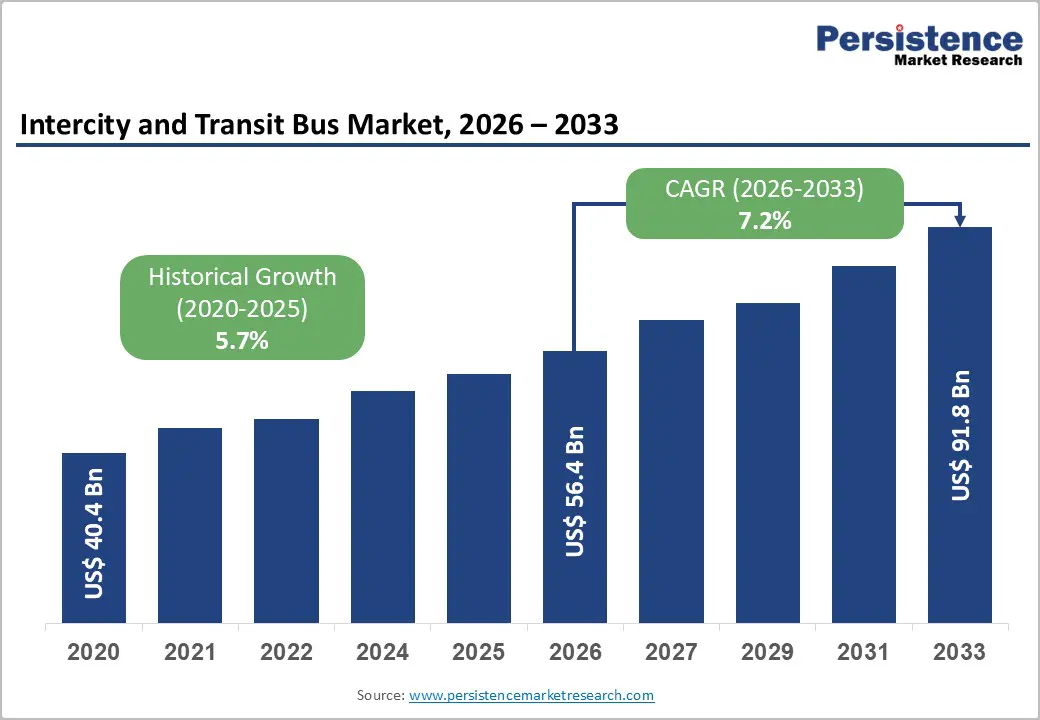
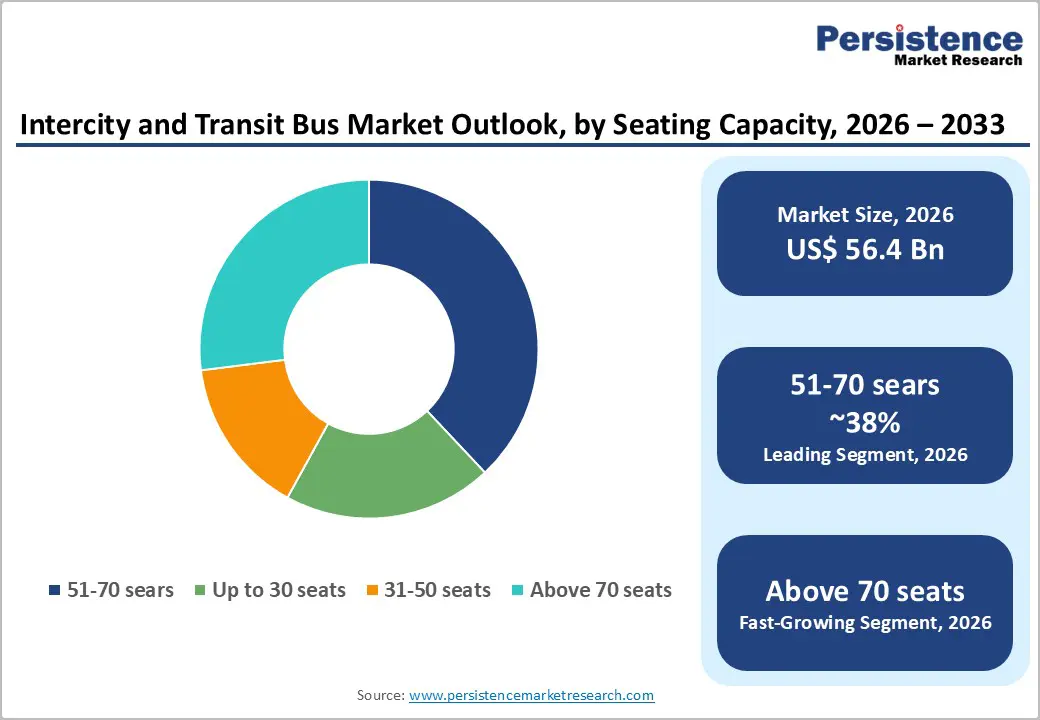
The global intercity and transit bus market size is valued at approximately US$ 56.4 Bn in 2026 and is projected to reach US$ 91.8 Bn by 2033, growing at a CAGR of 7.2% between 2026 and 2033.
This steady expansion is fundamentally driven by escalating public transit investments, rapid urbanization in emerging economies, and the accelerating global shift toward zero-emission bus fleets. Governments across North America, Europe, and the Asia Pacific are committing substantial funds to fleet modernization. The U.S. Federal Transit Administration (FTA) alone announced over US$ 2 billion in bus grants in November 2025, supporting 165 projects across 45 states.
Key Industry Highlights:
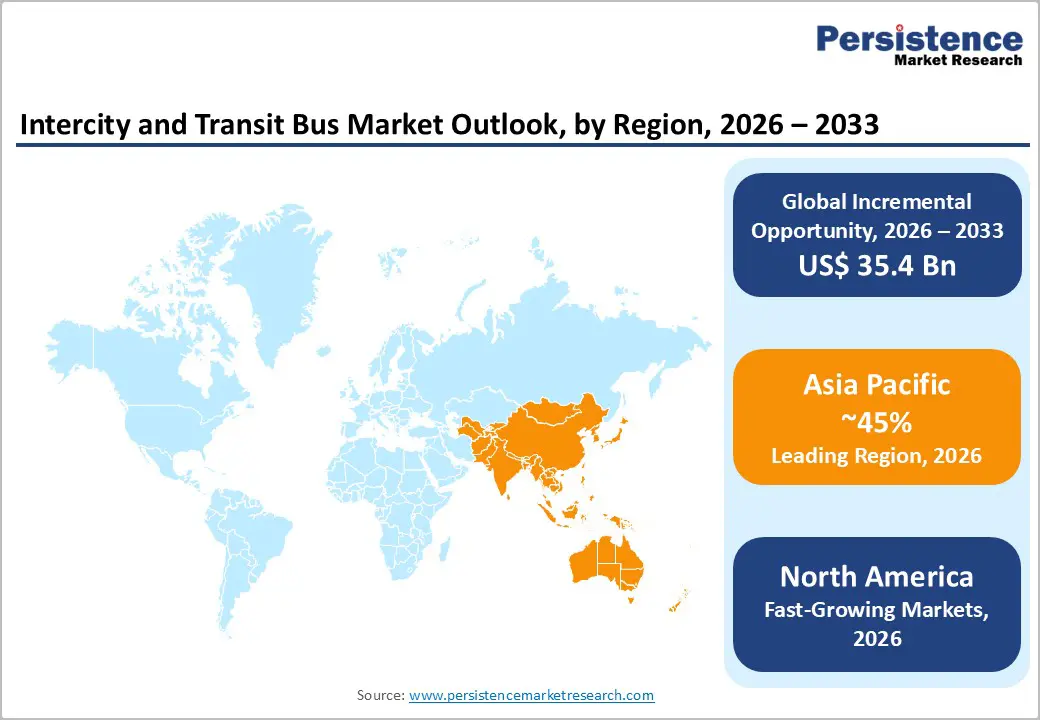
- Leading Region - Asia Pacific dominates the global Intercity and Transit Bus market, accounting for approximately 47% of revenue in 2025, driven by China's near-complete fleet electrification and massive procurement pipelines in India and ASEAN nations.
- Fastest-Growing Region - India is the fastest-growing country market, with electric bus penetration at 5% in FY25 expanding to 10-12% by FY27, backed by INR 10,900 crore in government funding through the PM E-Drive Scheme and a 52,000-bus national target by 2029.
- Dominant Segment - The Transit Buses segment leads with approximately 62% revenue share in 2025, driven by large-scale urban fleet replacement mandates, government subsidies covering 80-90% of procurement costs, and the expansion of zero-emission zones in Europe and North America.
- Fastest-Growing Segment - The Electric propulsion segment is the fastest-growing, with European BEV registrations up +48% in 2025, capturing 60% of the EU city bus market, and Asian production led by BYD and Yutong accounting for 65% of global electric bus output.
- Key Opportunity - Hydrogen fuel cell electric buses present a transformative opportunity for intercity corridors beyond battery-electric range, with 76% growth in FCEV bus deployments in the U.S. in 2023 per CALSTART and pilot programs expanding across Japan, the U.K., and South Korea.
| Key Insights | Details |
|---|---|
| Intercity and Transit Bus Market Size (2026E) | US$ 56.4 Billion |
| Market Value Forecast (2033F) | US$ 91.8 Billion |
| Projected Growth CAGR (2026 - 2033) | 7.2% |
| Historical Market Growth (2020 - 2025) | 5.7% CAGR |
DRO Analysis
Drivers - Surge in Public Transit Infrastructure Investment and Fleet Modernization
One of the most powerful catalysts for the Intercity and Transit Bus market is the unprecedented scale of government-backed public transportation investment worldwide. In the United States, the Infrastructure Investment and Jobs Act (IIJA) provides US$5.5 billion for the Low or No Emission (Low-No) Program and US$ 2 billion for the Buses and Bus Facilities Program over five years. In FY 2025, the Federal Transit Administration (FTA) awarded US$ 2.03 billion to 165 projects across 45 states, covering the purchase of zero-emission and low-emission transit buses and supporting infrastructure.
In Germany, the federal government committed US$ 1.45 billion in 2024 to cover up to 80% of vehicle costs for zero-emission buses. These programs collectively drive large-scale bus procurement cycles, replacing aging diesel fleets with next-generation electric, hybrid, and CNG models across intercity and transit networks.
Rapid Urbanization and Rising Demand for Sustainable Mass Mobility
Accelerating urbanization across Asia Pacific, Latin America, and Africa is generating structural demand for efficient, high-capacity bus-based public transit systems. According to the United Nations, more than 55% of the world's population currently lives in urban areas, a share projected to reach 68% by 2050. China has nearly achieved 100% electrification of municipal bus fleets, with over 500,000 electric buses in operation, while India's PM E-Drive Scheme, approved by the Union Cabinet in September 2024 with an outlay of INR 10,900 crore, aims to deploy 14,028 electric buses across nine major cities within two years.
Battery-electric bus registrations in Europe reached 11,607 units in 2025, a 48% increase over 2024 levels, according to Sustainable Bus. Zero-emission buses captured 60% of the EU city bus market in 2025, reflecting both regulatory pressure and the falling total cost of ownership of electric fleets.
Restraints - High Upfront Acquisition Costs and Charging Infrastructure Gaps
Despite strong policy support, high initial procurement costs for electric and hybrid buses remain a significant restraint, particularly in developing economies with limited fiscal headroom. Electric buses typically carry a 30-60% cost premium over conventional diesel equivalents at the time of purchase, with a standard 12-meter battery-electric bus often priced at US$ 400,000-600,000 compared to US$ 150,000-250,000 for diesel alternatives.
Simultaneously, the buildout of depot-level charging infrastructure, particularly megawatt-level chargers and smart load management systems, requires substantial capital outlays. In many ASEAN and African cities, grid constraints and unreliable electricity supply compound the infrastructure challenge, slowing fleet electrification and delaying large-scale transit bus deployments.
Supply Chain Concentration and Raw Material Volatility
The global Intercity and Transit Bus market faces structural supply chain risks arising from geographic concentration in the production of key battery materials. China dominates the processing of lithium, cobalt, graphite, and manganese materials essential for battery-electric buses and controls approximately 85% of global EV battery manufacturing capacity.
Regulatory actions, including the U.S. Trade Representative's 100% tariffs on Chinese-made electric buses and the EU's scrutiny of subsidized Chinese bus imports, are reshaping procurement patterns and elevating costs for transit agencies. Price volatility in lithium carbonate and nickel markets, which surged and then corrected sharply between 2022 and 2024, creates budgeting uncertainty for fleet operators committing to multi-year electrification programs.
Market Opportunities
Electric Bus Adoption in Emerging Economies and Government Procurement Programs
Emerging economies present the most compelling near-term opportunity for Intercity and Transit Bus market participants. India's combined policy framework including the PM-eBus Sewa scheme (targeting 10,000 e-buses across 169 cities), the PM E-Drive Scheme (targeting 14,028 buses within two years), and the longer-term National Electric Bus Program (NEBP) administered by Convergence Energy Services Limited (CESL), targeting 50,000 electric buses by 2030, collectively represents one of the world's largest public bus procurement pipelines.
Electric bus penetration in India stood at only 5% in FY25, projected to reach 10-12% of new bus sales by FY27, per India Ratings and Research, signaling enormous headroom for growth. Similarly, Southeast Asia, with governments in Indonesia, Malaysia, Thailand, and Vietnam launching zero-emission transit programs, and Latin America (where Santiago, Chile had approximately 2,550 operational electric buses by mid-2025) are rapidly expanding procurement volumes.
Hydrogen Fuel Cell Buses and Next-Generation Intercity Electrification
The commercialization of hydrogen fuel cell electric buses (FCEBs) for intercity and heavy-duty transit routes represents a high-growth opportunity for bus OEMs and technology partners. Hydrogen buses offer longer range and faster refueling than battery-electric equivalents, critical advantages for intercity operators running daily duty cycles exceeding 300 km.
According to CALSTART, the U.S. witnessed a 76% increase in fuel cell bus deployments in 2023. The Rochester Regional Transit Service deployed the first hydrogen fuel cell buses in New York State in November 2024, with plans to expand to 12 units by late 2025. London's zero-emission bus expansion included Wrightbus StreetDeck Hydroliner FCEVs, and Tokyo operates over 100 fuel-cell buses.
Category-wise Insights
Bus Type Analysis
The Transit Buses segment leads the global Intercity and Transit Bus market, accounting for approximately 62% of total revenue in 2026, driven by the scale and urgency of urban public transportation fleet replacement programs. Transit buses operate on fixed urban routes at high daily frequency, making them the primary target for government-led zero-emission fleet procurement initiatives.
Programs such as the U.S. FTA's Low-No Emission Program, the EU's Clean Bus Deployment Initiative, and India's PM-eBus Sewa all specifically prioritize urban transit buses over intercity coaches. Battery-electric bus registrations in Europe alone hit 11,607 units in 2025, with zero-emission buses capturing 60% of the EU city bus market.
Propulsion Insights
The ICE (Internal Combustion Engine) propulsion segment retains the largest revenue share, approximately 58% in 2026, primarily reflecting the installed base of diesel and CNG buses still operating across Asia Pacific, Latin America, the Middle East, and Africa, where fleet electrification is at an earlier stage. Tata Motors received fresh diesel and CNG bus orders from Indian state transport undertakings as recently as March 2024, underscoring the enduring demand for conventional buses in price-sensitive markets.
CNG buses also retain appeal as they are approximately 30-40% cheaper upfront than battery-electric equivalents. Nevertheless, the Electric propulsion segment is decisively the fastest-growing, with registrations in Europe up 48% in 2025 and China maintaining near-complete electrification of its municipal fleets.
Seating Capacity Insights
The 51-70 seats seating capacity segment dominates the global Intercity and Transit Bus market, commanding the largest revenue share at approximately 38% in 2026. This configuration offers an optimal balance between passenger capacity, operational flexibility, and route suitability, serving both standard transit routes and intercity corridors without requiring articulated configurations that limit access in urban environments.
Volvo Buses highlighted strong demand for its 55-seater bus platforms across Europe as recently as September 2023. The segment's footprint is reinforced by government fleet specifications that commonly favor 51-70 seat single-deckers for urban and regional transit contracts in Europe, India, and Southeast Asia.
Bus Length Insights
The 9-12 meters bus length segment leads the global market, accounting for an estimated 42% of revenue in 2025, owing to its versatility across urban, suburban, and select intercity routes. Buses in this length range accommodate 40-70 passengers with a typical range of 240-400 km on a single charge, sufficient for full-day urban duty cycles without mid-route charging.
The UK's Zero Emission Bus Regional Areas (ZEBRA) scheme specifically prioritizes 9- to 12-meter battery-electric models for large-scale fleet deployment. This segment is reinforced by government fleet specifications across the EU, India, Southeast Asia, and North America, which favor standard 12-meter single-deckers for transit corridor contracts.
Powertrain Configuration Insights
The Rear-engine powertrain configuration holds a dominant share in the global Intercity and Transit Bus market, accounting for approximately 48% of revenue in 2025. Rear-engine layouts offer superior weight distribution, reduced noise in the passenger cabin, and improved front-axle accessibility for low-floor bus designs that comply with ADA (Americans with Disabilities Act) and equivalent European accessibility mandates. Daimler Buses' eCitaro electric city bus and Volvo Buses' 7900 Electric and 8900 Electric platforms utilize rear-engine or rear-pack configurations optimized for urban transit.
Regional Analysis
Asia Pacific Intercity Bus and Transit Market Trends
Asia Pacific dominates the global Intercity and Transit Bus market, holding approximately 47% of global revenue in 2025, anchored by China's commanding position as the world's largest bus manufacturer and operator. China has electrified nearly 100% of its municipal bus fleets, with over 500,000 electric buses in operation.
India is the fastest-growing country market in the region, with electric bus penetration at only 5% as of FY25, providing enormous room for expansion. The PM E-Drive Scheme (approved September 2024) targets 14,028 e-buses, while PM-eBus Sewa targets 10,000 buses across 169 cities. Collectively, India's programs are backed by INR 7,500 crore for 52,000 electric buses by 2029. Japan leads in fuel cell bus deployment, with Tokyo operating over 100 hydrogen fuel-cell buses.
North America Intercity Bus and Transit Market Trends
The United States leads North America's Intercity and Transit Bus market, underpinned by a robust federal funding framework. The Infrastructure Investment and Jobs Act (IIJA) provides a total of US$ 7.5 billion across the Low-No Emission Program and Buses and Bus Facilities Program over five years, with the Federal Transit Administration (FTA) awarding US$ 2.03 billion to 165 projects across 45 states in November 2025 alone.
Canada complements U.S. leadership through its Zero-Emission Transit Fund, with LG Energy Solution's NextStar Energy joint venture plant in Ontario expanding production to include energy storage system batteries, also supporting transit bus supply chains. The U.S. saw a 12% surge in zero-emission bus adoption in 2023, according to CALSTART, with orders for electric trucks and buses expected to reach 54,000 units by 2025.
Europe Intercity Bus and Transit Market Trends
Europe is driving some of the world's most ambitious bus electrification mandates, with the EU's 'Fit for 55' package and Clean Vehicles Directive compelling member states to procure escalating shares of zero-emission buses. Battery-electric bus registrations across Europe reached 11,607 units in 2025 a +48% year-on-year jump, with zero-emission buses capturing 60% of the EU city bus market. Germany committed US$ 1.45 billion in 2024, covering up to 80% of bus acquisition costs and 40% of charging infrastructure expenses.
Italy saw over 1,200 BEV buses registered in 2025, comprising 30% of its total bus market, while Spain is emerging as a manufacturing hub following the Stellantis-CATL €4.1 billion LFP battery plant announcement. Solaris Bus & Coach (Poland) signed a contract for 40 articulated electric buses to Leipzig in September 2025, reflecting Central Europe's growing role as a production and supply hub.
Competitive Landscape
The global Intercity and Transit Bus market is moderately consolidated at the top, with a handful of dominant Chinese, European, and Indian OEMs capturing most volumes, while a broader tier of regional manufacturers serves local markets. Chinese players BYD and Yutong lead in electric bus volume globally, leveraging vertically integrated supply chains, cost-competitive battery sourcing from CATL, and aggressive export strategies across Africa, Latin America, Southeast Asia, and Europe.
European players including Daimler Buses, Volvo Group, Scania, and Solaris Bus & Coach differentiate through premium engineering, regulatory compliance expertise, and long-standing relationships with European transit authorities.
Key Market Developments
- In February 2026, LeafyBus partnered with Eicher Trucks & Buses to deploy 100 electric intercity sleeper buses across key national corridors in India. The collaboration focuses on reducing operating emissions while scaling sustainable long-distance mobility.
- In January 2026, Dubai’s Roads and Transport Authority placed an order for 40 electric buses from Zhongtong as part of its broader 735-vehicle public transport renewal program. The procurement supports Dubai’s clean mobility strategy and reflects increasing adoption of electric transit buses in the Middle East, driven by sustainability targets and urban air-quality improvement initiatives.
Companies Covered in Intercity and Transit Bus Market
- Tata Motors
- Daimler Buses
- Volvo Group
- BYD Co., Ltd.
- Scania AB
- Yutong Bus Co., Ltd.
- Alexander Dennis Limited
- Iveco Bus
- MAN Truck & Bus
- Solaris Bus & Coach
Frequently Asked Questions
The global Intercity and Transit Bus market is estimated to be valued at US$ 56.4 Billion in 2026 and is projected to reach US$ 91.8 Billion by 2033, registering a CAGR of 7.2% during the forecast period 2026 - 2033.
Key demand drivers include government-funded fleet modernization programs with the U.S. FTA awarding over US$ 2 billion in November 2025 for 165 bus projects rapid urbanization particularly across Asia Pacific, and the global transition to zero-emission buses. Europe saw battery-electric bus registrations surge +48% in 2025, capturing 60% of the EU city bus market, per Sustainable Bus.
The ICE (Internal Combustion Engine) propulsion segment encompassing diesel and CNG buses currently leads with approximately 58% revenue share in 2025, reflecting the large installed base in price-sensitive markets across Asia, Latin America, Africa, and the Middle East.
Asia Pacific leads the global Intercity and Transit Bus market with approximately 47% of revenue in 2025. China is the dominant country, accounting for approximately 28-29% of global revenue, driven by its 500,000+ electric bus fleet, near-complete municipal fleet electrification, and leadership by Yutong Bus (RMB 37.218 billion 2024 revenue, 46,918 buses sold) and BYD Co., Ltd.
The leading companies operating in the global Intercity and Transit Bus market include Yutong Bus Co., Ltd., BYD Co., Ltd., Volvo Group (Volvo Buses), Daimler Buses, Tata Motors, Scania AB, MAN Truck & Bus, Alexander Dennis Limited (ADL), Solaris Bus & Coach, and Iveco Bus.


