

- Executive Summary
- Global Industrial Engine Market Snapshot 2026 and 2033
- Market Opportunity Assessment, 2026 - 2033, US$ Mn
- Key Market Trends
- Industry Developments and Key Market Events
- Demand Side and Supply Side Analysis
- PMR Analysis and Recommendations
- Market Overview
- Market Scope and Definitions
- Value Chain Analysis
- Macro-Economic Factors
- Global GDP Outlook
- Global Power Generation Plant Overview
- Global Oil and Gas Industry Overview
- Global Construction Industry Overview
- Forecast Factors - Relevance and Impact
- COVID-19 Impact Assessment
- PESTLE Analysis
- Porter's Five Forces Analysis
- Geopolitical Tensions: Market Impact
- Regulatory and Technology Landscape
- Market Dynamics
- Drivers
- Restraints
- Opportunities
- Trends
- Price Trend Analysis, 2020 - 2033
- Region-wise Price Analysis
- Price by Segments
- Price Impact Factors
- Global Industrial Engine Market Outlook:
- Key Highlights
- Global Industrial Engine Market Outlook: By Power
- Introduction/Key Findings
- Historical Market Size (US$ Mn) and Volume (Units) Analysis by By Power, 2020-2023
- Current Market Size (US$ Mn) and Volume (Units) Analysis and Forecast, by By Power, 2026-2033
- Up to 200 HP
- 201 - 500 HP
- 500 HP to 1000 HP
- 1000 HP to 2500 HP
- 2500 HP to 10000 HP
- Above 10000 HP
- Market Attractiveness Analysis: By Power
- Global Industrial Engine Market Outlook: By End-Use
- Introduction/Key Findings
- Historical Market Size (US$ Mn) and Volume (Units) Analysis by By End-Use, 2020-2023
- Current Market Size (US$ Mn) and Volume (Units) Analysis and Forecast, by By End-Use, 2026-2033
- Power Generation
- General Manufacturing
- Oil & Gas
- Marine
- Agriculture/Off-road vehicles
- Construction
- Mining & Metallurgy
- Market Attractiveness Analysis: By End-Use
- Global Industrial Engine Market Outlook: By Fuel Type
- Introduction/Key Findings
- Historical Market Size (US$ Mn) and Volume (Units) Analysis by By Fuel Type, 2020-2023
- Current Market Size (US$ Mn) and Volume (Units) Analysis and Forecast, by By Fuel Type, 2026-2033
- Diesel
- Gasoline
- Market Attractiveness Analysis: By Fuel Type
- Global Industrial Engine Market Outlook: By Stroke
- Introduction/Key Findings
- Historical Market Size (US$ Mn) and Volume (Units) Analysis by By Stroke, 2020-2023
- Current Market Size (US$ Mn) and Volume (Units) Analysis and Forecast, by By Stroke, 2026-2033
- 2 Stroke
- 4 Stroke
- Market Attractiveness Analysis: By Stroke
- Global Industrial Engine Market Outlook: Region
- Key Highlights
- Historical Market Size (US$ Mn) and Volume (Units) Analysis by Region, 2020-2023
- Current Market Size (US$ Mn) and Volume (Units) Analysis and Forecast, by Region, 2026-2033
- North America
- Europe
- East Asia
- South Asia & Oceania
- Latin America
- Middle East & Africa
- Market Attractiveness Analysis: Region
- North America Industrial Engine Market Outlook:
- Key Highlights
- Pricing Analysis
- North America Market Size (US$ Mn) and Volume (Units) Analysis and Forecast, by Country, 2026-2033
- U.S.
- Canada
- North America Market Size (US$ Mn) and Volume (Units) Analysis and Forecast, by By Power, 2026-2033
- Up to 200 HP
- 201 - 500 HP
- 500 HP to 1000 HP
- 1000 HP to 2500 HP
- 2500 HP to 10000 HP
- Above 10000 HP
- North America Market Size (US$ Mn) and Volume (Units) Analysis and Forecast, by By End-Use, 2026-2033
- Power Generation
- General Manufacturing
- Oil & Gas
- Marine
- Agriculture/Off-road vehicles
- Construction
- Mining & Metallurgy
- North America Market Size (US$ Mn) and Volume (Units) Analysis and Forecast, by By Fuel Type, 2026-2033
- Diesel
- Gasoline
- North America Market Size (US$ Mn) and Volume (Units) Analysis and Forecast, by By Stroke, 2026-2033
- 2 Stroke
- 4 Stroke
- Europe Industrial Engine Market Outlook:
- Key Highlights
- Pricing Analysis
- Europe Market Size (US$ Mn) and Volume (Units) Analysis and Forecast, by Country, 2026-2033
- Germany
- Italy
- France
- U.K.
- Spain
- Russia
- Rest of Europe
- Europe Market Size (US$ Mn) and Volume (Units) Analysis and Forecast, by By Power, 2026-2033
- Up to 200 HP
- 201 - 500 HP
- 500 HP to 1000 HP
- 1000 HP to 2500 HP
- 2500 HP to 10000 HP
- Above 10000 HP
- Europe Market Size (US$ Mn) and Volume (Units) Analysis and Forecast, by By End-Use, 2026-2033
- Power Generation
- General Manufacturing
- Oil & Gas
- Marine
- Agriculture/Off-road vehicles
- Construction
- Mining & Metallurgy
- Europe Market Size (US$ Mn) and Volume (Units) Analysis and Forecast, by By Fuel Type, 2026-2033
- Diesel
- Gasoline
- Europe Market Size (US$ Mn) and Volume (Units) Analysis and Forecast, by By Stroke, 2026-2033
- 2 Stroke
- 4 Stroke
- East Asia Industrial Engine Market Outlook:
- Key Highlights
- Pricing Analysis
- East Asia Market Size (US$ Mn) and Volume (Units) Analysis and Forecast, by Country, 2026-2033
- China
- Japan
- South Korea
- East Asia Market Size (US$ Mn) and Volume (Units) Analysis and Forecast, by By Power, 2026-2033
- Up to 200 HP
- 201 - 500 HP
- 500 HP to 1000 HP
- 1000 HP to 2500 HP
- 2500 HP to 10000 HP
- Above 10000 HP
- East Asia Market Size (US$ Mn) and Volume (Units) Analysis and Forecast, by By End-Use, 2026-2033
- Power Generation
- General Manufacturing
- Oil & Gas
- Marine
- Agriculture/Off-road vehicles
- Construction
- Mining & Metallurgy
- East Asia Market Size (US$ Mn) and Volume (Units) Analysis and Forecast, by By Fuel Type, 2026-2033
- Diesel
- Gasoline
- East Asia Market Size (US$ Mn) and Volume (Units) Analysis and Forecast, by By Stroke, 2026-2033
- 2 Stroke
- 4 Stroke
- South Asia & Oceania Industrial Engine Market Outlook:
- Key Highlights
- Pricing Analysis
- South Asia & Oceania Market Size (US$ Mn) and Volume (Units) Analysis and Forecast, by Country, 2026-2033
- India
- Southeast Asia
- ANZ
- Rest of SAO
- South Asia & Oceania Market Size (US$ Mn) and Volume (Units) Analysis and Forecast, by By Power, 2026-2033
- Up to 200 HP
- 201 - 500 HP
- 500 HP to 1000 HP
- 1000 HP to 2500 HP
- 2500 HP to 10000 HP
- Above 10000 HP
- South Asia & Oceania Market Size (US$ Mn) and Volume (Units) Analysis and Forecast, by By End-Use, 2026-2033
- Power Generation
- General Manufacturing
- Oil & Gas
- Marine
- Agriculture/Off-road vehicles
- Construction
- Mining & Metallurgy
- South Asia & Oceania Market Size (US$ Mn) and Volume (Units) Analysis and Forecast, by By Fuel Type, 2026-2033
- Diesel
- Gasoline
- South Asia & Oceania Market Size (US$ Mn) and Volume (Units) Analysis and Forecast, by By Stroke, 2026-2033
- 2 Stroke
- 4 Stroke
- Latin America Industrial Engine Market Outlook:
- Key Highlights
- Pricing Analysis
- Latin America Market Size (US$ Mn) and Volume (Units) Analysis and Forecast, by Country, 2026-2033
- Brazil
- Mexico
- Rest of LATAM
- Latin America Market Size (US$ Mn) and Volume (Units) Analysis and Forecast, by By Power, 2026-2033
- Up to 200 HP
- 201 - 500 HP
- 500 HP to 1000 HP
- 1000 HP to 2500 HP
- 2500 HP to 10000 HP
- Above 10000 HP
- Latin America Market Size (US$ Mn) and Volume (Units) Analysis and Forecast, by By End-Use, 2026-2033
- Power Generation
- General Manufacturing
- Oil & Gas
- Marine
- Agriculture/Off-road vehicles
- Construction
- Mining & Metallurgy
- Latin America Market Size (US$ Mn) and Volume (Units) Analysis and Forecast, by By Fuel Type, 2026-2033
- Diesel
- Gasoline
- Latin America Market Size (US$ Mn) and Volume (Units) Analysis and Forecast, by By Stroke, 2026-2033
- 2 Stroke
- 4 Stroke
- Middle East & Africa Industrial Engine Market Outlook:
- Key Highlights
- Pricing Analysis
- Middle East & Africa Market Size (US$ Mn) and Volume (Units) Analysis and Forecast, by Country, 2026-2033
- GCC Countries
- South Africa
- Northern Africa
- Rest of MEA
- Middle East & Africa Market Size (US$ Mn) and Volume (Units) Analysis and Forecast, by By Power, 2026-2033
- Up to 200 HP
- 201 - 500 HP
- 500 HP to 1000 HP
- 1000 HP to 2500 HP
- 2500 HP to 10000 HP
- Above 10000 HP
- Middle East & Africa Market Size (US$ Mn) and Volume (Units) Analysis and Forecast, by By End-Use, 2026-2033
- Power Generation
- General Manufacturing
- Oil & Gas
- Marine
- Agriculture/Off-road vehicles
- Construction
- Mining & Metallurgy
- Middle East & Africa Market Size (US$ Mn) and Volume (Units) Analysis and Forecast, by By Fuel Type, 2026-2033
- Diesel
- Gasoline
- Middle East & Africa Market Size (US$ Mn) and Volume (Units) Analysis and Forecast, by By Stroke, 2026-2033
- 2 Stroke
- 4 Stroke
- Competition Landscape
- Market Share Analysis, 2026
- Market Structure
- Competition Intensity Mapping
- Competition Dashboard
- Company Profiles
- Honda Motor Co.Ltd
- Company Overview
- Product Portfolio/Offerings
- Key Financials
- SWOT Analysis
- Company Strategy and Key Developments
- Kawasaki Heavy Industries, Ltd.
- JEEMAR POWER CO., LTD
- Chongqing Fuchai Industry Group
- Changchai Co., Ltd.
- Kohler Co.
- Hyundai
- Kirloskar
- Yanmar
- SIEMENS Energy
- Mitsubishi
- Shanghai Diesel Engine Co., Ltd.
- Cummins
- Ingersoll Rand
- DAIHATSU DIESEL MFG. CO., LTD.
- Honda Motor Co.Ltd
- Appendix
- Research Methodology
- Research Assumptions
- Acronyms and Abbreviations


- Industrial Machinery
- Industrial Engine Market
Industrial Engine Market Size, Trends, Share, and Growth Forecast, 2026- 2033
Industrial Engine Market by Power (Up to 200 HP,201 - 500 HP,500 HP to 1000 HP, 1000 HP to 2500 HP, 2500 HP to 10000 HP, and Above 10000 HP), End-User (Power Generation, Oil & Gas, General Manufacturing, Marine, Agriculture/Off-road vehicles, Construction, Mining & Metallurgy, and Others), Fuel Type, Stroke, and Regional Analysis for 2026 - 2033
Industrial Engine Market Size and Trends Analysis
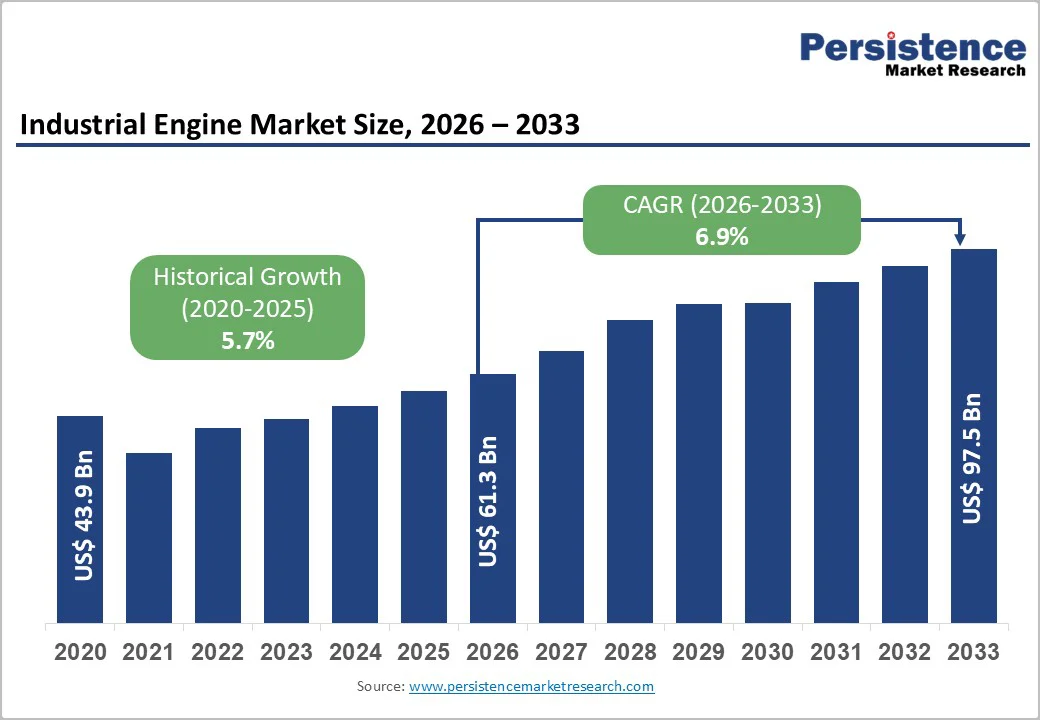
The global industrial engine market size is likely to be valued at US$ 61.3 billion in 2026, subsequently expanding to US$ 97.5 billion by 2033, growing at a CAGR of 6.9% between 2026 and 2033.
Accelerated infrastructure development, rising demand for reliable power generation systems, and increasing mechanization across construction, mining, and agricultural sectors attract robust growth. The market is experiencing sustained growth momentum from stringent emission regulations pushing technological innovation, expanding industrial activities in emerging economies, and the critical need for backup power solutions across manufacturing facilities and data centers globally.
Key Industry Highlights:
- Growing grid instability and rising energy demand push power generation engines to 25% revenue, with over 70% manufacturing facilities relying on backup systems.
- Market Restraint (High Costs): Emission-compliant engines require costly SCR and DPF technologies, raising ownership expenses and slowing adoption among SMEs in highly price-sensitive industrial markets.
- Hybrid & Multi-Fuel Opportunity: Dual-fuel and hydrogen-ready platforms like Cummins B6.7N enable flexible, lower-emission operation, supporting global transitions toward cleaner, multi-fuel industrial engine solutions.
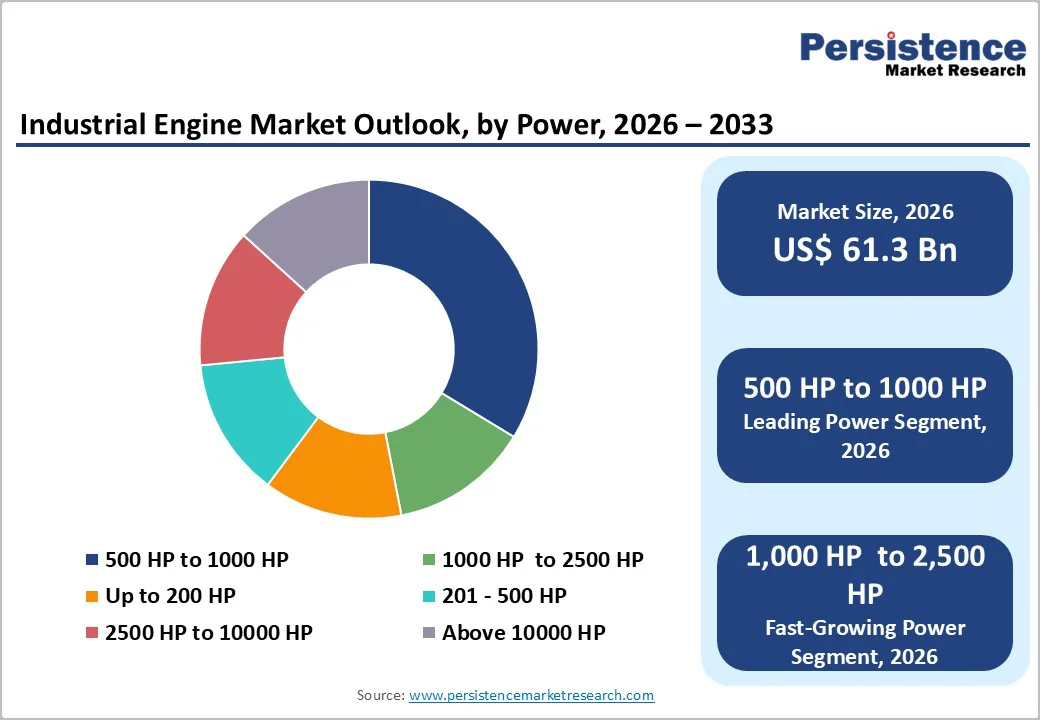
- Power Insight (Mid-Range Dominance): Engines within the 500-1,000 HP range hold 37% revenue, offering optimal performance, efficiency, and versatility for construction, manufacturing, and generator applications.
- High-Horsepower Growth: The 1,000-2,500 HP segment grows fastest due to rising demand for powerful engines supporting mining trucks, drilling rigs, and large infrastructure machinery.
- Leading End-user: Power generation maintains 25% share, while oil and gas grows fastest supported by offshore exploration requiring reliable, high-horsepower mechanical drive engines.
- Fuel Type (Diesel Dominance): Diesel exceeds 60% revenue due to torque and durability advantages, while gasoline engines grow quickest for compact equipment needing lower upfront costs.
- Stroke Insight (Four-Stroke Leads): Four-stroke engines exceed 65% share with strong efficiency and compliance benefits, while two-stroke engines grow 7.3% CAGR driven by lightweight applications.
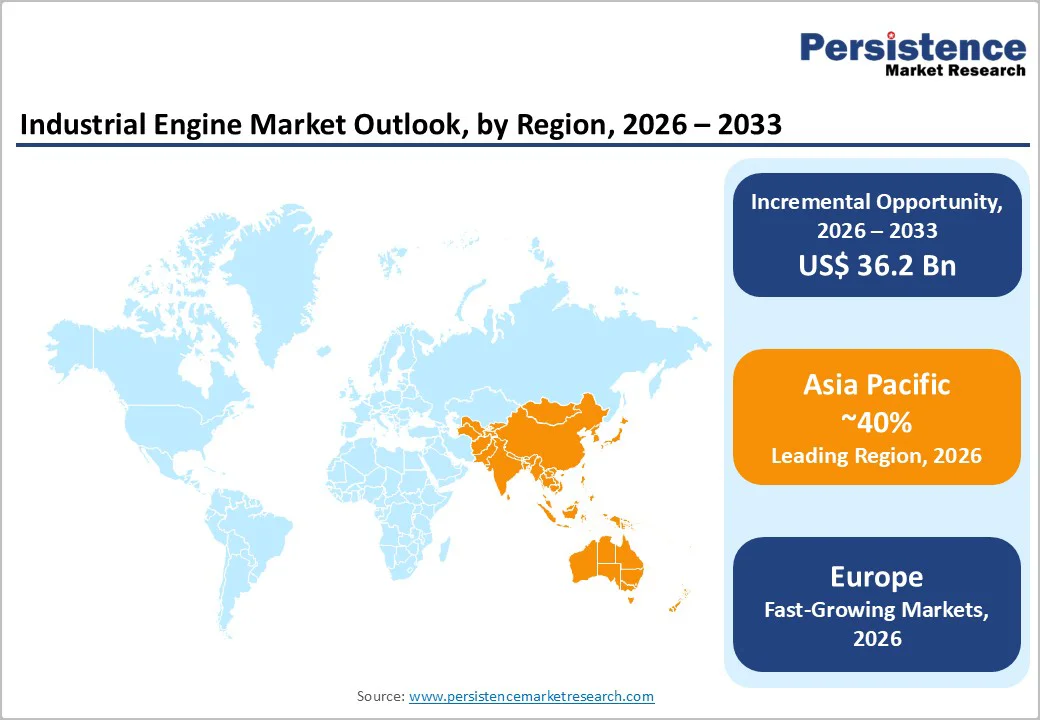
- Asia Pacific Leadership: Asia Pacific holds 40%+ share, driven by China’s 7.4% and India’s 7.8% growth from rapid industrialization, infrastructure expansion, and mechanization.
- Competitive Landscape: Caterpillar and Cummins hold 25%+ combined share, while regional players like Weichai and Doosan expand through localized manufacturing and competitive pricing.
| Key Insights | Details |
|---|---|
| Industrial Engine Market Size (2026E) | US$ 61.3 Bn |
| Market Value Forecast (2033F) | US$ 97.5 Bn |
| Projected Growth (CAGR 2026 to 2033) | 6.9% |
| Historical Market Growth (CAGR 2020 to 2025) | 5.7% |
Market Dynamics
Drivers - Rising Demand for Reliable Power Generation and Backup Systems
The power generation segment accounted for over 25% revenue share in the industrial engine market, driven by escalating energy demands and grid reliability challenges across developing regions. The power generation industrial engine reflects critical requirements for backup power in manufacturing plants, data centers, hospitals, and telecommunications infrastructure. India's power generation engines market is fueled by the country's position as the third-largest global energy consumer, with projected energy demand doubling by 2040. Over 70% of global manufacturing facilities rely on backup power systems to prevent operational disruptions, equipment damage, and safety risks during grid failures. The integration of industrial engines with renewable energy systems for grid stabilization during intermittent solar and wind generation creates complementary demand, positioning these engines as essential components in distributed energy infrastructure.
Restraint - High Capital Investment and Maintenance Costs Limiting Adoption
The transition to emission-compliant industrial engines involves substantial capital expenditure for both manufacturers and end users, creating adoption barriers particularly in price-sensitive markets. Compliance with stringent emission standards requires integration of expensive after-treatment technologies including SCR systems, DPF units, and advanced electronic control systems, significantly increasing per-unit costs compared to legacy engines. Small and medium-sized construction contractors, agricultural operators, and industrial users face financial constraints when upgrading equipment fleets to meet regulatory requirements, often extending replacement cycles or opting for refurbished equipment. The complexity of modern emission control systems also elevates maintenance requirements and operational costs, with specialized diagnostic equipment, trained technicians, and premium diesel exhaust fluid (DEF) consumption adding to total cost of ownership. In developing economies where labor costs are low and regulatory enforcement may be less stringent, the value proposition for investing in advanced industrial engines becomes less compelling, potentially slowing market penetration rates.
Opportunity - Integration with Hybrid and Alternative Fuel Technologies
The development of dual-fuel, bi-fuel, and hybrid industrial engines capable of operating on multiple fuel sources creates new market opportunities while addressing emission concerns. Manufacturers are investing in engines compatible with natural gas, biogas, hydrogen blends, and synthetic fuels, providing operational flexibility and reduced carbon footprints. Cummins' launch of HELM (higher efficiency, lower emissions, multiple fuels) platforms including B6.7N natural gas engines and advanced hydrogen fuel delivery systems demonstrates market evolution toward fuel flexibility while maintaining diesel-equivalent performance. Hybrid powertrain integration combining industrial engines with electric motors and battery systems is gaining momentum in construction equipment, offering enhanced fuel efficiency, reduced emissions, and improved power management. These technological convergences enable manufacturers to serve customers requiring transitional solutions that balance performance requirements with sustainability objectives, potentially expanding addressable market segments.
Category-wise Analysis
Power Insights
The industrial engine market shows a clear power-based segmentation, with the 500-1,000 HP category emerging as the dominant segment, accounting for over 37% of total revenue. This range delivers the ideal balance of power, durability, and fuel efficiency, making it the preferred choice for mainstream construction, manufacturing, and power generation applications. Engines in this class effectively power medium excavators, wheel loaders, industrial machinery, and generator sets, benefiting from mature technologies, strong supply chains, and wide applicability across industries.
In contrast, the 1,000-2,500 HP segment is witnessing the fastest growth, driven by rising global demand for high-performance engines in heavy-duty construction equipment, large mining vehicles, and high-capacity power systems. Mega infrastructure projects and expanding mining operations increasingly require powerful haul trucks, shovels, drilling rigs, and draglines capable of sustained performance in extreme environments. This segment’s rapid expansion is further reinforced by advancements in turbocharging, electronic fuel injection, and thermal management technologies, which enhance power density while ensuring compliance with modern emission regulations, positioning it as a critical growth engine for the industry’s future.
End-user Insights
Power generation remains the leading end-use segment, accounting for over 25% of revenue in 2026, as industries increasingly depend on reliable backup systems to ensure uninterrupted operations across manufacturing, data centers, healthcare facilities, and telecommunications networks. Demand is further supported by rising energy security concerns, frequent grid instability in developing economies, and the growing need to integrate industrial engines with renewable energy systems for effective load balancing. At the same time, industrial facilities in sectors such as chemical processing, food and beverage, and pharmaceuticals are widely adopting engines for combined heat and power (CHP) applications, enabling improved energy efficiency and lower environmental impact.
In parallel, Oil & Gas has emerged as the fastest-growing segment, driven by expanding offshore exploration, remote drilling operations, and the rising use of high-horsepower engines for mechanical drive applications powering compressors, pumps, and critical extraction infrastructure. The segment’s momentum also reflects increasing global energy demand, which continues to drive hydrocarbon investments despite energy-transition pressures. Industrial engines deliver the reliability and durability required for offshore support vessels, drilling rigs, and FPSO units operating in harsh maritime environments, reinforcing the strong growth outlook for this segment.
Fuel Type Insights
Diesel continues to dominate the fuel type landscape, accounting for over 60% of total revenue in 2026, primarily due to its unmatched energy density, high torque output, broad fuel availability, and mature global infrastructure. Its exceptional durability, robustness, and ability to deliver consistent high-load performance make diesel the preferred choice across construction, mining, marine, and agricultural sectors. This dominance is further reinforced by continuous improvements in cleaner, more fuel-efficient diesel technologies featuring advanced emission control systems, which help maintain diesel’s relevance in heavy-duty industrial environments. In contrast, gasoline represents the fastest-growing fuel type segment, supported by its advantages in lightweight applications, higher RPM capabilities, and lower upfront costs ualities that suit compact construction equipment, portable generators, and small agricultural machinery. Gasoline engines also benefit from lower particulate emissions and simpler emission control requirements compared to diesel. However, despite its growth potential, gasoline’s overall market share remains constrained by lower fuel efficiency and reduced torque performance, limiting its suitability for demanding industrial operations that require sustained, high-power output.
Stroke Insights
Four-stroke engines dominate the market with over 65% revenue share, driven by their superior fuel efficiency, lower emissions, durability, and quieter performance compared to 2-stroke counterparts. Valued at USD 24.7 billion in 2024, the 4-stroke segment is projected to reach USD 36.1 billion by 2033, registering a 4.3% CAGR. This growth is strongly supported by tightening global emission regulations, which are accelerating the shift toward cleaner and more efficient combustion technologies. Their widespread use across automotive, marine, agriculture, and power generation sectors further reinforces demand, as industries prioritize environmental compliance, operating cost reduction, and longer maintenance intervals.
In contrast, 2-stroke engines, despite holding a smaller share, represent the fastest-growing stroke category with an estimated 7.3% CAGR through 2033. Their expansion is driven by high power-to-weight ratios, simpler mechanical designs, and lower production costs, making them ideal for applications such as marine outboard motors, handheld and portable equipment, and select agricultural machinery. Moreover, continuous innovations in fuel injection, lubrication, and emission-control systems are enabling modern 2-stroke engines to align with emerging environmental standards while preserving their core performance benefits, thereby maintaining their relevance in niche yet expanding market segments.
Regional Insights and Trends
Asia Pacific Drives Global Industrial Engine Growth Through Rapid Industrialization and Expanding Infrastructure Demand
Asia Pacific remains the undisputed leader in the global industrial engine market, commanding over 40% revenue share in 2025 with robust 6.5% CAGR the fastest worldwide. This dominance is rooted in rapid industrialization, large-scale infrastructure projects, accelerated manufacturing expansion, and growing mechanization across agriculture and construction sectors in China, India, Japan, Southeast Asia, and Australia. China continues to anchor regional performance with a 7.4% CAGR, supported by Belt and Road infrastructure initiatives, domestic urbanization policies, and its role as a global manufacturing hub for industrial engines and machinery. India, meanwhile, is emerging as a high-growth market, projected to grow at 7.8% CAGR through 2035, fueled by record-breaking infrastructure spending, smart city developments, extensive road construction, and strong manufacturing incentives under PLI schemes.
Complementing these macroeconomic drivers, Asia Pacific benefits from supportive government policies promoting domestic engine production, streamlined industrial regulations, and major capital allocations toward infrastructure. Abundant natural gas and biogas resources, combined with clean-energy initiatives, are accelerating adoption of dual-fuel and alternative-fuel engines. Additionally, regional manufacturers are strengthening production and service networks to support rising demand from construction, mining, and agricultural equipment users. With urban populations driving an estimated 8% rise in energy consumption in 2024 and ongoing fleet modernization across industries, Asia Pacific is positioned for sustained industrial engine market growth through 2033.
Europe Accelerates Industrial Engine Growth Through Strict Emission Standards, Sustainability Targets, and Advanced Technology Adoption
Europe’s industrial engine market generated USD 12,589.8 million in 2024, representing 22.1% of global revenue, and is projected to reach USD 16,458.0 million by 2030 at a 4.7% CAGR. The region’s growth is strongly shaped by its stringent focus on energy efficiency, low emissions, and strict adherence to Euro VI and Stage V standards among the world’s toughest regulations governing nonroad mobile machinery. As the European Union pushes aggressive climate commitments, industries are rapidly adopting hybrid and alternative fuel-powered engines to reduce carbon footprints and align with corporate sustainability goals. Major economies such as Germany, the United Kingdom, France, Spain, and Italy continue to drive demand through infrastructure modernization, a resurgence in manufacturing particularly across Central and Eastern Europe and rising investments in decentralized energy systems.
Within the region, France is expected to record the highest CAGR from 2025 to 2030, supported by naval modernization, retrofitting aligned with emission control area (ECA) rules, and offshore wind vessel development. Germany remains the regional leader with its strong manufacturing base, advanced technological ecosystem, and emphasis on automation and hybrid solutions, while the UK market benefits from infrastructure upgrades and stricter environmental rules encouraging low-emission, digitally integrated engines. Overall, Europe reflects a mature demand pattern driven by replacement cycles, technology upgrades, and regulatory compliance, creating strong opportunities for premium, high-efficiency engine platforms.
Competitive Landscape
The industrial engine market exhibits moderately consolidated structure with leading players including Caterpillar Inc, Cummins Inc, Volvo Penta, Deutz AG, MAN Energy Solutions, Yanmar, Perkins Engines, Mitsubishi Heavy Industries, Wärtsilä Corporation, and Kubota Corp collectively commanding substantial market share through established brand recognition, global distribution networks, and comprehensive product portfolios. Caterpillar and Cummins maintain market leadership positions with estimated combined share exceeding 25%, leveraging vertical integration, extensive service networks spanning over 190 countries, and continuous R&D investments in fuel efficiency and emission reduction technologies. Regional manufacturers including Weichai Power (China), Doosan (South Korea), and domestic players in India are gaining share through competitive pricing, local manufacturing capabilities, and government procurement preferences favoring indigenous producers.
Market concentration reflects competitive dynamics where scale advantages in manufacturing, R&D capabilities, and service infrastructure create barriers to entry for smaller players. However, specialization opportunities exist in niche segments including ultra-high horsepower engines (above 10,000 HP), alternative fuel platforms, and application-specific engine designs for marine, rail, or specialized industrial equipment. The competitive landscape is characterized by ongoing consolidation through mergers and acquisitions as manufacturers seek to expand geographic reach, acquire technology capabilities, and achieve cost synergies in increasingly regulated and technologically complex market environment
Key Industry Developments:
- In February 2025, CNH inaugurated its new engine manufacturing facility in Greater Noida with a USD 15 million investment, targeting 90% localisation of the 2.8L F28 engine by year-end. The plant, which currently sources 65% of components locally, has an annual production capacity of 20,000 units and aims to enhance cost efficiency and reduce import reliance.
- In 2025, FPT Industrial announced its participation at POWERGEN International in Dallas, Texas, scheduled from February 11-13. As a main exhibitor and major sponsor for the fifth consecutive year, the company will showcase an expanded portfolio of 2.4L to 16L engines that meet global emission standards ranging from Tier 4 Final/Stage V to unregulated applications, ensuring high reliability, efficiency, and optimal fluid consumption.
- In 2025, Cummins Inc. also confirmed its presence at Agritechnica 2025, set for November 9-15 in Hannover, Germany, where it will display its durable engines, aftertreatment systems, and axle technologies designed for easier integration, enhanced reliability, and simplified serviceability in agricultural machinery.
- In 2024, Kirloskar introduced India’s only locally manufactured 1100 HP mining engine for high-performance applications such as dump trucks and excavators, strengthening domestic capabilities in the heavy-duty equipment segment.
- During Intermat 2024, held in Paris from April 24-27, Cummins launched its new 15L diesel engine for off-highway applications, presented alongside a broad suite of the company’s advanced off-highway technologies.
- On November 5, 2024, Cummins unveiled its next-generation F2.5 and F3.0 light engine platforms at the Wuhan Cummins East Asia R&D Center. These engines comply with National VI B emission standards and Stage IV fuel consumption regulations while delivering improvements in fuel efficiency, power, reliability, and technical innovation.
- In September 2024, FPT Industrial celebrated the production of its 100,000th natural gas engine at its Bourbon-Lancy facility in France, marking a major milestone in its commitment to low-emission powertrain manufacturing.
Companies Covered in Industrial Engine Market
- Honda Motor Co.Ltd
- Kawasaki Heavy Industries, Ltd.
- JEEMAR POWER CO., LTD
- Chongqing Fuchai Industry Group
- Changchai Co., Ltd.
- Kohler Co.
- Motorenfabrik Hatz GmbH & Co. KG
- Loncin Motor Co., Ltd.
- Lifan Power USA
- Fuzhou Launtop M&E Co.,Ltd.,
- Caterpillar (engines) USA
- Shanghai Diesel Engine Co., Ltd.
- Cummins
- Ingersoll Rand
- DAIHATSU DIESEL MFG. CO., LTD.
- CNH Industrial
- Hyundai
- Kirloskar
- Yanmar
- SIEMENS Energy
- Mitsubishi
- Perkins Engines
- Kubota
- Doosan
- Wärtsilä
- Deere & Company
- Other Market Players
Frequently Asked Questions
The Industrial Engine market is estimated to be valued at US$ 61.3 Bn in 2026.
The key demand driver for the industrial engine market is rising adoption of advanced, fuel-efficient engines across construction, agriculture, mining, and manufacturing sectors, driven by automation, infrastructure expansion, and stricter emission compliance.
In 2026, the Asia Pacific region will dominate the market with an exceeding 40% revenue share in the global Industrial Engine market.
Among end use, Power Generation has the highest preference, capturing beyond 45% of the market revenue share in 2026, surpassing other end uses.
Honda Motor Co.Ltd, Kawasaki Heavy Industries, Ltd., JEEMAR POWER CO., LTD, Chongqing Fuchai Industry Group, Changchai Co., Ltd., Kohler Co., Motorenfabrik Hatz GmbH & Co. KG are a few leading players in the Industrial Engine market.


