


- Executive Summary
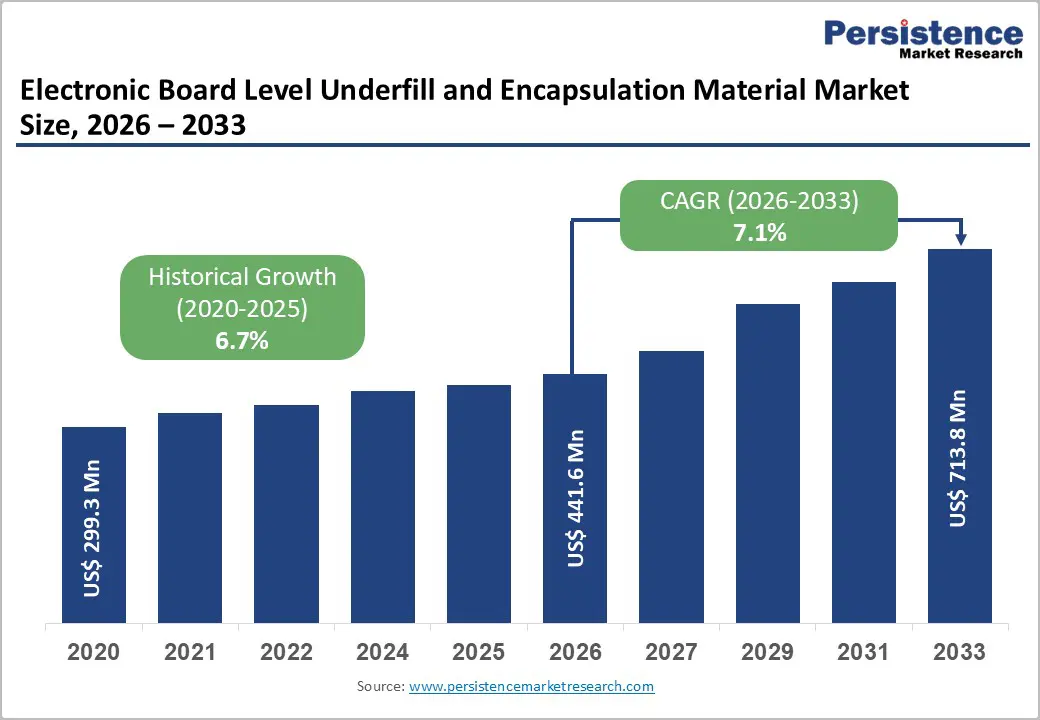
- Global Electronic Board Level Underfill and Encapsulation Material Market Snapshot 2026 and 2033
- Market Opportunity Assessment, 2026 - 2033, US$ Mn
- Key Market Trends
- Industry Developments and Key Market Events
- Demand Side and Supply Side Analysis
- PMR Analysis and Recommendations
- Market Overview
- Market Scope and Definitions
- Market Dynamics
- Driver
- Restraint
- Opportunities
- Trends
- Macro-Economic Factors
- Global GDP Outlook
- Global Prison Growth Outlook
- Global Crime Rates by Country
- Global Prison Population by Country
- Global Private Prison Market Growth Outlook
- Other Macro-economic Factors
- Forecast Factors - Relevance and Impact
- COVID-19 Impact Assessment
- Value Added Insights
- Value Chain analysis
- Key Market Players
- Product Adoption Analysis
- Key Promotional Strategies by key players
- PESTLE Analysis
- Porter's Five Forces Analysis
- Regulatory and Technology Landscape
- Price Trend Analysis, 2025
- Region-wise Price Analysis
- Price by Segments
- Price Impact Factors
- Global Electronic Board Level Underfill and Encapsulation Material Market Outlook: Historical (2020 - 2025) and Forecast (2026 - 2033)
- Key Highlights
- Global Electronic Board Level Underfill and Encapsulation Material Market Outlook: Product Type
- Introduction/Key Findings
- Historical Market Size (US$ Mn) and Volume (Units) Analysis by Product Type, 2020-2025
- Current Market Size (US$ Mn) and Volume (Units) Forecast, by Product Type, 2026-2033
- Underfills
- Capillary
- Edge Bonds
- No-Flow Underfill)
- Gob Top Encapsulations
- Underfills
- Market Attractiveness Analysis: Product Type
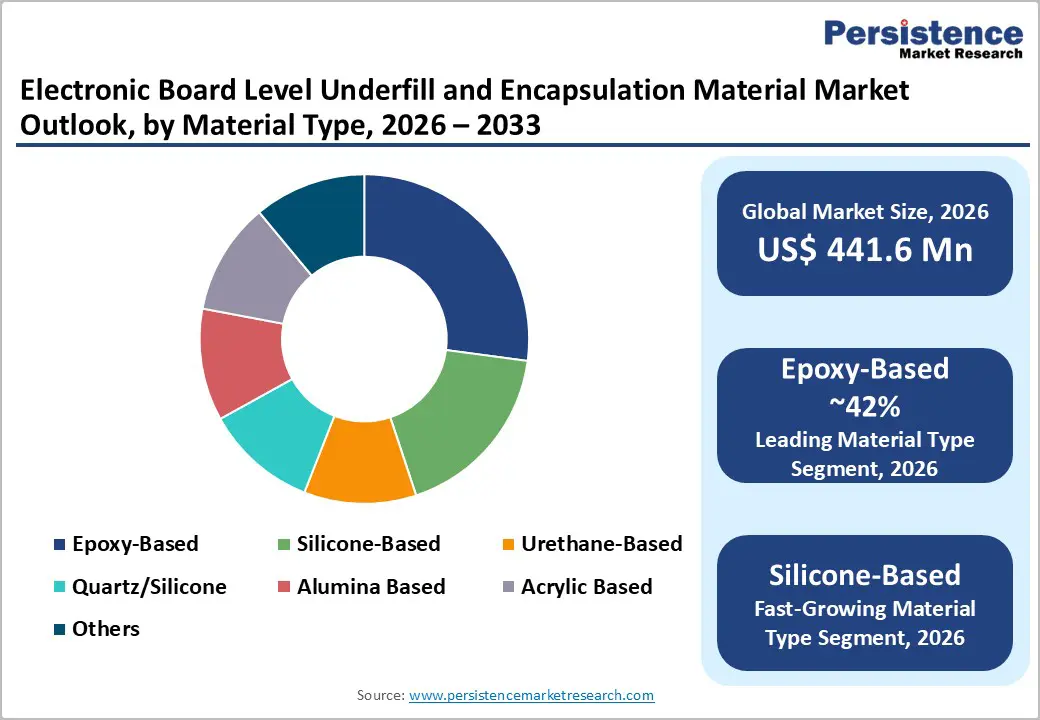
- Global Electronic Board Level Underfill and Encapsulation Material Market Outlook: Material Type
- Introduction/Key Findings
- Historical Market Size (US$ Mn) and Volume (Units) Analysis by Material Type, 2020-2025
- Current Market Size (US$ Mn) and Volume (Units) Forecast, by Material Type, 2026-2033
- Epoxy-Based
- Silicone-Based
- Urethane-Based
- Quartz/Silicone
- Alumina Based
- Acrylic Based
- Others
- Market Attractiveness Analysis: Material Type
- Global Electronic Board Level Underfill and Encapsulation Material Market Outlook: Board Type
- Introduction/Key Findings
- Historical Market Size (US$ Mn) and Volume (Units) Analysis by Board Type, 2020-2025
- Current Market Size (US$ Mn) and Volume (Units) Forecast, by Board Type, 2026-2033
- CSP (Chip Scale Package)
- BGA (Ball Grid array)
- Flip Chips
- Market Attractiveness Analysis: Board Type
- Global Electronic Board Level Underfill and Encapsulation Material Market Outlook: End-Use Industry
- Introduction/Key Findings
- Historical Market Size (US$ Mn) and Volume (Units) Analysis by End-Use Industry, 2020-2025
- Current Market Size (US$ Mn) and Volume (Units) Forecast, by End-Use Industry, 2026-2033
- Consumer Electronics
- Automotive Electronics
- Telecommunications & Networking
- Healthcare & Medical Devices
- Others
- Market Attractiveness Analysis: End-Use Industry
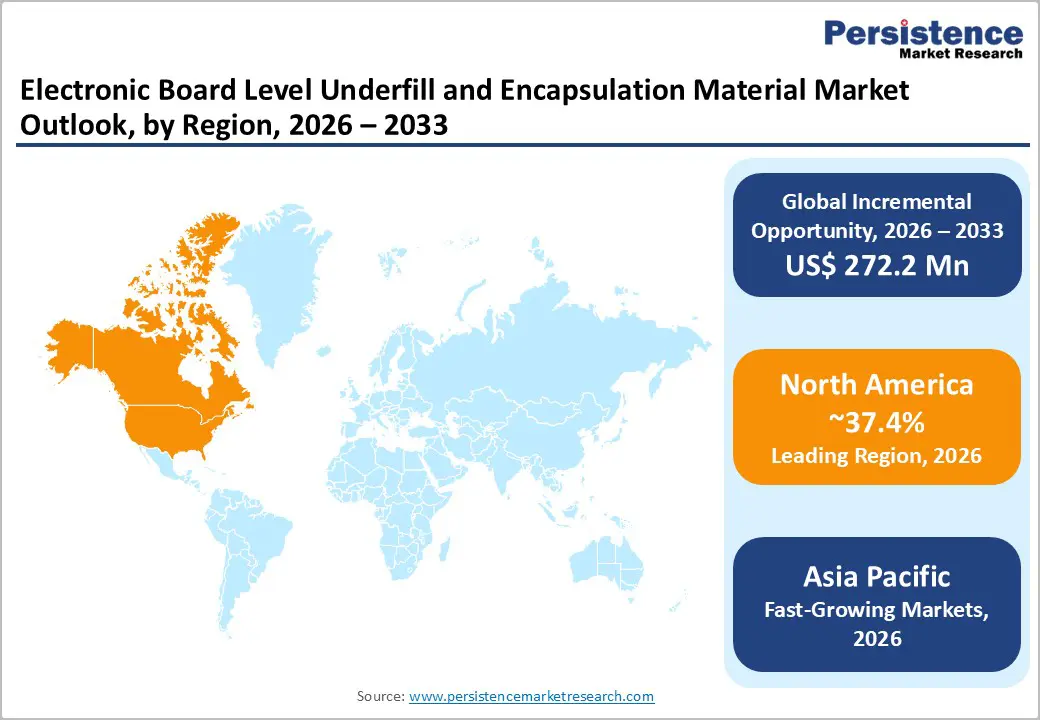
- Global Electronic Board Level Underfill and Encapsulation Material Market Outlook: Region
- Key Highlights
- Historical Market Size (US$ Mn) and Volume (Units) Analysis by Region, 2020-2025
- Current Market Size (US$ Mn) and Volume (Units) Forecast, by Region, 2026-2033
- North America
- Europe
- East Asia
- South Asia & Oceania
- Latin America
- Middle East & Africa
- Market Attractiveness Analysis: Region
- North America Electronic Board Level Underfill and Encapsulation Material Market Outlook: Historical (2020 - 2025) and Forecast (2026 - 2033)
- Key Highlights
- Pricing Analysis
- North America Market Size (US$ Mn) and Volume (Units) Forecast, by Country, 2026-2033
- U.S.
- Canada
- North America Market Size (US$ Mn) and Volume (Units) Forecast, by Product Type, 2026-2033
- Underfills
- Capillary
- Edge Bonds
- No-Flow Underfill)
- Gob Top Encapsulations
- Underfills
- North America Market Size (US$ Mn) and Volume (Units) Forecast, by Material Type, 2026-2033
- Epoxy-Based
- Silicone-Based
- Urethane-Based
- Quartz/Silicone
- Alumina Based
- Acrylic Based
- Others
- North America Market Size (US$ Mn) and Volume (Units) Forecast, by Board Type, 2026-2033
- CSP (Chip Scale Package)
- BGA (Ball Grid array)
- Flip Chips
- North America Market Size (US$ Mn) and Volume (Units) Forecast, by End-Use Industry, 2026-2033
- Consumer Electronics
- Automotive Electronics
- Telecommunications & Networking
- Healthcare & Medical Devices
- Others
- Europe Electronic Board Level Underfill and Encapsulation Material Market Outlook: Historical (2020 - 2025) and Forecast (2026 - 2033)
- Key Highlights
- Pricing Analysis
- Europe Market Size (US$ Mn) and Volume (Units) Forecast, by Country, 2026-2033
- Germany
- Italy
- France
- U.K.
- Spain
- Russia
- Rest of Europe
- Europe Market Size (US$ Mn) and Volume (Units) Forecast, by Product Type, 2026-2033
- Underfills
- Capillary
- Edge Bonds
- No-Flow Underfill)
- Gob Top Encapsulations
- Underfills
- Europe Market Size (US$ Mn) and Volume (Units) Forecast, by Material Type, 2026-2033
- Epoxy-Based
- Silicone-Based
- Urethane-Based
- Quartz/Silicone
- Alumina Based
- Acrylic Based
- Others
- Europe Market Size (US$ Mn) and Volume (Units) Forecast, by Board Type, 2026-2033
- CSP (Chip Scale Package)
- BGA (Ball Grid array)
- Flip Chips
- Europe Market Size (US$ Mn) and Volume (Units) Forecast, by End-Use Industry, 2026-2033
- Consumer Electronics
- Automotive Electronics
- Telecommunications & Networking
- Healthcare & Medical Devices
- Others
- East Asia Electronic Board Level Underfill and Encapsulation Material Market Outlook: Historical (2020 - 2025) and Forecast (2026 - 2033)
- Key Highlights
- Pricing Analysis
- East Asia Market Size (US$ Mn) and Volume (Units) Forecast, by Country, 2026-2033
- China
- Japan
- South Korea
- East Asia Market Size (US$ Mn) and Volume (Units) Forecast, by Product Type, 2026-2033
- Underfills
- Capillary
- Edge Bonds
- No-Flow Underfill)
- Gob Top Encapsulations
- Underfills
- East Asia Market Size (US$ Mn) and Volume (Units) Forecast, by Material Type, 2026-2033
- Epoxy-Based
- Silicone-Based
- Urethane-Based
- Quartz/Silicone
- Alumina Based
- Acrylic Based
- Others
- East Asia Market Size (US$ Mn) and Volume (Units) Forecast, by Board Type, 2026-2033
- CSP (Chip Scale Package)
- BGA (Ball Grid array)
- Flip Chips
- East Asia Market Size (US$ Mn) and Volume (Units) Forecast, by End-Use Industry, 2026-2033
- Consumer Electronics
- Automotive Electronics
- Telecommunications & Networking
- Healthcare & Medical Devices
- Others
- South Asia & Oceania Electronic Board Level Underfill and Encapsulation Material Market Outlook: Historical (2020 - 2025) and Forecast (2026 - 2033)
- Key Highlights
- Pricing Analysis
- South Asia & Oceania Market Size (US$ Mn) and Volume (Units) Forecast, by Country, 2026-2033
- India
- Southeast Asia
- ANZ
- Rest of SAO
- South Asia & Oceania Market Size (US$ Mn) and Volume (Units) Forecast, by Product Type, 2026-2033
- Underfills
- Capillary
- Edge Bonds
- No-Flow Underfill)
- Gob Top Encapsulations
- Underfills
- South Asia & Oceania Market Size (US$ Mn) and Volume (Units) Forecast, by Material Type, 2026-2033
- Epoxy-Based
- Silicone-Based
- Urethane-Based
- Quartz/Silicone
- Alumina Based
- Acrylic Based
- Others
- South Asia & Oceania Market Size (US$ Mn) and Volume (Units) Forecast, by Board Type, 2026-2033
- CSP (Chip Scale Package)
- BGA (Ball Grid array)
- Flip Chips
- South Asia & Oceania Market Size (US$ Mn) and Volume (Units) Forecast, by End-Use Industry, 2026-2033
- Consumer Electronics
- Automotive Electronics
- Telecommunications & Networking
- Healthcare & Medical Devices
- Others
- Latin America Electronic Board Level Underfill and Encapsulation Material Market Outlook: Historical (2020 - 2025) and Forecast (2026 - 2033)
- Key Highlights
- Pricing Analysis
- Latin America Market Size (US$ Mn) and Volume (Units) Forecast, by Country, 2026-2033
- Brazil
- Mexico
- Rest of LATAM
- Latin America Market Size (US$ Mn) and Volume (Units) Forecast, by Product Type, 2026-2033
- Underfills
- Capillary
- Edge Bonds
- No-Flow Underfill)
- Gob Top Encapsulations
- Underfills
- Latin America Market Size (US$ Mn) and Volume (Units) Forecast, by Material Type, 2026-2033
- Epoxy-Based
- Silicone-Based
- Urethane-Based
- Quartz/Silicone
- Alumina Based
- Acrylic Based
- Others
- Latin America Market Size (US$ Mn) and Volume (Units) Forecast, by Board Type, 2026-2033
- CSP (Chip Scale Package)
- BGA (Ball Grid array)
- Flip Chips
- Latin America Market Size (US$ Mn) and Volume (Units) Forecast, by End-Use Industry, 2026-2033
- Consumer Electronics
- Automotive Electronics
- Telecommunications & Networking
- Healthcare & Medical Devices
- Others
- Middle East & Africa Electronic Board Level Underfill and Encapsulation Material Market Outlook: Historical (2020 - 2025) and Forecast (2026 - 2033)
- Key Highlights
- Pricing Analysis
- Middle East & Africa Market Size (US$ Mn) and Volume (Units) Forecast, by Country, 2026-2033
- GCC Countries
- South Africa
- Northern Africa
- Rest of MEA
- Middle East & Africa Market Size (US$ Mn) and Volume (Units) Forecast, by Product Type, 2026-2033
- Underfills
- Capillary
- Edge Bonds
- No-Flow Underfill)
- Gob Top Encapsulations
- Underfills
- Middle East & Africa Market Size (US$ Mn) and Volume (Units) Forecast, by Material Type, 2026-2033
- Epoxy-Based
- Silicone-Based
- Urethane-Based
- Quartz/Silicone
- Alumina Based
- Acrylic Based
- Others
- Middle East & Africa Market Size (US$ Mn) and Volume (Units) Forecast, by Board Type, 2026-2033
- CSP (Chip Scale Package)
- BGA (Ball Grid array)
- Flip Chips
- Middle East & Africa Market Size (US$ Mn) and Volume (Units) Forecast, by End-Use Industry, 2026-2033
- Consumer Electronics
- Automotive Electronics
- Telecommunications & Networking
- Healthcare & Medical Devices
- Others
- Competition Landscape
- Market Share Analysis, 2025
- Market Structure
- Competition Intensity Mapping
- Competition Dashboard
- Company Profiles
- Henkel AG & Co. KGaA
- Company Overview
- Product Portfolio/Offerings
- Key Financials
- SWOT Analysis
- Company Strategy and Key Developments
- Namics Corporation
- ASE Group
- MacDermid Alpha Electronic Solutions
- Parker LORD Corporation
- H.B. Fuller Company
- Dow Inc.
- ELANTAS GmbH
- Zymet Inc.
- Hitachi Chemical Co., Ltd. / Showa Denko Materials Co., Ltd.
- Panasonic Corporation
- AI Technology, Inc.
- Indium Corporation
- Sanyu Rec Co., Ltd.
- Protavic International
- Henkel AG & Co. KGaA
- Appendix
- Research Methodology
- Research Assumptions
- Acronyms and Abbreviations

Loading page data
Please wait a moment


