


- Nutraceuticals & Functional Foods
- Fortified Foods Market
Fortified Foods Market Size, Share, Growth, and Regional Forecast, 2026 to 2033
Fortified Foods Market by Micronutrients (Vitamins, Minerals, Folic Acid, Others), by Food Products (Flours, Cereals & Pulses, Salt, Edible Oils, Milk, Others), by Technology (Drying, Extrusion, Coating & Encapsulation, Others), by Distribution Channel (B2B, B2C), and Regional Analysis from 2026 to 2033
Fortified Foods Market Share and Trends Analysis
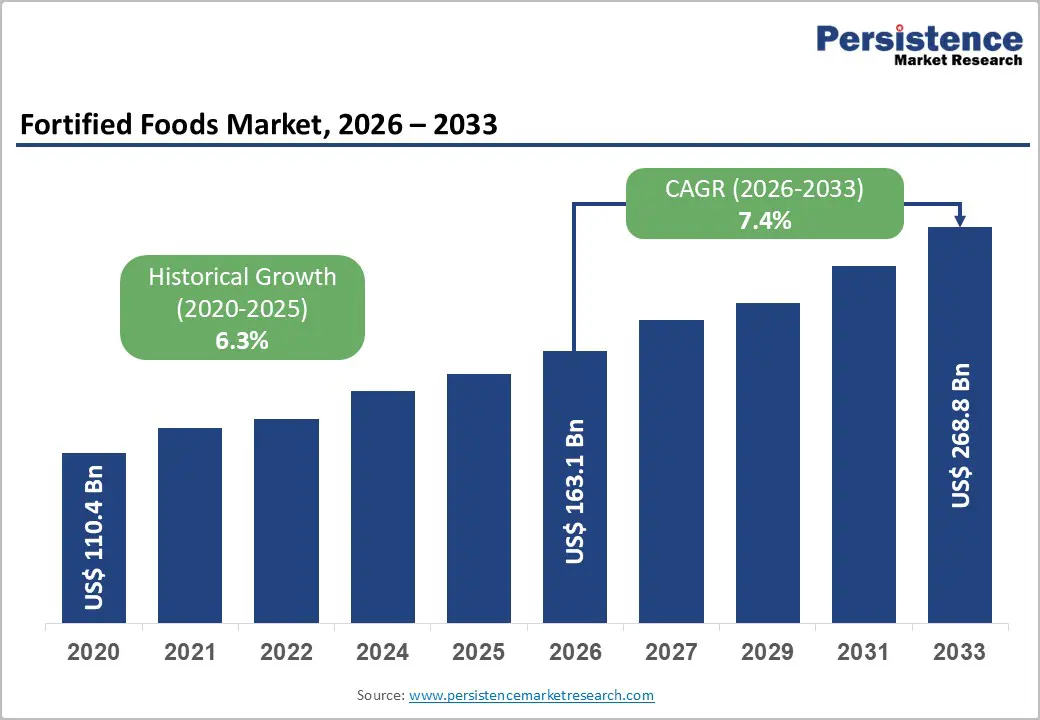
The global fortified foods market size is estimated to grow from US$ 163.1 billion in 2026 to US$ 268.8 billion by 2033, growing at a CAGR of 7.4% during the forecast period from 2026 to 2033.
Fortified foods are rapidly transitioning from niche health products to everyday dietary essentials, driven by preventive wellness thinking and population-wide nutrition goals. Innovation, regulation, and institutional demand are jointly shaping a resilient, purpose-led market landscape.
Key Industry Highlights
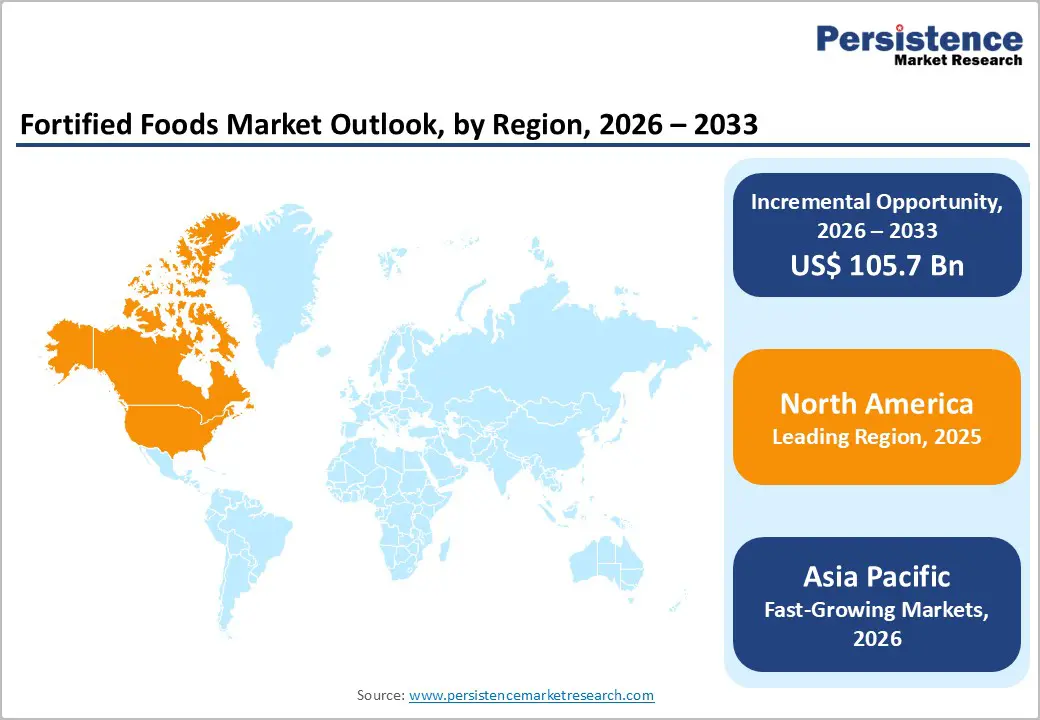
- Leading Region: North America is likely to account for 39% share, supported by strong preventive health awareness, widespread adoption of fortified staples, and high trust in science-backed nutrition.
- Fastest-Growing Region: Asia Pacific, driven by urbanization, government-backed fortification programs, rising middle-class spending, and growing focus on micronutrient adequacy across daily diets.
- Fastest-Growing Food Product Segment: Fortified flours, benefiting from high daily consumption, ease of large-scale fortification, and alignment with public health and bakery-led demand.
- Market Drivers: Rising consumer health awareness and preventive wellness spending are accelerating demand for vitamins- and mineral-enriched foods integrated into regular eating habits.
- Opportunities: Developing targeted micronutrient solutions for children, elderly, and pregnant populations to secure long-term clinical, institutional, and public nutrition contracts.
- Key Developments: In August 2025, MIT introduced a novel iron-iodine fortification technology using metal-organic frameworks. In April 2025, Biovit and Purition launched the UK’s first naturally fortified porridge under the Build & Restore brand.
| Key Insights | Details |
|---|---|
| Fortified Foods Market Size (2026E) | US$ 163.1 Bn |
| Market Value Forecast (2033F) | US$ 268.8 Bn |
| Projected Growth (CAGR 2026 to 2033) | 7.4% |
| Historical Market Growth (CAGR 2020 to 2025) | 6.3% |
Market Dynamics
Driver - Rising Consumer Health Awareness and Preventive Wellness Spending
Wellness has moved from an occasional choice to a daily priority, reshaping how consumers approach food purchases across age groups. Growing awareness around immunity, gut health, bone strength, and long-term disease prevention is pushing households to seek foods that deliver added nutritional value beyond basic calories. Fortified foods enriched with vitamins, minerals, probiotics, and functional ingredients are gaining traction as convenient solutions that fit into regular diets without requiring lifestyle overhauls. This shift is evident in staples such as cereals, dairy alternatives, beverages, and snacks that now double as preventive nutrition tools.
Preventive wellness spending is rising as consumers take greater responsibility for their health outcomes. Parents, aging populations, and fitness-oriented buyers increasingly view fortified foods as cost-effective investments in long-term well-being. Brands responding with science-backed formulations and clear benefit communication are accelerating adoption across both developed and emerging markets.
Restraints - Taste, Color, and Stability Challenges
Sensory performance remains a critical hurdle in the fortified foods market, where added nutrients often disrupt taste, color, and overall product appeal. Minerals, vitamins, and functional compounds can introduce metallic notes, bitterness, or unexpected aftertastes that reduce repeat purchases. Color instability caused by nutrient interactions or oxidation further complicates formulation, especially in beverages, dairy alternatives, and baked goods, where visual consistency strongly influences consumer trust.
Stability challenges intensify across processing, storage, and distribution stages. Heat, light, and moisture can degrade sensitive nutrients, lowering efficacy before products reach consumers. Brands must invest in encapsulation, reformulation, and advanced packaging, increasing development time and cost. These technical barriers slow innovation cycles and limit the speed at which fortified products can scale globally.
Opportunity - Formulating Targeted Micronutrient Packs (Children, Elderly, Pregnant) To Win Clinical and Institutional Contracts
Precision-led nutrition is reshaping how fortified foods are positioned, opening strong opportunities around targeted micronutrient packs designed for children, the elderly, and pregnant populations. Each group carries distinct nutritional requirements, pushing manufacturers to develop age- and life-stage-specific formulations that address immunity, bone health, cognitive development, and maternal wellness. Tailored packs allow brands to move beyond mass fortification toward clinically relevant nutrition solutions aligned with public health priorities.
Institutional buyers such as hospitals, schools, elder care facilities, and maternal health programs increasingly favor standardized, evidence-based nutrition formats. Startups can compete by offering modular, easy-to-dispense fortified foods with clear dosing and compliance advantages. For established players, this approach strengthens access to long-term supply contracts, stable volumes, and higher trust across regulated and healthcare-linked channels.
Category-wise Analysis
By Micronutrients Insights
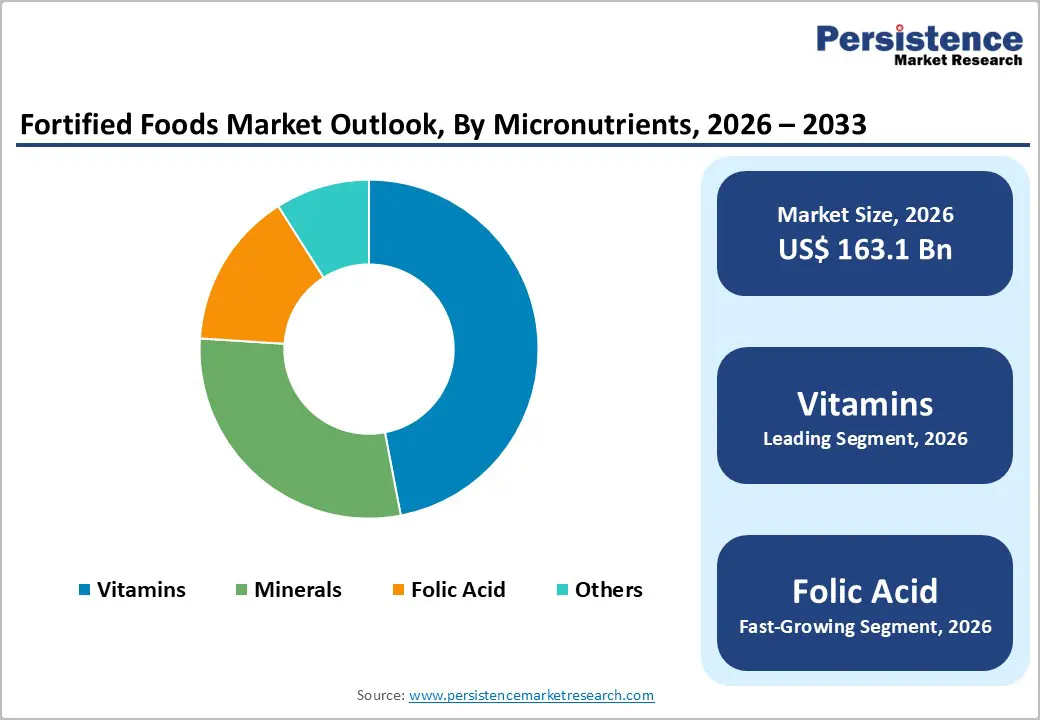
Vitamins are likely to account for nearly. 47% share as of 2025, underscoring their dominance in the global fortified foods market as everyday nutrition shifts from treatment to prevention. Their broad relevance across immunity, energy metabolism, bone health, and cognitive function makes vitamins the most widely accepted and easily integrated micronutrients across staples, beverages, snacks, and infant foods. Manufacturers favor vitamins due to their formulation flexibility, strong consumer familiarity, and ability to support multiple on-pack health claims. Regular dietary gaps and lifestyle-driven deficiencies further reinforce demand, positioning vitamins as the foundation of most fortification strategies worldwide.
Minerals are a critical component, supporting fortification aimed at bone health, hydration balance, and metabolic health, particularly in cereals and dairy alternatives. Folic acid remains a key component of maternal and prenatal nutrition, with consistent inclusion in flour and grain fortification programs focused on early-stage health outcomes.
By Food Products Insights
Flours are projected to grow at a CAGR of 8.4% in the global fortified foods market during the forecast period, reflecting their central role in daily diets and large-scale nutrition programs. As a widely consumed staple, flour offers an efficient vehicle for delivering essential micronutrients such as iron, vitamins, and folic acid without altering eating habits. Governments, bakeries, and food manufacturers are increasingly aligning around fortified flour to address nutrient gaps at the population scale, especially in urbanizing regions where packaged staples dominate household consumption.
Demand is further supported by the rising production of fortified bakery goods, instant mixes, and ready-to-cook products. Advances in premix stability and milling technology are enabling consistent nutrient retention while maintaining taste and texture. With strong penetration across households, foodservice, and institutional feeding, fortified flours are positioned for sustained and scalable growth.
Region-wise Insights
North America Fortified Foods Market Trends
North America holds approximately 39% share in the global fortified foods market, reflecting a mature yet innovation-driven landscape shaped by preventive health priorities. In the United States, fortified cereals, dairy alternatives, and functional beverages are gaining momentum as consumers actively seek products supporting immunity, bone health, and metabolic wellness. Food brands are focusing on clean-label fortification, sugar reduction, and bioavailable vitamin formats to meet evolving nutritional expectations.
In Canada, demand for fortified staples such as flours, plant-based drinks, and snack foods is rising and aligned with national nutrition guidelines. Manufacturers are emphasizing transparency, responsible sourcing, and targeted fortification for aging populations and active lifestyles. Retailers and foodservice operators are expanding fortified offerings, reinforcing North America’s leadership in science-backed, everyday nutrition solutions.
Asia Pacific Fortified Foods Market Trends
Asia Pacific fortified foods market is expected to grow at a CAGR of 8.7%, driven by shifting dietary habits, urban lifestyles, and rising focus on micronutrient adequacy. In India, large-scale adoption of fortified flours, edible oils, and salt continues as consumers prioritize everyday nutrition linked to immunity and energy. China is accelerating demand for fortified dairy alternatives, beverages, and infant foods as middle-income households seek science-backed wellness products.
In Japan, precision nutrition is shaping fortified foods tailored to aging populations, with an emphasis on vitamins, minerals, and functional ingredients that support bone and cognitive health. South Korea is seeing strong traction for fortified snacks, cereals, and ready-to-drink beverages that align with busy, fitness-oriented lifestyles. Across the region, innovation in taste, format, and convenience is reshaping how fortified nutrition fits into daily consumption.
Competitive Landscape
The global fortified foods market exhibits a moderately fragmented competitive landscape, with established food manufacturers and agile startups competing on formulation expertise, scale, and speed to market. Leading companies are strengthening portfolios by embedding vitamins, minerals, and functional ingredients into everyday staples while upgrading processing technologies to preserve taste and stability. Clean-label positioning has become central, with simplified ingredient lists and transparent sourcing gaining priority. Startups are entering with condition-specific products, innovative delivery formats, and digitally driven brand education. Collaborations, MoUs, and public-private partnerships are expanding access to institutional channels such as schools and healthcare programs. Rising consumer awareness around micronutrient deficiencies is amplifying demand, while government regulations on fortification standards, labeling, and safety are shaping product design, compliance strategies, and long-term competitive differentiation.
Key Developments:
- In November 2025, Tata Chemicals advanced its expansion strategy in India to address escalating domestic demand. The company announced plans to boost its salt production capacity by 200,000 tonnes.
- In August 2025, MIT researchers unveiled an iron-and-iodine fortification toolbox using metal-organic frameworks to address global malnutrition. The breakthrough enabled stable nutrient delivery across everyday foods and beverages, including coffee, tea, and bread.
- In April 2025, Biovit and Purition introduced the “world’s first” naturally fortified porridge in the UK under the Build & Restore brand. The product was formulated to support individuals with low appetite, chewing or swallowing challenges, or those recovering from illness or surgery.
- In March 2025, Danone Southern Africa rolled out its Nutriday Orange-Pine Dairy Drink across South Africa, featuring a refreshing orange-pineapple blend in a family-friendly 1.5-liter pack. The launch highlighted its fortification with live cultures and 12 essential vitamins and minerals, including vitamins A, D, E, B2, B6, B12, zinc, and calcium.
Companies Covered in Fortified Foods Market
- Nestlé S.A.
- BASF SE
- General Mills
- Tata Chemicals Limited
- Unilever PLC
- Cargill Incorporated
- Danone
- Bunge Limited
- Unilever PLC
- Koninklijke DSM NV
- Stern-Wywiol GmbH & Co.KG
- Others
Frequently Asked Questions
The global Fortified Foods market is projected to be valued at US$ 163.1 Bn in 2026.
Rising consumer health awareness and preventive wellness spending is driving the expansion of the global Fortified Foods market.
The global Fortified Foods market is poised to witness a CAGR of 7.4% between 2026 and 2033.
Formulating targeted micronutrient packs (children, elderly, pregnant) to win clinical and institutional contracts is a key opportunity for companies operating in the Fortified Foods industry.
Major players in the global Fortified Foods market include Nestlé S.A., BASF SE, General Mills, Tata Chemicals Limited, Unilever PLC, Cargill Incorporated, Danone, and others.


