


- Nutraceuticals & Functional Foods
- U.S. Seafood Market
U.S. Seafood Market Size, Share, and Growth Forecast, 2026 - 2033
U.S. Seafood Market by Product Type (Fish, Shrimp, Crab, Lobster, Mollusks, Others), Form (Fresh, Frozen, Canned, Processed), Distribution Channel (Supermarkets, Specialty Stores, Online Retail, Foodservice), and Zonal Analysis for 2026 - 2033
U.S. Seafood Market Size & Trends Analysis
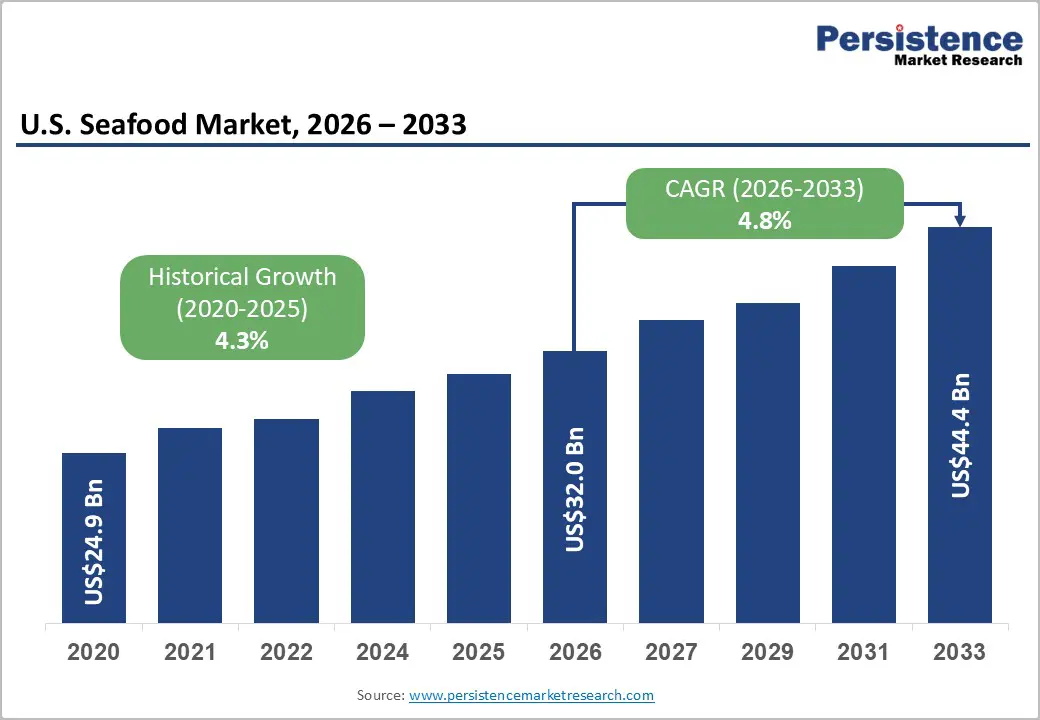
The U.S. seafood market size is likely to be valued at US$32.0 billion in 2026 and is projected to reach US$44.4 billion by 2033, growing at a CAGR of 4.8% during the forecast period from 2026 to 2033, driven by rising seafood consumption, increasing consumer preference for high-protein diets, and growing demand for convenient frozen and processed seafood products.
Strong retail penetration, innovations in cold-chain logistics, and expanding e-commerce channels continue to support market growth. Additionally, increasing awareness of the nutritional benefits of fish and shellfish, including omega-3 fatty acids and lean protein content, is driving long-term demand across U.S. households and foodservice establishments.
Key Industry Highlights:
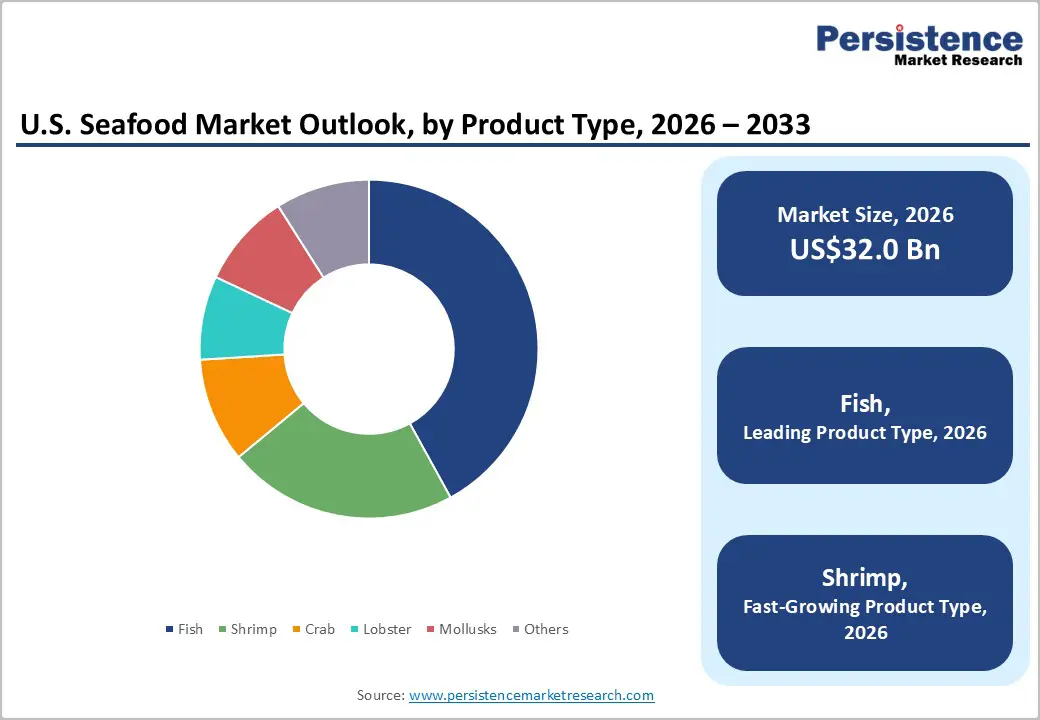
- Dominant Product Type: Fish is set to command around 40% of the market share in 2026, while shrimp is likely to be the fastest-growing product segment through 2033, driven by rising demand for premium and value-added seafood products.
- Leading Form: Frozen seafood is anticipated to lead with an estimated 38% share in 2026, whereas processed seafood is projected to be the fastest-growing form segment during 2026 - 2033, supported by growing demand for convenient meal solutions.
- Dominant Distribution Channel: Supermarkets are expected to account for nearly 46% of seafood sales in 2026, while online retail is slated to represent the fastest-growing distribution channel through 2033 as digital grocery adoption accelerates.
- Competitive Environment: Competitive activity is centered on acquisitions, value-added product development, and supply-chain optimization, with industry consolidation accelerating through strategic transactions and portfolio expansion initiatives.
DRO Analysis
Driver - Rising Per Capita Seafood Consumption and Health-Focused Dietary Trends
Demand for seafood in the U.S. continues to benefit from growing consumer preference for lean protein and nutrient-rich foods. According to the National Oceanic and Atmospheric Administration (NOAA), U.S. consumers consumed approximately 20 pounds of seafood per capita in 2023, maintaining levels above pre-pandemic consumption trends. Salmon, shrimp, and tuna consistently rank among the most consumed seafood species in the country, reflecting strong consumer acceptance across retail and foodservice channels.
Increasing availability of frozen, processed, and ready-to-cook seafood products has improved accessibility and convenience for consumers. Combined with growing interest in high-protein diets, these factors continue to support steady expansion of the U.S. seafood market.
Restraint - High Import Dependence and Supply-Side Cost Pressures
The U.S. seafood industry remains vulnerable to external supply shocks due to its dependence on imports. According to NOAA Fisheries, nearly 70-80% of seafood consumed in the United States is imported, exposing the market to trade disruptions, tariff changes, logistics bottlenecks, and currency fluctuations.
At the same time, domestic wild-catch fisheries operate under strict quota systems designed to protect fish stocks, limiting production growth. Rising fuel costs, labor shortages, refrigeration expenses, and transportation charges have further increased operating costs across the seafood value chain. These pressures can elevate retail seafood prices, reduce profit margins, and constrain consumption growth among price-sensitive consumers.
Opportunity - Expansion of Value-Added Seafood Consumption and Dietary Adoption
Value-added seafood products represent one of the most attractive growth opportunities in the U.S. market. According to the Dietary Guidelines for Americans, adults are recommended to consume at least 8 ounces of seafood per week; however, actual consumption levels remain below recommended intake for many consumers, indicating substantial room for market expansion. This gap creates opportunities for seafood producers and retailers to increase penetration through convenient and accessible product formats.
Seafood processors are responding with a growing range of ready-to-cook shrimp, breaded fish, seafood meal kits, and frozen seafood products. The expansion of e-commerce grocery platforms and home-delivery services is further accelerating demand for packaged seafood offerings. As consumers increasingly seek convenient, protein-rich meal solutions, value-added seafood categories are expected to capture a larger share of household food spending and drive future market growth.
Category-wise Analysis
Product Type Insights
Fish is projected to remain the leading product segment, accounting for approximately 42% of the U.S. seafood market in 2026. This dominance is structurally supported by NOAA consumption data, which shows fish (including salmon, tuna, cod, and pollock) contribute the largest share of the estimated ~20-21 lbs per capita annual seafood consumption in the U.S. Salmon alone represents one of the highest-value imported seafood categories, reinforcing its retail and foodservice penetration. Fish also benefits from diversified availability across fresh, frozen, and canned formats, enabling year-round consumption stability across all income groups.
Shrimp is expected to be the fastest-growing segment, expanding at a CAGR of 5.6% through 2033. According to NOAA trade statistics, shrimp account for approximately 30-35% of total U.S. seafood import value, making them the single largest imported seafood category. This high import dependence ensures consistent supply availability and pricing competitiveness. Growth is further reinforced by strong menu penetration across QSR and casual dining chains, where shrimp-based offerings continue to expand due to aquaculture supply from India, Ecuador, and Southeast Asia.
Form Insights
Frozen seafood is projected to lead the market with nearly a 38% share in 2026. The USDA food distribution patterns indicate frozen seafood maintains the highest penetration in inland U.S. regions due to logistics efficiency and reduced spoilage risk. Industry benchmarks show frozen formats account for roughly 35-40% of total retail seafood sales, supported by expansion of IQF (Individually Quick Frozen) systems that improve product retention quality by reducing thaw-loss and texture degradation. Major retailers such as Walmart, Kroger, and Costco continue expanding frozen seafood SKUs, strengthening category dominance.
Processed seafood is expected to be the fastest-growing form segment, registering a CAGR of 5.8% during the forecast period from 2026 to 2033. NielsenIQ packaged food tracking highlights sustained growth in ready-to-cook frozen meals, with seafood-based SKUs among the fastest-expanding convenience food categories. Processed seafood currently holds an estimated 20-25% share of retail seafood value, but is expanding faster due to increasing demand for breaded fish portions, seafood bowls, and microwaveable protein meals. Rising dual-income households continue to structurally support convenience-driven consumption.
Distribution Channel Insights
Supermarkets are expected to dominate distribution with approximately a 46% share in 2026. The USDA retail food expenditure data show that over 60% of seafood purchases occur through brick-and-mortar grocery formats, with supermarkets capturing the largest share due to cold-chain infrastructure and wide product assortment. Chains such as Kroger, Walmart, and Albertsons continue expanding private-label seafood offerings, improving affordability and strengthening shelf penetration across frozen and fresh categories.
Online retail is projected to be the fastest-growing distribution channel, expanding at 5.7% CAGR through 2033. The U.S. Census Bureau e-commerce data confirms structural growth in online grocery penetration post-pandemic, with seafood emerging as a high-growth category due to improved insulated packaging and cold-chain logistics. Online grocery currently accounts for an estimated 12-15% share of total food retail transactions, with platforms such as Instacart and Amazon Fresh accelerating seafood delivery adoption in urban markets.
Zonal Analysis
U.S. Seafood Market Overview
The U.S. is the largest seafood consumption market, supported by 20-21 lbs per capita intake (NOAA) and a structurally import-dependent system where 70-80% of seafood supply is sourced globally. Demand is strongly retail-led, with supermarkets accounting for over 60% of seafood sales, while frozen and processed products continue gaining share due to convenience, affordability, and longer shelf life.
West U.S. Seafood Market Trends and Insights
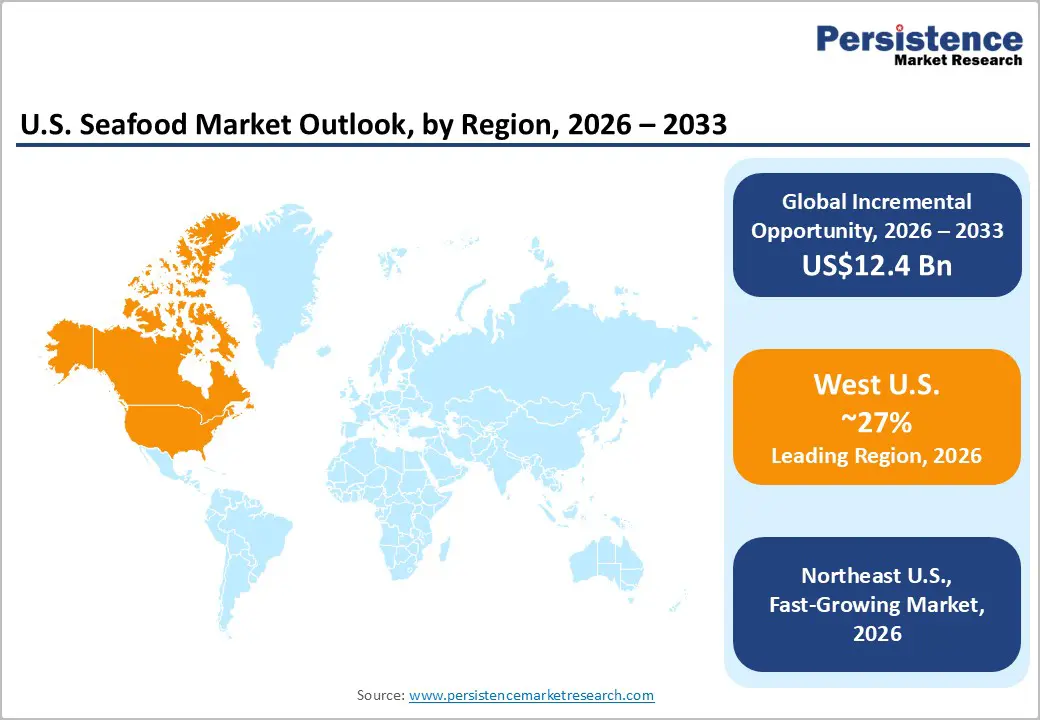
The West region is likely to account for approximately 27% of U.S. seafood demand in 2026, driven by coastal states such as California, Washington, and Oregon. Strong coastal access supports fresh seafood consumption, while large urban populations in California drive premium demand for salmon, tuna, and sushi-grade fish. The region also serves as a key import gateway for Asia-Pacific seafood flows through Pacific ports. Rising consumer preference for sustainably certified seafood and ready-to-eat formats is shaping retail innovation across major grocery chains.
Southeast U.S. Seafood Market Size
The Southeast is projected to contribute around 22% of national seafood consumption in 2026, supported by dense population clusters and strong seafood traditions. States like Florida, Georgia, and the Carolinas show particularly high demand for shrimp, crab, and frozen seafood products. The region’s tourism-driven foodservice sector significantly boosts seafood consumption, especially in coastal cities. Warm climate conditions and established distribution networks further support steady retail penetration of both frozen and value-added seafood offerings.
Northeast U.S. Seafood Market Size
The Northeast is expected to account for around 18% of U.S. seafood consumption in 2026, supported by high-income urban centers such as New York and Boston. The region demonstrates a strong preference for premium seafood categories including lobster, cod, and shellfish, driven by established culinary traditions and high restaurant density. Proximity to Atlantic fisheries improves access to fresh seafood, strengthening local supply chains and supporting a higher share of fresh seafood consumption compared to inland regions.
Competitive Landscape
The U.S. seafood market is moderately fragmented with growing consolidation at the top, where key players such as Trident Seafoods, Thai Union Group, Mowi ASA, Bumble Bee Seafoods, and High Liner Foods hold strong positions across frozen, canned, and processed seafood segments. These companies leverage large-scale sourcing networks, vertically integrated supply chains, and strong retail partnerships with major supermarket chains. Competitive advantage is increasingly driven by cold-chain efficiency, private-label expansion, and value-added seafood product innovation, helping incumbents maintain scale in an import-heavy market.
Alongside this, regional processors and niche sustainable seafood brands are expanding through premium positioning and direct-to-consumer channels. Growth of e-commerce and demand for traceable, sustainability-certified seafood are enabling smaller players to compete in high-margin segments. However, high entry barriers such as FDA compliance, cold-chain infrastructure requirements, and global sourcing dependency limit large-scale new entry. Overall, competition is intensifying as established players strengthen consolidation while new entrants focus on differentiated, premium, and digitally enabled seafood offerings.
Key Industry Developments:
- In June 2025, High Liner Foods acquired Mrs. Paul’s and Van de Kamp’s frozen seafood brands to strengthen its U.S. retail frozen seafood portfolio and expand private-label manufacturing scale. The deal integrated approximately 25 million lbs of annual U.S. co-manufactured seafood volume, reinforcing supply-chain control in value-added frozen fish products.
- In 2025, Mowi reported a record-breaking full-year harvest volume of 558,870 gutted weight tonnes of Atlantic salmon, marking its strongest annual performance. This reflects continued global demand strength for salmon and highlights improving operational efficiency and scaling in aquaculture-driven seafood supply chains.
Companies Covered in U.S. Seafood Market
- Trident Seafoods
- Thai Union Group
- High Liner Foods
- Mowi ASA
- Cooke Inc.
- Pacific Seafood
- Bumble Bee Seafoods
- Maruha Nichiro Corporation
- Nippon Suisan Corporation
- Beaver Street Fisheries
- Red Lobster Seafood Co.
- American Seafoods
- Ocean Beauty Seafoods
- Clearwater Seafoods
Frequently Asked Questions
The U.S. seafood market is projected to reach US$32.0 billion in 2026.
Rising health-focused protein consumption, high import dependence, and strong demand for frozen and processed seafood drive the market.
The U.S. seafood market is expected to grow at a CAGR of 4.8% from 2026 to 2033.
Growth is driven by value-added seafood products, e-commerce expansion, and increasing demand for convenient frozen seafood formats.
Key players include Trident Seafoods, Thai Union Group, Mowi ASA, Bumble Bee Seafoods, and High Liner Foods.


