


- Plastics, Polymers & Resins
- Cast Polymers Market
Cast Polymers Market Size, Share, and Growth Forecast 2026 - 2033
Cast Polymers Market by Product Type (Solid Surface, Engineered Stone, Cultured Marble), Material Type (Alumina Trihydrate, Calcium Carbonate, Resins, Natural Stone/Quartz), End User (Non-residential, Residential), and sRegional Analysis, 2026 - 2033
Cast Polymers Market Size and Trend Analysis
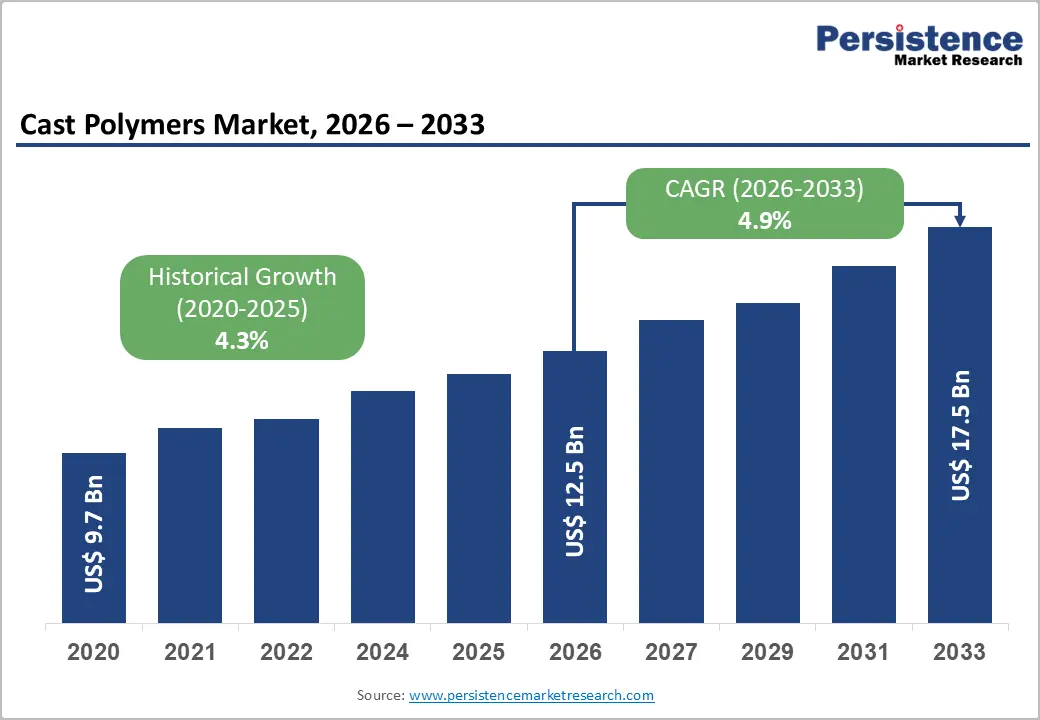
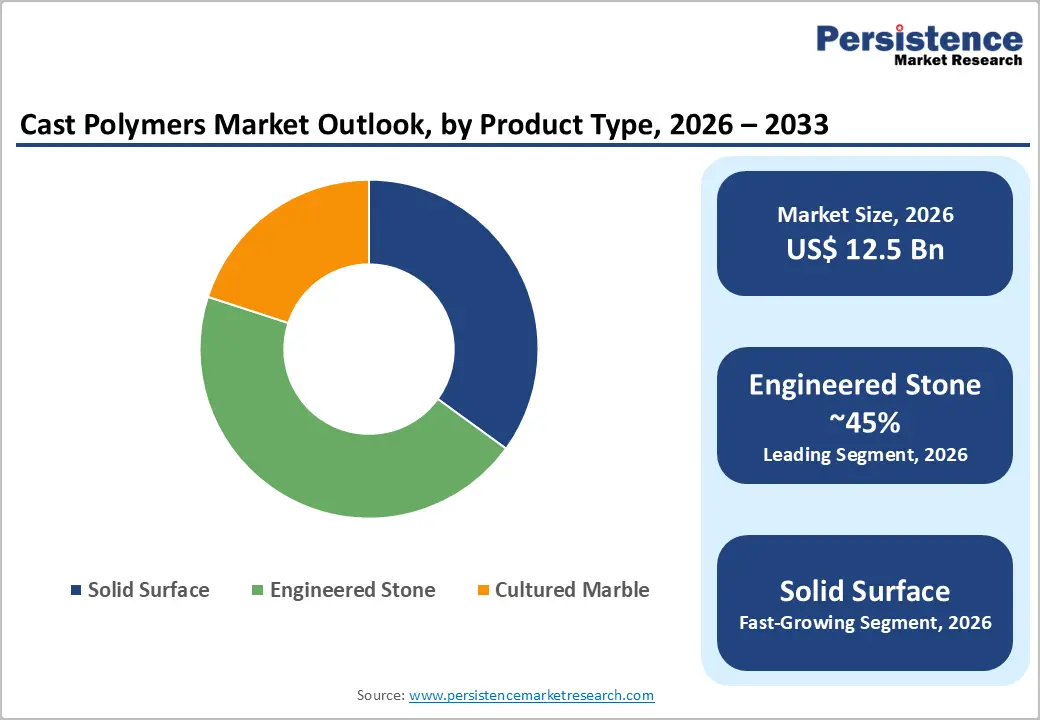
The global cast polymers market size is expected to be valued at US$ 12.5 billion in 2026 and projected to reach US$ 17.5 billion by 2033, growing at a CAGR of 4.9% between 2026 and 2033.
This consistent growth is driven by expanding global residential and commercial construction activity requiring premium surface materials, rising consumer preference for engineered stone countertops in kitchen and bathroom renovations, and the rapid growth of the Asia Pacific construction sector, driving demand for cost-effective and aesthetically superior cast polymer surface solutions.
The market grew from US$ 9.7 billion in 2020 at a historical CAGR of 4.3%, underpinned by the global kitchen and bath remodeling market's sustained expansion, growing specification of solid surface materials in healthcare and hospitality non-residential projects due to their hygienic, seamless, and non-porous properties, and Middle East infrastructure investment driving premium surface material demand across GCC construction programs.
Key Industry Highlights
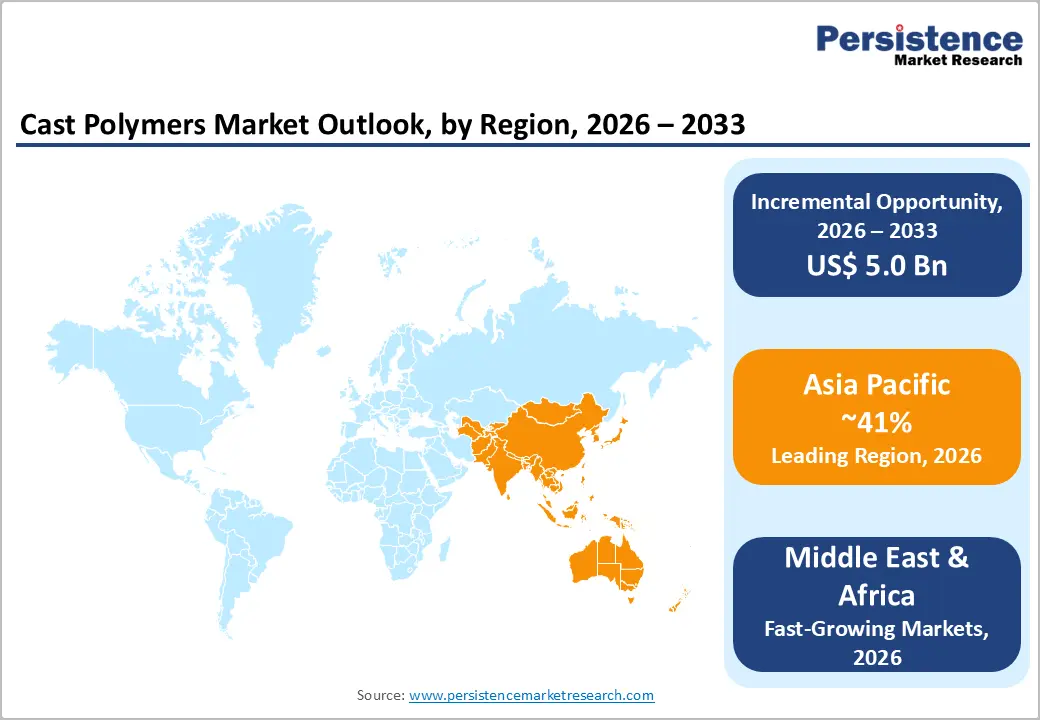
- Leading Region: Asia Pacific commands 41% global cast polymers market share in 2026, anchored by China's 52% intra-regional dominance as both the world's largest engineered stone manufacturer and a massive construction surface procurement market, alongside South Korea's LX Housys and LOTTE Chemical as major regional producers.
- Fastest Growing Region: MEA is the fastest growing cast polymers region through 2026 - 2033, driven by Saudi Arabia's NEOM and Red Sea Project mega-developments, the UAE's We the UAE 2031 construction programs, and Cosentino, Caesarstone, and LX Housys expanding Gulf state distribution and specification partnerships.
- Dominant Product Segment: Engineered stone holds 45% product type market share in 2026, dominating through NKBA-documented U.S. countertop specification leadership, Breton SpA Bretonstone quartz technology licensing to 200+ global manufacturers, and premium residential and commercial designation as the leading countertop material globally.
- Fastest Growing Segment: Large-format slabs, including Cosentino Silestone XM and Caesarstone jumbo formats, are the fastest growing product innovation, driven by NKBA-documented design trend leadership and architect/interior designer specification of seamless continuous surfaces in premium residential and commercial kitchen and cladding projects.
- Key Opportunity: Saudi Arabia's NEOM, Red Sea Project, and Diriyah Gate combined with India's PMAY housing program at 7.2% CAGR represent the two highest-growth incremental cast polymer demand sources, covering premium commercial surface and volume residential countertop market tiers through 2033.
DRO Analysis
Drivers - Residential Renovation Boom and Kitchen & Bath Countertop Premiumization Driving Engineered Stone Demand
The global residential renovation market's sustained growth, driven by homeowner investment in kitchen and bathroom upgrades, is the primary demand driver for cast polymer surface products, particularly engineered stone and solid surface countertops that are displacing traditional ceramic tile and laminate alternatives. The Home Improvement Research Institute (HIRI) documents consistent growth in U.S. kitchen and bathroom remodeling spending, while Eurostat confirms European residential renovation investment sustained even through economic cycles.
Engineered stone products, comprising quartz-based and acrylic-based surfaces, offer consumers the aesthetic appeal of natural stone combined with superior stain resistance, consistent coloration, and lower maintenance requirements. Premium brands, including Caesarstone Ltd., Cosentino's Silestone, and Breton SpA's Bretonstone technology, have established engineered stone as the aspirational countertop specification in mid-to-premium residential renovation programs globally.
Healthcare and Hospitality Non-Residential Construction Specifying Solid Surface Materials
The non-residential construction sector, particularly healthcare facilities, hospitality properties, and commercial washrooms, is generating growing demand for solid surface cast polymers due to their hygienic properties, seamless fabrication capability, and design versatility that make them the preferred specification for infection-control-critical environments.
The U.S. Centers for Disease Control and Prevention (CDC) guidelines and Healthcare Infection Control Practices Advisory Committee (HICPAC) recommendations emphasize the importance of seamless, non-porous surfaces in clinical environments, a characteristic that solid surface materials including DuPont Corian) and LX Housys HI-MACS uniquely provide. Major hotel chains and healthcare networks are specifying solid surface materials for vanity tops, reception desks, nurse stations, and bathroom surrounds, creating consistent institutional procurement volumes that sustain non-residential segment demand growth.
Restraints - Competition from Natural Stone and Large-Format Porcelain Tile Alternatives
Cast polymer surface materials face sustained competition from natural stone slabs (granite, marble, quartzite) and large-format porcelain tile panels in the premium countertop and cladding market. The growing accessibility of imported natural granite and marble from India and Brazil, at competitive price points due to efficient quarrying and logistics, and the rapid development of ultra-large porcelain tile (sintered stone) by manufacturers including Dekton by Cosentino and Neolith, offer consumers premium alternatives that directly compete with engineered stone and solid surface in the upper price tiers of the residential renovation market.
Raw Material Cost Volatility and Supply Chain Exposure for Resin and ATH
Cast polymer production relies on methyl methacrylate (MMA) resins, unsaturated polyester resins, and alumina trihydrate (ATH) as primary inputs whose prices fluctuate with petrochemical feedstock cycles and specialty chemical production economics. MMA price cycles, documented by ICIS Chemical Business as having 40-60% price swings between supply-demand cycle extremes, directly impact solid surface production margins. This input cost volatility creates margin pressure for cast polymer manufacturers during feedstock price spike periods, complicating multi-year contract pricing and capital investment planning.
Opportunities - Middle East & Africa Infrastructure Investment: Fastest Growing Regional Opportunity
The Middle East & Africa region represents the fastest growing cast polymers market, driven by GCC mega-project construction programs under Saudi Arabia's Vision 2030, the UAE's We the UAE 2031, and Qatar's post-World Cup infrastructure development, which are specifying premium cast polymer surfaces across luxury hospitality, commercial, and residential projects.
Saudi Arabia's NEOM, Red Sea Project, and Diriyah Gate developments involve millions of square meters of interior surface specification across hotel, residential, and commercial categories, generating substantial cast polymer procurement. Africa's rapidly expanding urban construction sector is additionally generating volume demand for cost-effective cultured marble and solid surface products across residential and hospitality applications.
Engineered Stone Technology Innovation and Large-Format Surface Trend
The cast polymers industry is experiencing a technology-driven premium product opportunity from the large-format slab trend, where countertops and wall cladding panels are specified in increasingly large dimensions that showcase a continuous surface aesthetic without grout lines or panel joints. Breton SpA's Bretonstone engineered stone technology enables production of slabs up to 3.2 m × 1.6 m, while Caesarstone's jumbo slab format and Cosentino's Silestone XM extra-large format products are gaining specification in premium residential and commercial interior design programs.
The National Kitchen & Bath Association (NKBA) documents large-format surfaces as among the fastest growing kitchen design trends, with architect and interior designer specification increasingly favoring large-format engineered stone for its premium aesthetic impact. This trend drives higher per-project cast polymer spend and supports premium price-tier product development.
Category-wise Analysis
Product Type Insights
Engineered Stone is the leading Product Type segment, accounting for approximately 45% market share in 2026. Engineered stone, produced by combining 93-95% natural quartz aggregate with polyester or acrylic resin binders under high-pressure vibrocompression using Breton SpA's licensed technology, has established itself as the dominant premium countertop material globally, displacing natural granite in new kitchen installations across the U.S., Europe, and Asia Pacific.
The National Kitchen & Bath Association (NKBA) consistently identifies engineered stone as the top countertop specification in kitchen remodeling projects in the U.S. premium segment. Its combination of natural mineral aesthetics, superior hardness (Mohs 7+), non-porous hygienic surface, and resistance to heat and staining makes it the preferred specification for both residential and commercial kitchen and bathroom applications globally.
Material Type Insights
Alumina Trihydrate (ATH) is the leading material type for cast polymer production, accounting for approximately 42% market share in 2026. ATH, a white, fine-particle aluminum hydroxide mineral derived from bauxite processing, serves as the primary filler in solid surface and cultured marble cast polymer formulations, providing the material's fire-retardant properties, opacity, workability, and surface finish quality.
The Huber Engineered Materials and The R.J. Marshall Company are the leading ATH suppliers to the cast polymer industry globally. ATH's fire-retardant characteristics are critical for commercial building compliance in the hospitality, healthcare, and retail sectors, where surface materials must meet Class A flame spread ratings under ASTM E84 and equivalent international standards, sustaining ATH's dominant material position.
End-user Insights
Residential end users are the dominant segment, accounting for approximately 58% of the cast polymers market consumption in 2026. The residential segment's dominance reflects the enormous global scale of kitchen and bathroom countertop replacement and new construction specification cycles, with the HIRI documenting kitchen and bathroom renovation as consistently among the two highest-spending home improvement project categories.
Residential cast polymer demand encompasses countertops, vanity tops, bathroom surrounds, and shower bases across both premium and mid-market price tiers. Engineered stone and solid surface products dominate premium residential specifications, while cultured marble serves high-volume entry- to mid-market bathroom vanity and shower surround applications at lower per-unit price points but significant volume scale.
Regional Insights
Asia Pacific leads the global cast polymers market with approximately 41% market share in 2026, while the Middle East & Africa (MEA) is the fastest growing region, projected to record the highest CAGR through 2026 - 2033, driven by GCC Vision 2030 mega-project construction programs and growing hospitality, residential, and commercial surface specification demand.
North America Cast Polymers Market Trends and Insights
North America is the world's most mature cast polymers market, characterized by high engineered stone and solid surface penetration in kitchen and bathroom renovation, the active specification of cast polymer products in healthcare, education, and hospitality non-residential construction, and strong brand presence from DuPont Corian, Caesarstone, Wilsonart, and Formica. Kitchen renovation and countertop replacement cycles sustain consistent residential demand.
U.S. Cast Polymers Market Size
The United States accounts for approximately 80% of the North America cast polymers market revenue in 2026. The U.S. market is driven by HIRI-documented consistent kitchen and bathroom remodeling investment, high engineered stone countertop specification rates in new residential construction, and institutional procurement by healthcare and hospitality facility construction programs. NKBA data confirms engineered stone as the leading U.S. countertop specification. U.S. CAGR is projected at approximately 4.5% through 2033.
Europe Cast Polymers Market Trends and Insights
Europe is a mature, design-led cast polymers market characterized by strong engineered stone specification in kitchen renovation programs, active sustainable material adoption, and leading manufacturers including Cosentino (Spain), Breton SpA (Italy), and BLANCO GmbH (Germany) shaping global product design trends. The EU Construction Products Regulation and sustainability mandates are driving the specification of low-VOC, fire-rated cast polymer products across commercial construction.
Germany Cast Polymers Market Size
Germany holds approximately 22% of Europe cast polymers market revenue in 2026. Germany's strong kitchen and bathroom manufacturing industry, centered on Nolte, Nobilia, and Häcker kitchen manufacturers, drives consistent engineered stone countertop specification at volume. BLANCO GmbH + Co KG is a German-headquartered specialist in cast polymer kitchen sinks. Germany is projected at approximately 4.7% CAGR through 2033.
U.K. Cast Polymers Market Size
The United Kingdom represents approximately 14% of Europe cast polymers market revenue in 2026. The UK's active kitchen and bathroom renovation market, driven by consistent home improvement investment documented by HBIS (Home Builders Federation) data, sustains solid surface and engineered stone demand. Cosentino UK and LX Housys are active specification partners for UK residential and commercial projects. UK CAGR is projected at approximately 4.6% through 2033.
France Cast Polymers Market Size
France accounts for approximately 11% of Europe cast polymers market revenue in 2026. France's design-forward renovation culture, with kitchen and bathroom renovation consistently among the highest-spending home improvement categories per FFSB Fédération Française du Sanitaire et du Chauffage industry data, drives specification of premium cast polymer surfaces. France's active hospitality construction sector is an additional cast polymer procurement driver. France is projected at approximately 4.4% CAGR through 2033.
Asia Pacific Cast Polymers Market Trends and Insights
Asia Pacific dominates global cast polymers production and consumption, anchored by China, which accounts for approximately 52% of Asia Pacific demand, as both the world's largest engineered stone manufacturer and a massive domestic construction market driving surface product procurement. South Korea's LX Housys and LOTTE Chemical are major regional cast polymer producers, while India and Southeast Asia represent rapidly growing consumption markets driven by residential construction expansion.
India Cast Polymers Market Size
India represents approximately 12% of Asia Pacific cast polymers market revenue in 2026. India's rapidly expanding organized residential and commercial construction sector, driven by PMAY housing programs and growing urban middle-class homeownership, is generating growing demand for engineered stone and solid surface countertops as premium alternatives to traditional granite. India is projected at approximately 7.2% CAGR through 2033, among the fastest in the region.
Japan Cast Polymers Market Size
Japan contributes approximately 8% of Asia Pacific cast polymers market revenue in 2026. Japan's sophisticated kitchen and bathroom design culture, served by major appliance and kitchen brands including LIXIL and Panasonic Housing Solutions, drives consistent specification of cast polymer countertops and vanity surfaces in premium residential and hospitality applications. Japan is projected at approximately 4.6% CAGR through 2033.
Southeast Asia Cast Polymers Market Size
Southeast Asia collectively accounts for approximately 10% of Asia Pacific cast polymers market revenue in 2026. Vietnam, Thailand, Indonesia, and Malaysia are experiencing rapid residential construction and hospitality sector growth generating cast polymer surface demand. The region's growing number of international standard hotels and premium residential condominiums are specifying engineered stone and solid surface products. Southeast Asia is projected at approximately 6.5% CAGR through 2033.
Competitive Landscape
The global cast polymers market exhibits a moderately consolidated) competitive structure at the premium product tier, with Cosentino S.A., Caesarstone Ltd., DuPont, LX Housys, and Wilsonart controlling significant global revenue share through brand leadership, OEM supply chain integration, and wide residential and commercial specification programs.
Key competitive differentiators include slab format innovation, surface design breadth, sustainability credentials (recycled content, low-VOC), and global distribution network density. Emerging trends include large-format slab products, ultra-thin lightweight panels for cladding applications, and circular economy recycled material content programs. Engineered stone technology licensing through Breton SpA creates technology-standardized competition among a global manufacturer base.
Key Developments
- In March 2025, Cosentino S.A. launched its Silestone XM extra-large format engineered stone range incorporating 20% recycled content from glass and mirror manufacturing waste, targeting premium residential and commercial design specification programs with certified sustainable surface credentials.
- In October 2024, Caesarstone Ltd. expanded its global distribution network with new distribution agreements in Saudi Arabia and UAE, positioning its engineered stone surfaces for specification in GCC Vision 2030 hospitality and residential mega-project procurement programs.
- In April 2023, LX Housys (formerly LG Hausys) launched its Viatera Recycled Series engineered stone incorporating 70% pre-consumer recycled quartz content, targeting LEED v4 and sustainability-certified commercial construction projects requiring documented recycled material content in interior surface specifications.
Cast Polymers Market - Key Insights & Details
| Key Insights | Details |
|---|---|
| Historical Market Value (2020) | US$ 9.7 Billion |
| Current Market Value (2026) | US$ 12.5 Billion |
| Projected Market Value (2033) | US$ 17.5 Billion |
| CAGR (2026 - 2033) | 4.9% |
| Leading Region | Asia Pacific, 41% market share (2026) |
| Dominant Category - Product Type | Engineered Stone, 45% share (2026) |
| Top-Ranking Category - Material Type | Alumina Trihydrate, 42% share (2026) |
| Incremental Opportunity (2026 - 2033) | US$ 5.0 Billion |
Companies Covered in Cast Polymers Market
- Breton SpA
- LX Housys
- Bradley Corporation
- LOTTE Chemical
- Formica
- DuPont
- Huber Engineered Materials
- Kionkongree International Surface Indus Co.Ltd.
- Gruber System
- Cosentino S.A.
- Caesarstone Ltd.
- The R.J. Marshall Company
- LG Hausys (LX Housys)
- Wilsonart
- BLANCO GmbH + Co KG
Frequently Asked Questions
The global cast polymers market is projected to be valued at US$ 12.5 billion in 2026, growing from US$ 9.7 billion in 2020. The market is forecast to reach US$ 17.5 billion by 2033 at a CAGR of 4.9%, representing an absolute dollar opportunity of US$ 5.0 billion.
Primary drivers include HIRI-documented consistent U.S. kitchen and bathroom remodeling spending growth and Eurostat-confirmed European residential renovation investment sustaining engineered stone countertop demand.
Asia Pacific leads with approximately 41% market share in 2026, with China accounting for 52% of intra-regional demand as both the world's largest engineered stone producer, and India at 7.2% CAGR through 2033 under PMAY housing programs collectively reinforce Asia Pacific's commanding and growing market dominance.
The MEA region represents the highest-growth geographic opportunity, with Saudi Arabia's NEOM, Red Sea Project, and Diriyah Gate development programs requiring premium cast polymer surface specifications across hospitality and residential categories.
Key companies include Cosentino S.A., Silestone, Dekton, Caesarstone Ltd., DuPont, Corian solid surface, LX Housys, HI-MACS, Viatera, Breton SpA, Bretonstone technology licensor, Wilsonart, Formica Group, LOTTE Chemical, Bradley Corporation, BLANCO GmbH + Co KG, Cambria, and Huber Engineered Materials.


