


- Executive Summary
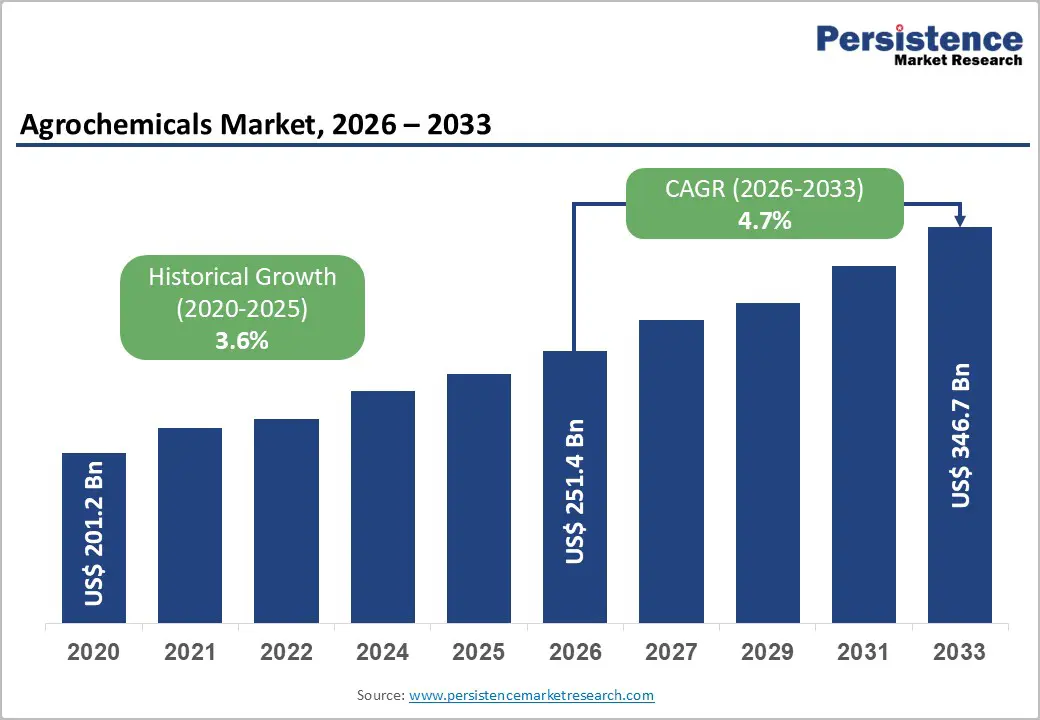
- Global Agrochemicals Market Snapshot, 2026 and 2033
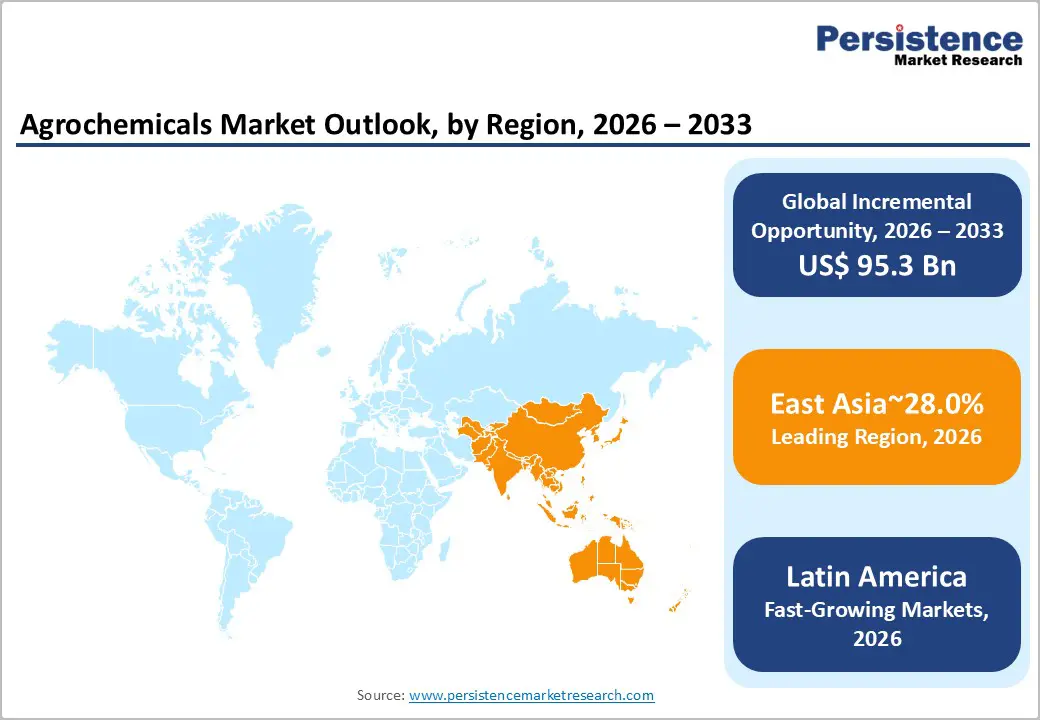
- Market Opportunity Assessment, 2026 - 2033, US$ Mn
- Key Market Trends
- Future Market Projections
- Premium Market Insights
- Industry Developments and Key Market Events
- PMR Analysis and Recommendations
- Market Overview
- Market Scope and Definition
- Market Dynamics
- Drivers
- Restraints
- Opportunity
- Challenges
- Key Trends
- Product Lifecycle Analysis
- Global Parent Market Overview
- Agrochemicals Market: Value Chain
- List of Raw Crop Type Supplier
- List of Manufacturers
- List of Distributors
- List of End Use Industries
- Profitability Analysis
- Forecast Factors - Relevance and Impact
- Covid-19 Impact Assessment
- PESTLE Analysis
- Porter Five Force’s Analysis
- Geopolitical Tensions: Market Impact
- Regulatory and Crop Type Landscape
- Macro-Economic Factors
- Global Sectorial Outlook
- Global GDP Growth Outlook
- Other Macro-economic Factors
- Price Trend Analysis, 2020 - 2033
- Key Highlights
- Key Factors Impacting Product Prices
- Prices By Product Type/Crop Type/Application
- Regional Prices and Product Preferences
- Global Agrochemicals Market Outlook: Historical (2020 - 2025) and Forecast (2026 - 2033)
- Key Highlights
- Market Size and Y-o-Y Growth
- Absolute $ Opportunity
- Market Size And Volume (Tons) Analysis and Forecast
- Historical Market Size Analysis, 2020-2025
- Current Market Size Forecast, 2026-2033
- Global Agrochemicals Market Outlook: Product Type
- Introduction / Key Findings
- Historical Market Size And Volume (Tons) Analysis By Product Type, 2020 - 2025
- Current Market Size And Volume (Tons)Forecast By Product Type, 2026 - 2033
- Fertilizers
- Nitrogen Based
- Potassium Based
- Phosphorous Based
- Others
- Pesticides
- Insecticides
- Fungicides
- Herbicides
- Bactericides
- Others
- Others (Soil Conditioners, acidifying agents, etc.)
- Fertilizers
- Market Attractiveness Analysis: Product Type
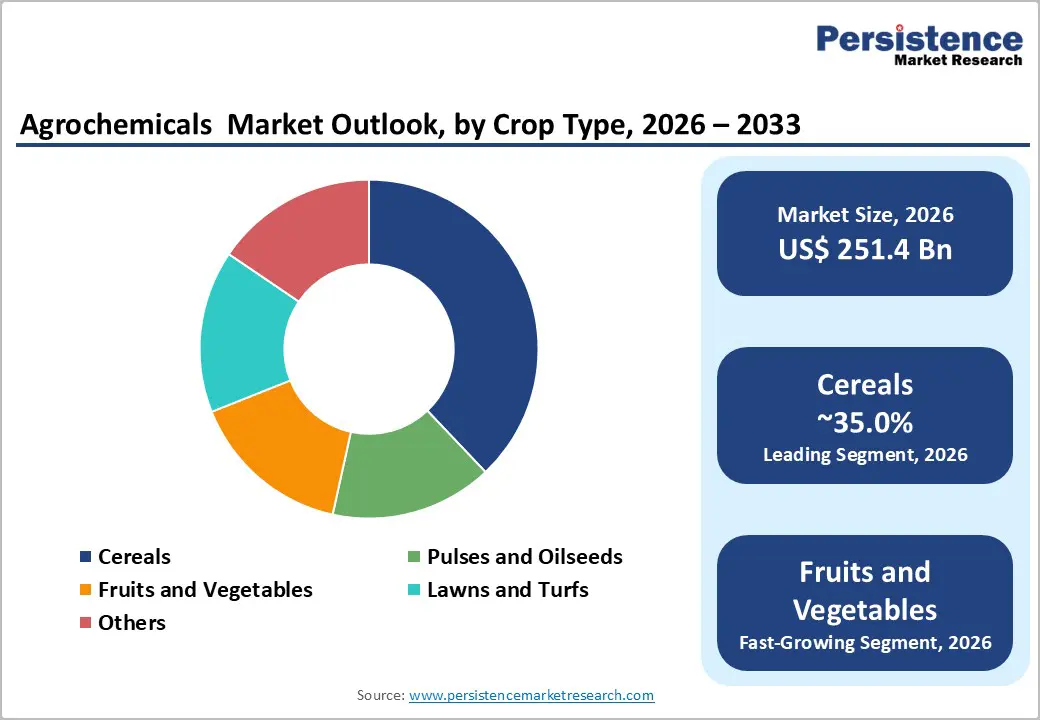
- Global Agrochemicals Market Outlook: Crop Type
- Introduction / Key Findings
- Historical Market Size And Volume (Tons) Analysis By Crop Type, 2020 - 2025
- Current Market Size And Volume (Tons)Forecast By Crop Type, 2026 - 2033
- Cereals
- Pulses and Oilseeds
- Fruits and Vegetables
- Lawns and Turfs
- Others
- Market Attractiveness Analysis: Crop Type
- Global Agrochemicals Market Outlook Application
- Introduction / Key Findings
- Historical Market Size And Volume (Tons) Analysis By Application, 2020 - 2025
- Current Market Size And Volume (Tons)Forecast By Application, 2026 - 2033
- Crop Protection
- Foliar Spray
- Soil Treatment
- Seed Treatment
- Crop Nutrition
- Crop Protection
- Market Attractiveness Analysis: Application
- Key Highlights
- Global Agrochemicals Market Outlook Region
- Key Highlights
- Historical Market Size And Volume (Tons) Analysis By Region, 2020 - 2025
- Current Market Size And Volume (Tons)Forecast By Region, 2026 - 2033
- North America
- Europe
- East Asia
- South Asia and Oceania
- Latin America
- Middle East & Africa
- Market Attractiveness Analysis: Region
- North America Agrochemicals Market Outlook: Historical (2020 - 2025) and Forecast (2026 - 2033)
- Key Highlights
- Pricing Analysis
- Historical Market Size And Volume (Tons) Analysis By Market, 2020 - 2025
- By Country
- By Product Type
- By Crop Type
- By Application
- Current Market Size And Volume (Tons)Forecast By Country, 2026 - 2033
- U.S.
- Canada
- Current Market Size And Volume (Tons)Forecast By Product Type, 2026 - 2033
- Fertilizers
- Nitrogen Based
- Potassium Based
- Phosphorous Based
- Others
- Pesticides
- Insecticides
- Fungicides
- Herbicides
- Bactericides
- Others
- Others (Soil Conditioners, acidifying agents, etc.)
- Fertilizers
- Current Market Size And Volume (Tons)Forecast By Crop Type, 2026 - 2033
- Cereals
- Pulses and Oilseeds
- Fruits and Vegetables
- Lawns and Turfs
- Others
- Current Market Size And Volume (Tons)Forecast By Application, 2026 - 2033
- Crop Protection
- Foliar Spray
- Soil Treatment
- Seed Treatment
- Crop Nutrition
- Crop Protection
- Market Attractiveness Analysis
- Europe Agrochemicals Market Outlook: Historical (2020 - 2025) and Forecast (2026 - 2033)
- Key Highlights
- Pricing Analysis
- Historical Market Size And Volume (Tons) Analysis By Market, 2020 - 2025
- By Country
- By Product Type
- By Crop Type
- By Application
- By Current Market Size And Volume (Tons)Forecast By Country, 2026 - 2033
- Germany
- Italy
- France
- U.K.
- Spain
- Russia
- Türkiye
- Rest of Europe
- Current Market Size And Volume (Tons)Forecast By Product Type, 2026 - 2033
- Fertilizers
- Nitrogen Based
- Potassium Based
- Phosphorous Based
- Others
- Pesticides
- Insecticides
- Fungicides
- Herbicides
- Bactericides
- Others
- Others (Soil Conditioners, acidifying agents, etc.)
- Fertilizers
- Current Market Size And Volume (Tons)Forecast By Crop Type, 2026 - 2033
- Cereals
- Pulses and Oilseeds
- Fruits and Vegetables
- Lawns and Turfs
- Others
- Current Market Size And Volume (Tons)Forecast By Application, 2026 - 2033
- Crop Protection
- Foliar Spray
- Soil Treatment
- Seed Treatment
- Crop Nutrition
- Crop Protection
- Market Attractiveness Analysis
- East Asia Agrochemicals Market Outlook: Historical (2020 - 2025) and Forecast (2026 - 2033)
- Key Highlights
- Pricing Analysis
- Historical Market Size And Volume (Tons) Analysis By Market, 2020 - 2025
- By Country
- By Product Type
- By Crop Type
- By Application
- Current Market Size And Volume (Tons)Forecast By Country, 2026 - 2033
- China
- Japan
- South Korea
- Current Market Size And Volume (Tons)Forecast By Product Type, 2026 - 2033
- Fertilizers
- Nitrogen Based
- Potassium Based
- Phosphorous Based
- Others
- Pesticides
- Insecticides
- Fungicides
- Herbicides
- Bactericides
- Others
- Others (Soil Conditioners, acidifying agents, etc.)
- Fertilizers
- Current Market Size And Volume (Tons)Forecast By Crop Type, 2026 - 2033
- Cereals
- Pulses and Oilseeds
- Fruits and Vegetables
- Lawns and Turfs
- Others
- Current Market Size And Volume (Tons)Forecast By Application, 2026 - 2033
- Crop Protection
- Foliar Spray
- Soil Treatment
- Seed Treatment
- Crop Nutrition
- Crop Protection
- Market Attractiveness Analysis
- South Asia & Oceania Agrochemicals Market Outlook: Historical (2020 - 2025) and Forecast (2026 - 2033)
- Key Highlights
- Pricing Analysis
- Historical Market Size And Volume (Tons) Analysis By Market, 2020 - 2025
- By Country
- By Product Type
- By Crop Type
- By Application
- Current Market Size And Volume (Tons)Forecast By Country, 2026 - 2033
- India
- Southeast Asia
- ANZ
- Rest of South Asia & Oceania
- Current Market Size And Volume (Tons)Forecast By Product Type, 2026 - 2033
- Fertilizers
- Nitrogen Based
- Potassium Based
- Phosphorous Based
- Others
- Pesticides
- Insecticides
- Fungicides
- Herbicides
- Bactericides
- Others
- Others (Soil Conditioners, acidifying agents, etc.)
- Fertilizers
- Current Market Size And Volume (Tons)Forecast By Crop Type, 2026 - 2033
- Cereals
- Pulses and Oilseeds
- Fruits and Vegetables
- Lawns and Turfs
- Others
- Current Market Size And Volume (Tons)Forecast By Application, 2026 - 2033
- Crop Protection
- Foliar Spray
- Soil Treatment
- Seed Treatment
- Crop Nutrition
- Crop Protection
- Market Attractiveness Analysis
- Latin America Agrochemicals Market Outlook: Historical (2020 - 2025) and Forecast (2026 - 2033)
- Key Highlights
- Pricing Analysis
- Historical Market Size And Volume (Tons) Analysis By Market, 2020 - 2025
- By Country
- By Product Type
- By Crop Type
- By Application
- Current Market Size And Volume (Tons)Forecast By Country, 2026 - 2033
- Brazil
- Mexico
- Rest of Latin America
- Current Market Size And Volume (Tons)Forecast By Product Type, 2026 - 2033
- Fertilizers
- Nitrogen Based
- Potassium Based
- Phosphorous Based
- Others
- Pesticides
- Insecticides
- Fungicides
- Herbicides
- Bactericides
- Others
- Others (Soil Conditioners, acidifying agents, etc.)
- Fertilizers
- Current Market Size And Volume (Tons)Forecast By Crop Type, 2026 - 2033
- Cereals
- Pulses and Oilseeds
- Fruits and Vegetables
- Lawns and Turfs
- Others
- Current Market Size And Volume (Tons)Forecast By Application, 2026 - 2033
- Crop Protection
- Foliar Spray
- Soil Treatment
- Seed Treatment
- Crop Nutrition
- Crop Protection
- Market Attractiveness Analysis
- Middle East & Africa Agrochemicals Market Outlook: Historical (2020 - 2025) and Forecast (2026 - 2033)
- Key Highlights
- Pricing Analysis
- Historical Market Size And Volume (Tons) Analysis By Market, 2020 - 2025
- By Country
- By Product Type
- By Crop Type
- By Application
- Current Market Size And Volume (Tons)Forecast By Country, 2026 - 2033
- GCC Countries
- South Africa
- Northern Africa
- Rest of MEA
- Current Market Size And Volume (Tons)Forecast By Product Type, 2026 - 2033
- Fertilizers
- Nitrogen Based
- Potassium Based
- Phosphorous Based
- Others
- Pesticides
- Insecticides
- Fungicides
- Herbicides
- Bactericides
- Others
- Others (Soil Conditioners, acidifying agents, etc.)
- Fertilizers
- Current Market Size And Volume (Tons)Forecast By Crop Type, 2026 - 2033
- Cereals
- Pulses and Oilseeds
- Fruits and Vegetables
- Lawns and Turfs
- Others
- Current Market Size And Volume (Tons)Forecast By Application, 2026 - 2033
- Crop Protection
- Foliar Spray
- Soil Treatment
- Seed Treatment
- Crop Nutrition
- Crop Protection
- Market Attractiveness Analysis
- Competition Landscape
- Market Share Analysis, 2025
- Market Structure
- Competition Intensity Mapping By Market
- Competition Dashboard
- Apparent Production Capacity
- Company Profiles (Details - Overview, Financials, Strategy, Recent Developments)
- Bayer AG
- Overview
- Segments and Products
- Key Financials
- Market Developments
- Market Strategy
- YARA International ASA
- BASF SE
- Israel Chemicals Ltd.
- Nutrien Ltd.
- FMC Corporation
- The Mosaic Company
- Fengro Industries Corp.
- PhosAgro
- DowDuPont Inc.
- OCI N.V.
- Fertilizantes Heringer S.A.
- WinHarvest Pty Ltd
- Syngenta AG
- K+S KALI GmbH
- Saudi Arabia Fertilizer Company (SAFCO)
- Jordan Abyad Fertilizers and Chemicals Company
- UPL Limited
- Coromandel International
- Bayer AG
- Appendix
- Research Methodology
- Research Assumptions
- Acronyms and Abbreviations

Loading page data
Please wait a moment


