


- Specialty & Fine Chemicals
- North America Antifreeze and Coolants Market
North America Antifreeze and Coolants Market
North America Market Study on Antifreeze and Coolants: Automotive Industry Creating Ample Opportunities for Market Expansion
Market Overview
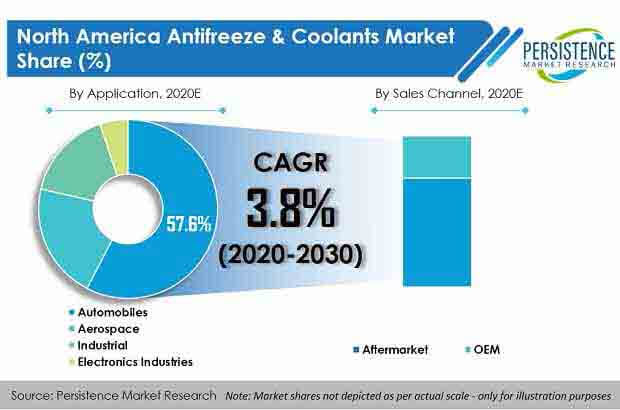
Myriad of applications in end-use industries and technological advancements will forge ahead the demand for antifreeze and coolants across North America. Rapid developments in the automotive industry owing growth in vehicle numbers, emerging economies, and increased per capita income have demanded advanced versions of antifreeze and coolants on a large scale, and have encouraged their use via pricing policies and information campaigns. This will proliferate the procurement rate of antifreeze/coolants, thereby aiding the expansion of the North America antifreeze and coolants market size through 2030.
Increasing Per Capita Spending on Car Care Services Significantly Benefitting Market Growth
Growth in per capita disposable income of consumers has inclined them toward using automotive and maintenance services more often. Moreover, winter maintenance in cold regions has added to per capita spending and increased awareness among consumers to focus on automotive services and repairs. This is expected to surge demand for antifreeze and coolants in the aftermarket, given the rise in individualized transportation.
Automotive maintenance and service providers are focused on providing automotive lubricants along with antifreeze and coolant services to generate more revenue, which, in turn, is expected to have a positive impact on the growth of the North America antifreeze and coolants aftermarket.
Robust Industrial Growth Offering New Growth Avenues for North America Antifreeze and Coolants Market
With a progressing industrial sector, including manufacturing, mining, construction, utilities, and oil & gas, demand for engine coolants is expected to rise during the forecast period. As such, many companies are entering the market with the hope of capitalizing on the surging demand to expand their geographical footprints.
With growing infrastructure investments, demand for construction-based machines will rise further, which is anticipated to boost sales in the North America antifreeze and coolants market. For this, companies are focusing on developing products that comply with respective safety norms across the world. With effective research, development, and innovation, global manufacturers can find opportunities to capture unexploited markets and increase their market share.
Signing Long-term Agreements - A Trend Benefitting Market Players
Many antifreeze and coolants manufactures are entering into tie-ups with OEMs for coolant fills and refills in factories (factory fill) and authorized service centers, besides branding partnerships that result in genuine (GO) and co-branded coolants. While OEM tie ups are a low margin business due to royalty and margin sharing, these are necessary for the goodwill of manufactures in the aftermarket, as consumers seek reassurance on product quality and image.
Moreover, distributors in the local market are also emphasizing on signing long-term contracts with local centers and service centers to make their products popular. Service providers such as service stations and automotive care centers are signing long-term agreements with vehicle owners by offering complete packages for car maintenance. Many customers prefer packaged deals from such stations.
Joint Ventures, Acquisitions, and Collaborations Key Strategies Followed by Leading Players
The North America antifreeze and coolants market is a fragmented market, and several players are limited to their countries and territories for product sales. However, mergers, acquisitions of contracts, and collaborations are some of the key strategies followed by market players to penetrate the North America antifreeze and coolants market and increase their presence.
To meet high volume requirements, currently hampered by high material costs, long production cycles and lack of automation, as well as to meet emission regulations, tier-1 suppliers and car manufactures have adopted different strategies to allow vertical integration in the value chain.
Manufacturers’ Focus: Expansion of Antifreeze and Coolant Production
Over the past few years, ongoing developments at the supply side have given rise to diverse antifreeze/coolant products that cater to different consumer demands. Developments in end-use industries necessitate the need for specific coolant requirements, which can be used for all engine models, available in flexible packaging options, protect metal surfaces from corrosion, and work in stringent temperatures.
This has given rise to a lot of competition in products, regional expansions, and providing different services. These factors provide an opportunity for the North America antifreeze and coolants market to grow steadily in the future.
North America Antifreeze and Coolants Market: Competition Overview
The North America antifreeze and coolants market is stipulated to be moderately consolidated, with a handful of tier-1 players occupying around one-third market share. Some of the active and leading participants holding a noteworthy North America antifreeze and coolants market share include Old World Industries, BASF, Exxon Mobil, Valvoline, Total S.A. and Chevron, amongst others.
COVID-19 Impact on North America Antifreeze and Coolants Market
The automotive industry is one of the heavily impacted industries by the coronavirus pandemic, and has witnessed disruptions in supply as well as demand patterns. Interruptions in raw material supply and shutting down of production facilities have impacted the market. Automotive sales in the U.S. are forecast to decrease by 15-20% in 2020. This is anticipated to directly impact OEM sales of antifreeze and coolants in the region.
Halt in international travel as well as manufacturing activities are anticipated to further decrease demand from the aerospace, electronics, and industrial segments. However, as the situation gradually gets back to normal, post pandemic, the North America antifreeze and coolants market is anticipated to witness significant recovery from aftermarket as well as OEM sales.
Analysts’ Viewpoint
Growth of the North America antifreeze and coolants market is primarily driven by increased necessity toward thermal management and performance improvement in end applications. The industry has witnessed a sizable surge over the past couple of years, and the procurement rate is expected to remain healthy throughout the projected period, owing to various supporting factors.
Companies Covered in North America Antifreeze and Coolants Market
- BASF SE
- Cummins Inc.
- Exxon Mobil Corporation
- CCI MANUFACTURING MEXICO, S.A. DE C.
- Royal Dutch Shell
- Valvoline Inc
- Chevron Corporation
- Prestone Products Corporation.
- OLD WORLD INDUSTRIES, LLC ( Peak Brand)
- Total SA
- Lubricantes De America S.A. DE C.V
- Quaker State
- Roshfrans S.A. DE C.V.
- Bardahl Manufacturing Corporation
- Conoco Phillips Company
- BP Plc


