


- Industrial Machinery
- Glycol Dehydration Unit Market
Glycol Dehydration Unit Market Size, Share, and Growth Forecast, 2025 - 2032
Glycol Dehydration Unit Market by Product Type (Triethylene Glycol (TEG) Dehydration Units, Diethylene Glycol (DEG) Dehydration Units, Ethylene Glycol (EG) Dehydration Units, and Other Glycols), by Capacity (1-60 MSCFD, 60-100 MSCFD, 100-450 MSCFD, and Above 450 MSCFD) By End-use and Regional Analysis for 2025 - 2032
Glycol Dehydration Unit Market Size and Trends Analysis
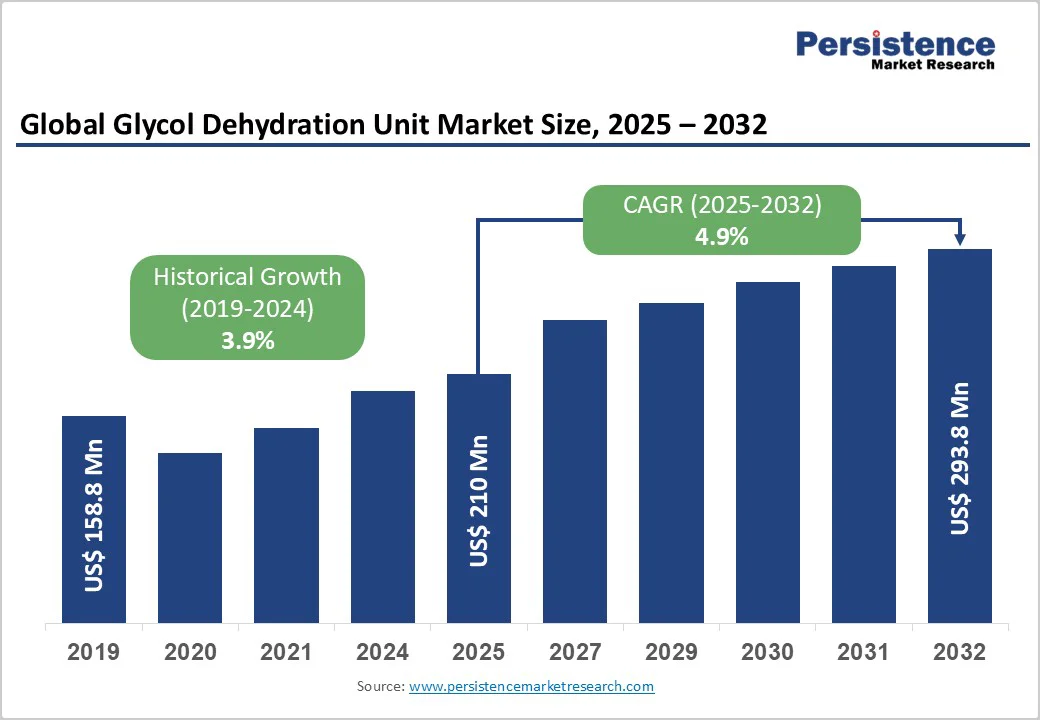
The global glycol dehydration unit market size is likely to value US$ 210 million in 2025 and is projected to reach US$ 293.7 million by 2032, growing at a CAGR of 4.9% between 2025 and 2032.
The growth reflects the increasing demand for natural gas processing technologies driven by global energy transition initiatives and expanding natural gas infrastructure development across emerging economies.
The industry benefits from growing investments in upstream oil and gas exploration activities, particularly in unconventional gas reserves, including shale gas formations, which require sophisticated dehydration technologies to meet pipeline quality specifications.
Key Industry Highlights:
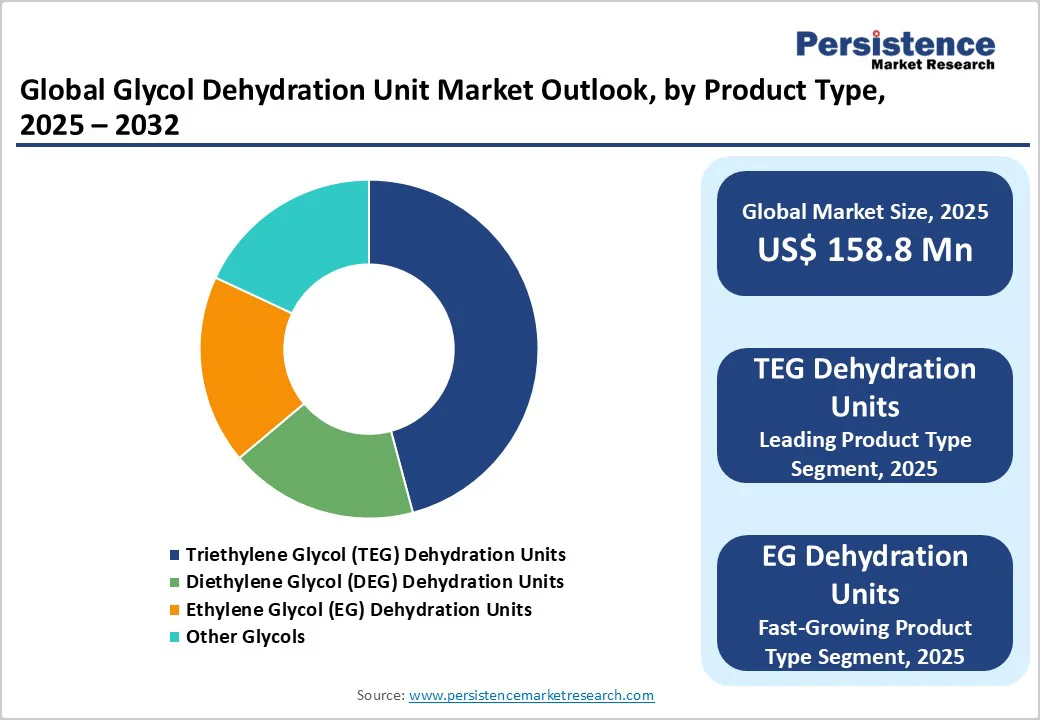
- Product Leadership: Triethylene Glycol (TEG) units dominate with 52% market share due to superior water absorption and cost-effectiveness, while Ethylene Glycol (EG) units show the fastest growth at 4.7% CAGR for specialized applications.
- Capacity Preference: 60-100 MSCFD capacity range leads with 45% market share, balancing processing capability with capital efficiency, while the 100-450 MSCFD segment demonstrates the fastest growth for large-scale operations.
- Application Dominance: Oil & Gas Production accounts for 65% of demand across upstream and midstream operations, with the Petrochemical Industry emerging as the fastest-growing end-use segment driven by integrated gas-to-chemicals projects.
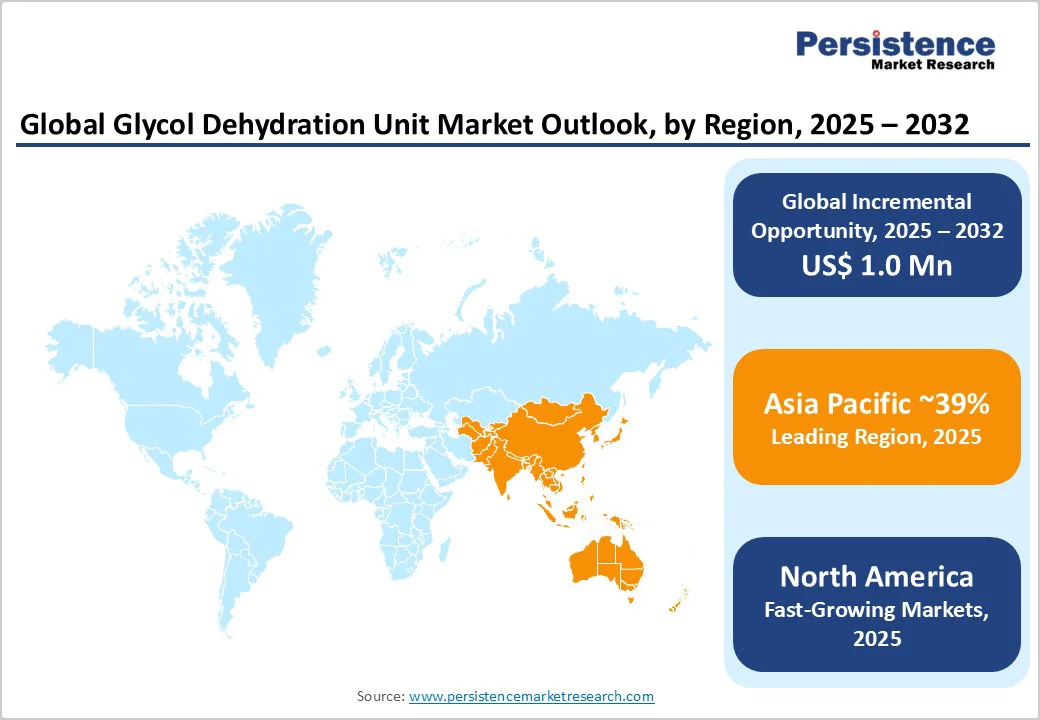
- Regional Leadership: Asia Pacific dominates with 39% market share and 6.2% CAGR growth led by China and India infrastructure expansion, while North America shows the fastest regional growth at 5.8% CAGR from shale gas and LNG export development.
- Market Consolidation: Top 5 providers hold significant market concentration, enabling pricing stability and continued R&D investment, with strategic acquisitions and partnerships driving technology advancement and geographic expansion.
- Technology Innovation: Industry shift toward digital integration and AI-driven optimization creates premium market opportunities, while modular standardized solutions address cost-sensitive segments and emerging market requirements.
- Stringent Quality Standards: Pipeline and LNG operations enforce water content limits between 4-7 lb/MMSCF and below 1 ppmv, respectively, spurring advanced GDU adoption.
| Key Insights | Details |
|---|---|
| Glycol Dehydration Unit Market Size (2025E) | US$ 210 Mn |
| Market Value Forecast (2032F) | US$ 293.7 Mn |
| Projected Growth (CAGR 2025 to 2032) | 4.9% |
| Historical Market Growth (CAGR 2019 to 2024) | 3.9% |
Market Dynamics
Driver - Accelerating Natural Gas Demand and Infrastructure Development
The rapid increase in global natural gas consumption stands as a key driver for the Glycol Dehydration Unit (GDU) Market. Natural gas is increasingly recognized as a critical transitional fuel in global decarbonization strategies, prompting governments and energy developers to expand gas-based infrastructure to reduce reliance on coal and other high-emission sources. This transition directly boosts the need for efficient dehydration systems essential for gas processing and transportation.
According to the Energy Institute Statistical Review of World Energy™ 2025, global natural gas consumption rose from 4,015.1 billion cubic meters in 2023 to 4,127.8 billion cubic meters in 2024, marking growth well above the long-term average of 2% recorded between 2010 and 2020. The International Energy Agency (IEA) projects further consumption gains in 2025, supported by rising demand from power generation, industrial operations, and residential sectors.
As over 60% of energy developers’ investment plans are now directed toward natural gas projects, the requirement for glycol dehydration units is vital for removing water vapor to prevent pipeline corrosion and hydrate formation, growing rapidly across upstream, midstream, and downstream operations.
Stringent Pipeline and LNG Quality Standards Coupled with Technological Advancements in Dehydration Efficiency
The implementation of strict regulatory standards governing gas quality and moisture content is a major growth driver for the Glycol Dehydration Unit (GDU) Market. Pipeline transportation regulations typically mandate water content levels between 4-7 lb/MMSCF, while LNG processing facilities require even tighter specifications, often below 1 ppmv to prevent ice or hydrate formation during the liquefaction process. This regulatory rigor, along with the steady expansion of global LNG export capacity, continues to propel the adoption of high-performance glycol dehydration systems across key gas-producing regions.
To meet these demanding standards, modern GDUs are integrating cutting-edge automation, digital monitoring tools, and predictive maintenance technologies, collectively reducing operational costs by up to 25% and enhancing process reliability.
Furthermore, innovations such as pressure-assisted stripping and optimized triethylene glycol (TEG) regeneration systems have significantly improved dehydration efficiency while minimizing energy consumption. These advancements are particularly beneficial for remote and offshore installations, where enhanced reliability, compact design, and operational efficiency are essential to maintaining continuous and cost-effective production.
Restraint - High Capital Investment, Infrastructure Costs, and Skilled Personnel Requirements
The Glycol Dehydration Unit (GDU) Market faces significant challenges stemming from high capital investment needs, operational complexity, and skilled labor shortages. Glycol dehydration processes require specialized technical expertise for system optimization, glycol regeneration, and adherence to stringent environmental regulations governing glycol losses and emissions. However, the limited availability of trained personnel—particularly in developing regions creates operational inefficiencies, increases the risk of non-compliance, and elevates long-term maintenance costs.
Initial capital investment for setting up a complete glycol dehydration system typically ranges between US$ 1.2 million and US$ 2.8 million for mid-scale facilities, posing substantial entry barriers for small operators and emerging market participants. The installation process is highly complex, demanding advanced engineering, extended commissioning timelines, and continuous maintenance programs. These factors collectively place considerable strain on project budgets and delay return on investment.
Furthermore, fluctuating natural gas prices often disrupt investment confidence, leading to deferred or cancelled dehydration projects during market downturns. Supply chain disruptions further aggravate cost pressures, affecting the availability and pricing of essential components and materials required for dehydration unit manufacturing and assembly. Collectively, these financial and operational constraints hinder widespread adoption and slow market expansion.
Opportunities - Integration with Carbon Capture and Digital Technologies
The convergence of glycol dehydration systems with carbon capture, utilization, and storage (CCUS) projects creates new market segments, particularly in industrial gas processing applications. Digital transformation initiatives incorporating IoT sensors, real-time monitoring, and AI-driven optimization algorithms enable operators to maximize dehydration efficiency while reducing environmental impact. These integrated solutions command premium pricing and offer differentiated value propositions for environmentally conscious operators seeking comprehensive gas processing solutions.
Modular and Standardized System Solutions
Increasing demand for rapid deployment and scalable dehydration systems drives opportunities for modular, pre-engineered units that reduce installation time and costs. Standardized designs enable manufacturers to achieve economies of scale while providing customers with predictable performance and faster project execution. This trend particularly benefits smaller operators and remote applications where traditional custom-engineered solutions are economically challenging.
Category-wise Analysis
Product Type Insights - Dominance of TEG Dehydration Units and Rapid Growth of EG Systems
Triethylene Glycol (TEG) dehydration units dominate the global market with over 52% revenue share in 2025. Their leadership stems from TEG’s exceptional water absorption efficiency, strong thermal stability, and cost-effective regeneration properties compared to alternative glycols.
Capable of achieving water content levels of 3-7 lb/MMSCF, TEG units are ideal for pipeline transportation and LNG processing. They deliver over 99.5% regeneration efficiency, reduced vapor losses, and lower operating costs, supporting their widespread adoption across major gas processing facilities.
TEG systems also benefit from proven performance, extensive industry experience, and reliable supply chains, making them the preferred choice for large-scale, continuous operations.
Conversely, Ethylene Glycol (EG) dehydration units represent the fastest-growing market segment, expanding at a CAGR of about 4.7% n in 2025. EG units are increasingly used in refrigeration systems, offshore platforms, and remote production facilities, where operational simplicity, low maintenance, and automation are key advantages.
Their ability to selectively remove water vapor without affecting other gas components makes them valuable for specialized gas processing applications, driving their rapid adoption in emerging and complex operational environments.
Capacity Insights - 60-100 MSCFD Capacity Segment Market Leader with 100-450 MSCFD Emerging as Fastest Growing
The 60-100 MSCFD capacity range dominates the Glycol Dehydration Unit market, accounting for over 45% of total revenue. This segment strikes the ideal balance between processing capability and capital efficiency, catering to mid-scale gas processing operations such as regional plants, gathering stations, and medium-sized production facilities.
Its widespread adoption is supported by standardized equipment designs, enabling cost-effective manufacturing, operational flexibility, and reliable performance under fluctuating gas flow conditions. The segment’s leadership reflects the strong presence of mid-scale infrastructure across major gas-producing regions, reinforced by established supply chains and service networks.
Meanwhile, the 100-450 MSCFD capacity range represents the fastest-growing segment, propelled by rising demand from large-scale processing plants, LNG export terminals, and integrated oil and gas facilities. Growth is further supported by industry consolidation trends emphasizing operational efficiency, economies of scale, and advanced automation technologies that enhance monitoring, reliability, and performance in high-capacity gas dehydration applications.
End-use Insights
Oil & Gas Production Leads Market Demand While Petrochemical Industry Emerges as Fastest-Growing Segment
The oil and gas production sector remains the dominant end-use segment for glycol dehydration units, accounting for over 65% of total demand. Gas dehydration is critical for wellhead processing, gathering systems, and pipeline transmission, including conventional and unconventional operations such as shale gas production.
According to the Energy Institute Statistical Review of World Energy™ 2025, global natural gas consumption rose from 4,015.1 billion cubic meters in 2023 to 4,127.8 billion cubic meters in 2024, significantly above the long-term average growth of 2% recorded between 2010 and 2020. The International Energy Agency (IEA) projects further increases in 2025, driven by rising demand from power generation, industrial operations, and residential sectors.
Additionally, global liquid fuels consumption is also expanding. According to the EIA, consumption is expected to increase by 1.1 million b/d in both 2025 and 2026, driven almost entirely by non-OECD countries, which grow by 1.2 million b/d in 2025 and 1.0 million b/d in 2026, while OECD consumption remains relatively flat. Most growth is concentrated in Asia, with India and China together adding more than 0.4 million b/d by 2026 compared to 2024.
The petrochemical industry is the fastest-growing end-use segment, fueled by expanding chemical processing capacity and rising demand for high-purity feedstock. Precise moisture control is essential to maintain product quality and prevent equipment corrosion, creating demand for specialized dehydration systems.
Growth is particularly strong in the Asia Pacific and the Middle East, where integrated refining and petrochemical complexes are under development. Increasing integration of natural gas processing with petrochemical operations, including gas-to-chemicals projects, further drives the need for high-performance glycol dehydration units.
Regional Insights and Trends
Asia Pacific Dominates the Glycol Dehydration Unit Market
Asia Pacific accounts for a leading position in the global glycol dehydration unit market, accounting for 39% of total market share and leading regional growth with a 6.2% CAGR. This growth is driven by rapid industrialization and expanding natural gas infrastructure across China, India, Japan, and Southeast Asian nations, supported by government initiatives promoting natural gas adoption to improve air quality and enhance energy security.
China leads regional demand, with natural gas consumption rising from 404.8 billion cubic meters in 2023 to 434.4 billion cubic meters in 2024, representing a 7% year-on-year increase and 10.5% of global consumption. Massive pipeline network expansion and growing LNG import capacity support industrial growth and the shift from coal to natural gas for residential heating and power generation.
India’s natural gas consumption is projected at 71,314 MMSCM (Million Standard Cubic Metres) in 2024-2025, according to the Petroleum Planning & Analysis Cell, Ministry of Petroleum & Natural Gas, Government of India, creating substantial demand for gas processing infrastructure, including glycol dehydration systems.
Japan shows a slight decline from 91.6 billion cubic meters in 2023 to 90.9 billion cubic meters in 2024, representing 2.2% of global consumption, while advanced LNG import and regasification facilities in Japan and South Korea drive demand for high-specification dehydration technologies.
The region also attracts international equipment suppliers due to manufacturing advantages and local production capabilities, enabling cost-effective solutions while meeting diverse regulatory and technical standards. The shift from oil and coal to natural gas, particularly for electricity generation, further reinforces market growth in Asia Pacific.
North America Emerges as a Key Growth Hub in the Glycol Dehydration Unit Market
North America maintains a significant market position in the glycol dehydration unit market, accounting for 28% of global market share and demonstrating the fastest regional growth at approximately 5.8% CAGR through 2032. The region’s market is fueled by extensive shale gas development and growing LNG export capacity.
The United States accounts for the majority of North American gas demand, underpinned by robust production from the Permian Basin, Marcellus Shale, and other unconventional formations that rely on advanced gas processing infrastructure. Canada also supports regional growth through consistent upstream gas production.
According to the Energy Institute Statistical Review of World Energy™ 2025, North American natural gas consumption rose from 888.4 billion cubic meters in 2023 to 902.2 billion cubic meters in 2024, a 1.3% increase, representing 21.9% of global consumption. Canada’s consumption grew from 124.1 to 128.5 billion cubic meters, a 3.3% increase, accounting for 3.1% of global consumption.
In parallel, U.S. crude oil production increased by 270,000 barrels per day in 2024 to average 13.2 million b/d, with almost all growth coming from the Permian region (Petroleum Supply Monthly). These trends align with the EIA projection of global liquid fuels consumption rising by 1.1 million b/d, largely driven by non-OECD demand.
Key growth drivers include LNG terminal expansions along the Gulf Coast, regulatory emphasis on environmental compliance, and adoption of smart dehydration systems with predictive maintenance and remote monitoring. Strategic partnerships between equipment manufacturers and operators continue to advance technology innovation and market penetration across North America’s diverse gas processing landscape.
Competitive Landscape
The global glycol dehydration unit market is highly consolidated, with the top five players holding significant shares due to the technical complexity and capital-intensive nature of gas processing equipment. Leading companies leverage economies of scale, extensive service networks, and strong customer relationships to maintain competitive advantages, with individual market shares ranging from 8-15%.
Strategic initiatives such as Schlumberger’s US$45 million AI-driven digital dehydration systems and Exterran’s US$125 million European asset acquisition highlight the focus on technology innovation, portfolio expansion, and market consolidation. Competitive success depends on advanced technology, global presence, and robust service capabilities.
Key Industry Developments:
- In 2024, Schlumberger Limited partnered with major LNG developers to deploy next-generation digital dehydration systems incorporating AI-driven optimization algorithms, representing a US$ 45 million strategic investments in technology advancement.
- In August 2024, Exterran Corporation completed its acquisition of specialized dehydration technology assets from a European competitor, expanding its product portfolio and European market presence through a US$125 million transaction.
- In 2022, Glycol Dehydration Unitster rolled out seekh Glycol Dehydration Unit grill models designed to increase productivity (up to 800 Glycol Dehydration Units per hour) and improve food hygiene for restaurants and industrial kitchens, marking a notable innovation in high-volume Glycol Dehydration Unit production.
Companies Covered in Glycol Dehydration Unit Market
- Honeywell UOP LLC,
- GasTech Engineering Corporation,
- Schlumberger Limited, and
- Forum Energy Technologies.
- Exterran Corporation
- Schlumberger Limited
- Enerflex Ltd.
- Pietro Fiorentinnin S.p.a.
- QB Johnson Manufacturing, Inc.
- Frames Group
- Axens
- KW International
- Propak Systems Ltd.
- Alco Group
- Croft Production Systems, Inc.
- Nihon Seiki Co. Ltd.
- ALLIA France
- Other Market Players
Frequently Asked Questions
The Glycol Dehydration Unit market is estimated to be valued at US$ 210 Mn in 2025.
The key demand driver for the Glycol Dehydration Unit (GDU) market is the accelerating global demand for natural gas and the associated expansion of gas processing and transportation infrastructure.
In 2025, the Asia Pacific region will dominate the market with an exceeding 39% revenue share in the global Glycol Dehydration Unit market.
Among product types, Triethylene Glycol (TEG) Dehydration Units holds the highest preference, capturing beyond 52% of the market revenue share in 2025, surpassing other product types.
The Glycol Dehydration Unit (GDU) market is characterized by the presence of several prominent players that drive technological innovation and global competitiveness. Leading companies include Honeywell UOP LLC, GasTech Engineering Corporation, Schlumberger Limited, Forum Energy Technologies, Exterran Corporation, Enerflex Ltd., and Pietro Fiorentini S.p.A.


