

- Executive Summary
- Global Tampon Market Snapshot, 2025 and 2032
- Market Opportunity Assessment, 2025 - 2032, US$ Bn
- Key Market Trends
- Future Market Projections
- Premium Market Insights
- Industry Developments and Key Market Events
- PMR Analysis and Recommendations
- Market Overview
- Market Scope and Definition
- Market Dynamics
- Drivers
- Restraints
- Opportunity
- Key Trends
- Macro-economic Factors
- Penetration of E-commerce in Personal Care Products
- Rising Female Workforce Participation
- COVID-19 Impact Analysis
- Forecast Factors - Relevance and Impact
- Value Added Insights
- Product Type Demand Analysis
- Regulatory Landscape
- Value Chain Analysis
- PESTLE Analysis
- Porter’s Five Force Analysis
- Global Tampon Market Outlook
- Key Highlights
- Market Volume (Units) Projections
- Market Size (US$ Bn) and Y-o-Y Growth
- Absolute $ Opportunity
- Market Size (US$ Bn) and Volume (Units) Analysis and Forecast
- Historical Market Size (US$ Bn) Analysis, 2019-2024
- Market Size (US$ Bn) Analysis and Forecast, 2025 - 2032
- Global Tampon Market Outlook: Product Type
- Introduction / Key Findings
- Historical Market Size (US$ Bn) and Volume (Units) Analysis, By Product Type, 2019 - 2024
- Market Size (US$ Bn) and Volume (Units) Analysis and Forecast, By Product Type, 2025 - 2032
- Radially Wound Pledget
- Rectangular/Square Pad
- Market Attractiveness Analysis: Product Type
- Global Tampon Market Outlook: Material
- Introduction / Key Findings
- Historical Market Size (US$ Bn) Analysis, By Material, 2019 - 2024
- Market Size (US$ Bn) Analysis and Forecast, By Material, 2025 - 2032
- Cotton
- Rayon
- Blended
- Others
- Market Attractiveness Analysis: Material
- Global Tampon Market Outlook: Price Range
- Introduction / Key Findings
- Historical Market Size (US$ Bn) Analysis, By Price Range, 2019 - 2024
- Market Size (US$ Bn) Analysis and Forecast, By Price Range, 2025 - 2032
- Economy
- Mid-range
- Premium
- Market Attractiveness Analysis: Price Range
- Global Tampon Market Outlook: Distribution Channel
- Introduction / Key Findings
- Historical Market Size (US$ Bn) Analysis, By Distribution Channel, 2019 - 2024
- Market Size (US$ Bn) Analysis and Forecast, By Distribution Channel, 2025 - 2032
- Supermarkets/Hypermarkets
- Specialty Stores
- Pharmacy Stores
- Online Retail
- Market Attractiveness Analysis: Distribution Channel
- Key Highlights
- Global Tampon Market Outlook: Region
- Key Highlights
- Historical Market Size (US$ Bn) and Volume (Units) Analysis, By Region, 2019 - 2024
- Market Size (US$ Bn) and Volume (Units) Analysis and Forecast, By Region, 2025 - 2032
- North America
- Europe
- East Asia
- South Asia and Oceania
- Latin America
- Middle East & Africa
- Market Attractiveness Analysis: Region
- North America Tampon Market Outlook
- Key Highlights
- Historical Market Size (US$ Bn) Analysis, By Market, 2019 - 2024
- By Country
- By Product Type
- By Material
- By Price Range
- By Distribution Channel
- Market Size (US$ Bn) Analysis and Forecast, By Country, 2025 - 2032
- U.S.
- Canada
- Market Size (US$ Bn) and Volume (Units) Analysis and Forecast, By Product Type, 2025 - 2032
- Radially Wound Pledget
- Rectangular/Square Pad
- Market Size (US$ Bn) Analysis and Forecast, By Material, 2025 - 2032
- Cotton
- Rayon
- Blended
- Others
- Market Size (US$ Bn) Analysis and Forecast, By Price Range, 2025 - 2032
- Economy
- Mid-range
- Premium
- Market Size (US$ Bn) Analysis and Forecast, By Distribution Channel, 2025 - 2032
- Supermarkets/Hypermarkets
- Specialty Stores
- Pharmacy Stores
- Online Retail
- Market Attractiveness Analysis
- Europe Tampon Market Outlook
- Key Highlights
- Historical Market Size (US$ Bn) Analysis, By Market, 2019 - 2024
- By Country
- By Product Type
- By Material
- By Price Range
- By Distribution Channel
- Market Size (US$ Bn) Analysis and Forecast, By Country, 2025 - 2032
- Germany
- France
- U.K.
- Italy
- Spain
- Russia
- Türkiye
- Rest of Europe
- Market Size (US$ Bn) and Volume (Units) Analysis and Forecast, By Product Type, 2025 - 2032
- Radially Wound Pledget
- Rectangular/Square Pad
- Market Size (US$ Bn) Analysis and Forecast, By Material, 2025 - 2032
- Cotton
- Rayon
- Blended
- Others
- Market Size (US$ Bn) Analysis and Forecast, By Price Range, 2025 - 2032
- Economy
- Mid-range
- Premium
- Market Size (US$ Bn) Analysis and Forecast, By Distribution Channel, 2025 - 2032
- Supermarkets/Hypermarkets
- Specialty Stores
- Pharmacy Stores
- Online Retail
- Market Attractiveness Analysis
- East Asia Tampon Market Outlook
- Key Highlights
- Historical Market Size (US$ Bn) Analysis, By Market, 2019 - 2024
- By Country
- By Product Type
- By Material
- By Price Range
- By Distribution Channel
- Market Size (US$ Bn) Analysis and Forecast, By Country, 2025 - 2032
- China
- Japan
- South Korea
- Market Size (US$ Bn) and Volume (Units) Analysis and Forecast, By Product Type, 2025 - 2032
- Radially Wound Pledget
- Rectangular/Square Pad
- Market Size (US$ Bn) Analysis and Forecast, By Material, 2025 - 2032
- Cotton
- Rayon
- Blended
- Others
- Market Size (US$ Bn) Analysis and Forecast, By Price Range, 2025 - 2032
- Economy
- Mid-range
- Premium
- Market Size (US$ Bn) Analysis and Forecast, By Distribution Channel, 2025 - 2032
- Supermarkets/Hypermarkets
- Specialty Stores
- Pharmacy Stores
- Online Retail
- Market Attractiveness Analysis
- South Asia & Oceania Tampon Market Outlook
- Key Highlights
- Historical Market Size (US$ Bn) Analysis, By Market, 2019 - 2024
- By Country
- By Product Type
- By Material
- By Price Range
- By Distribution Channel
- Market Size (US$ Bn) Analysis and Forecast, By Country, 2025 - 2032
- India
- Southeast Asia
- ANZ
- Rest of South Asia & Oceania
- Market Size (US$ Bn) and Volume (Units) Analysis and Forecast, By Product Type, 2025 - 2032
- Radially Wound Pledget
- Rectangular/Square Pad
- Market Size (US$ Bn) Analysis and Forecast, By Material, 2025 - 2032
- Cotton
- Rayon
- Blended
- Others
- Market Size (US$ Bn) Analysis and Forecast, By Price Range, 2025 - 2032
- Economy
- Mid-range
- Premium
- Market Size (US$ Bn) Analysis and Forecast, By Distribution Channel, 2025 - 2032
- Supermarkets/Hypermarkets
- Specialty Stores
- Pharmacy Stores
- Online Retail
- Market Attractiveness Analysis
- Latin America Tampon Market Outlook
- Key Highlights
- Historical Market Size (US$ Bn) Analysis, By Market, 2019 - 2024
- By Country
- By Product Type
- By Material
- By Price Range
- By Distribution Channel
- Market Size (US$ Bn) Analysis and Forecast, By Country, 2025 - 2032
- Brazil
- Mexico
- Rest of Latin America
- Market Size (US$ Bn) and Volume (Units) Analysis and Forecast, By Product Type, 2025 - 2032
- Radially Wound Pledget
- Rectangular/Square Pad
- Market Size (US$ Bn) Analysis and Forecast, By Material, 2025 - 2032
- Cotton
- Rayon
- Blended
- Others
- Market Size (US$ Bn) Analysis and Forecast, By Price Range, 2025 - 2032
- Economy
- Mid-range
- Premium
- Market Size (US$ Bn) Analysis and Forecast, By Distribution Channel, 2025 - 2032
- Supermarkets/Hypermarkets
- Specialty Stores
- Pharmacy Stores
- Online Retail
- Market Attractiveness Analysis
- Middle East & Africa Tampon Market Outlook
- Key Highlights
- Historical Market Size (US$ Bn) Analysis, By Market, 2019 - 2024
- By Country
- By Product Type
- By Material
- By Price Range
- By Distribution Channel
- Market Size (US$ Bn) Analysis and Forecast, By Country, 2025 - 2032
- GCC Countries
- Egypt
- South Africa
- Northern Africa
- Rest of Middle East & Africa
- Market Size (US$ Bn) and Volume (Units) Analysis and Forecast, By Product Type, 2025 - 2032
- Radially Wound Pledget
- Rectangular/Square Pad
- Market Size (US$ Bn) Analysis and Forecast, By Material, 2025 - 2032
- Cotton
- Rayon
- Blended
- Others
- Market Size (US$ Bn) Analysis and Forecast, By Price Range, 2025 - 2032
- Economy
- Mid-range
- Premium
- Market Size (US$ Bn) Analysis and Forecast, By Distribution Channel, 2025 - 2032
- Supermarkets/Hypermarkets
- Specialty Stores
- Pharmacy Stores
- Online Retail
- Market Attractiveness Analysis
- Competition Landscape
- Market Share Analysis, 2024
- Market Structure
- Competition Intensity Mapping By Market
- Competition Dashboard
- Company Profiles (Details - Overview, Financials, Strategy, Recent Developments)
- The Procter & Gamble Company
- Overview
- Segments and Product Type
- Key Financials
- Market Developments
- Market Strategy
- Johnson & Johnson
- Kimberly-Clark Corporation
- Edgewell Personal Care Company
- Svenska Cellulosa Aktiebolaget (SCA)
- First Quality Enterprises Inc.
- Corman S.p.A.
- Natracare
- Playtex
- Bodywise Ltd.
- Lil-lets
- Rossmann
- Cora
- The Procter & Gamble Company
- Appendix
- Research Methodology
- Research Assumptions
- Acronyms and Abbreviations


- Beauty & Personal Care
- Tampon Market
Tampon Market Size, Share, Trends, and Growth Forecast, 2025 - 2032
Tampon Market By Product Type (Radially Wound Pledget, Rectangular/Square Pad), Material (Cotton, Rayon, Blended), Price Range (Economy, Mid-range, Premium), Distribution Channel, and Regional Analysis for 2025 - 2032
Tampon Market Size and Trends Analysis
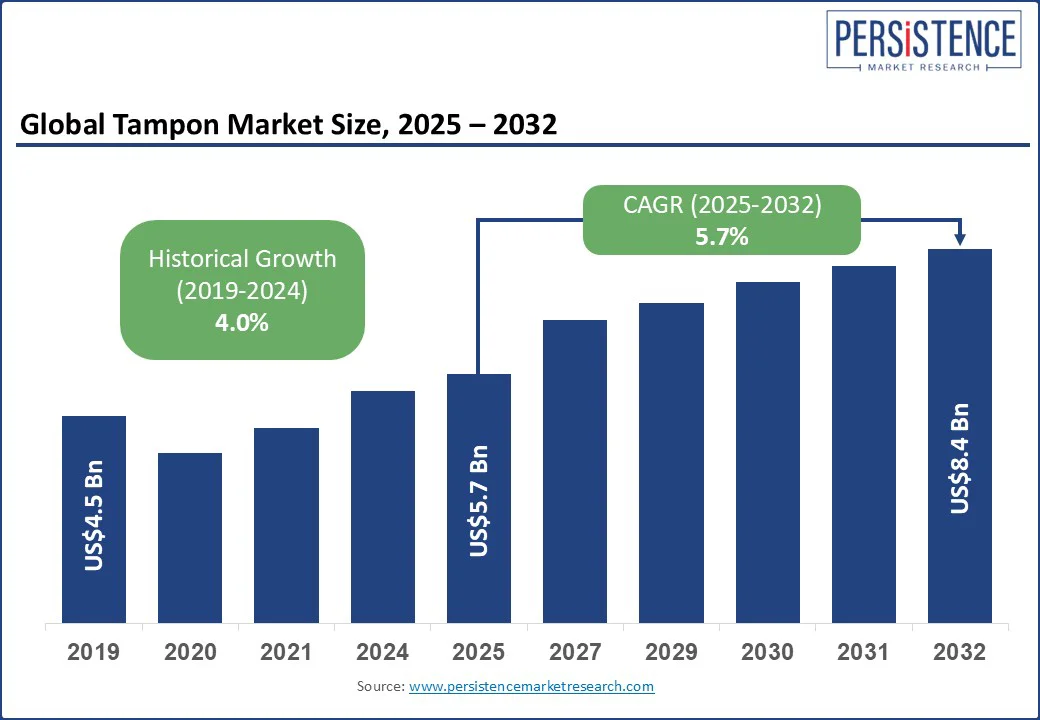
The global tampon market size is projected to rise from US$ 5.7 Bn in 2025 to US$ 8.4 Bn by 2032. It is anticipated to witness a CAGR of 5.7% during the forecast period from 2025 to 2032.
The tampon market growth is driven by the shift of consumer expectations around menstrual care toward convenience and discretion. Urban working women and students are increasingly drawn to tampons as they allow uninterrupted physical activity during long office hours, sports, or travel. The shift toward organic feminine care products has also reassured users wary of synthetic fibers or chemical residues.
Key Industry Highlights
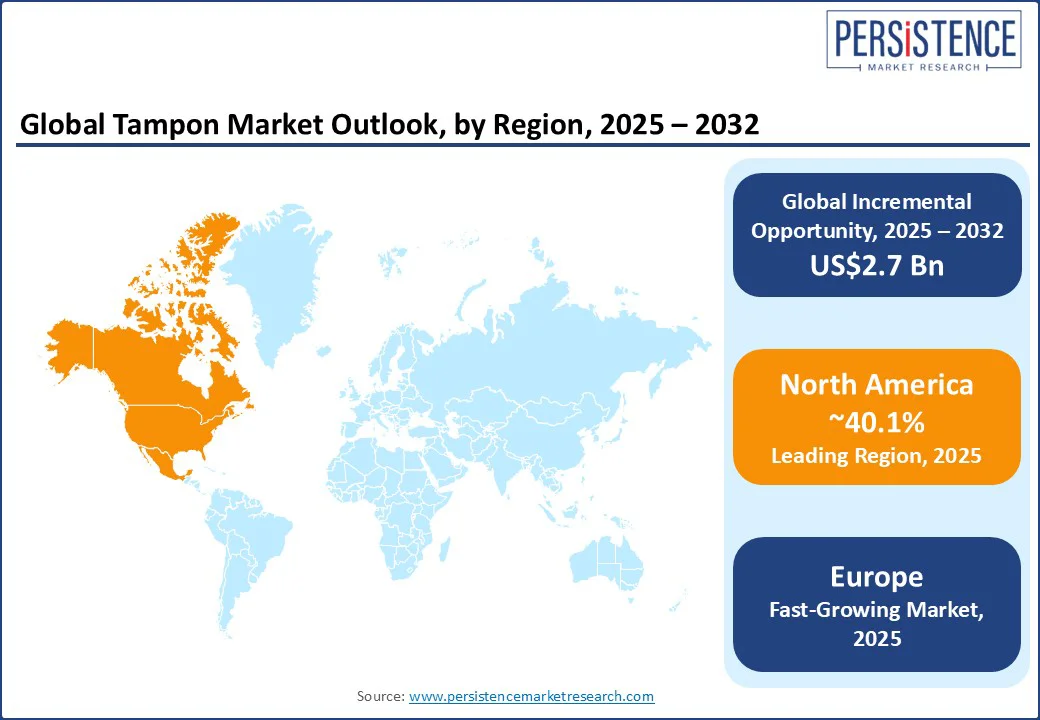
- Leading Region: North America is anticipated to hold around 40.1% of the market share in 2025, owing to the expanding presence of premium and organic feminine hygiene product brands across retail and e-commerce.
- Fastest-growing Region: Europe, owing to government initiatives promoting sustainable and eco-friendly menstrual products.
- New Tampon-based Test: The Mayo Clinic and Exact Sciences announced the development of an easy, non-invasive test to detect endometrial cancer in women with abnormal vaginal bleeding. It evaluates vaginal fluid collected on tampons for methylated DNA biomarkers of endometrial cancer.
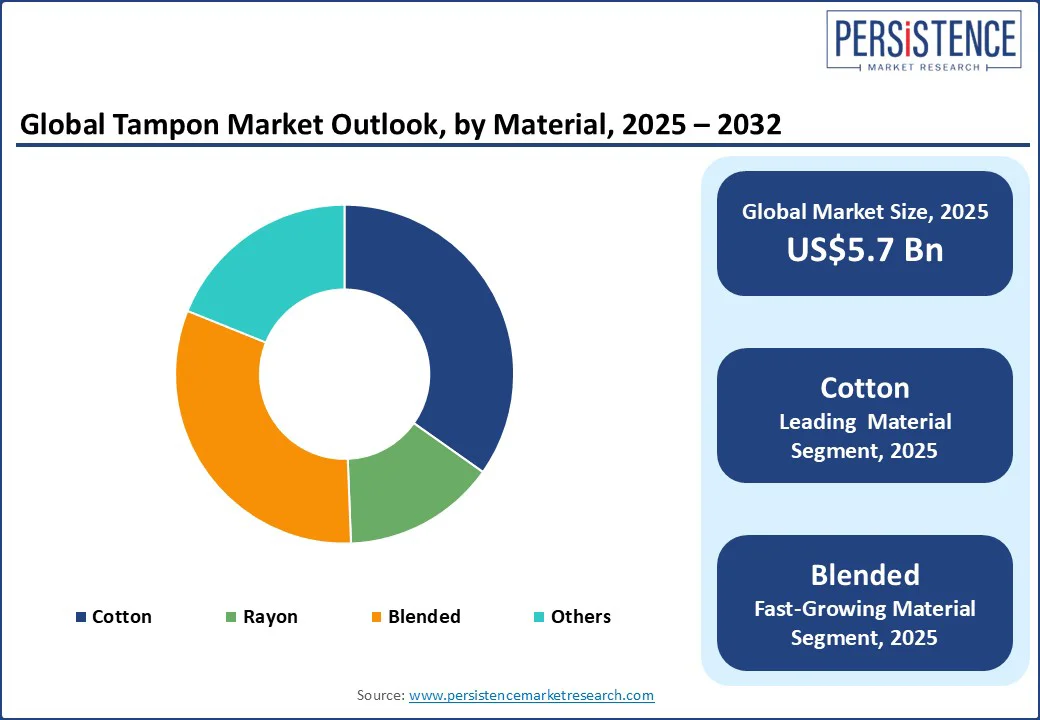
- Dominant Material: Cotton is anticipated to account for approximately 34.8% of the market share in 2025, with the rising demand for organic-certified cotton tampons in developed regions.
- Leading Distribution Channel: Supermarkets/hypermarkets are expected to hold nearly 41.6% of the market share in 2025, backed by their ability to provide broad product assortments across brands and variants.
|
Global Market Attribute |
Key Insights |
|
Tampon Market Size (2025E) |
US$ 5.7 Bn |
|
Market Value Forecast (2032F) |
US$ 8.4 Bn |
|
Projected Growth (CAGR 2025 to 2032) |
5.7% |
|
Historical Market Growth (CAGR 2019 to 2024) |
4.0% |
Market Dynamics
Driver - Office-based Accessibility Strengthens Repeat Usage
Urban working menstruators are increasingly drawn to tampons as their ease of insertion and removal fits smoothly into fast-paced lifestyles. Unlike pads, tampons allow greater freedom of movement, which is essential for women balancing office work, commuting, and social engagements.
In Singapore and Hong Kong, where long working hours and reliance on public transport are common, tampons are favored for their discreet use and reduced risk of leakage. This convenience has encouraged companies such as Kotex and Playtex to expand their marketing in metropolitan clusters, pointing to the on-the-go aspect of tampon usage as a core benefit.
Demand is further accelerated by workplaces that prioritize menstrual comfort. In 2024, several corporations in Europe, including Spain’s Desigual, began supplying free tampons in office restrooms as part of gender-inclusive employee benefits. This trend not only normalizes tampon use but also introduces more urban professionals to their practicality. The availability of tampons in professional settings increases repeat adoption as women who try them at work often carry the habit into their personal routines.
Restraint - Toxic Shock Syndrome Awareness Limits Adoption in Emerging Countries
Concerns around Toxic Shock Syndrome (TSS) continue to act as a barrier to tampon adoption, specifically in markets where awareness campaigns often highlight risks more than benefits. TSS, though rare, is linked to prolonged tampon use, and its association with high-absorbency tampons has created lasting apprehension. In China and India, where tampons are still relatively new to the mass market, health authorities and gynecologists often caution first-time users about TSS. This leads several women to choose pads as a safer alternative. This fear is magnified in rural and semi-urban regions, where limited menstrual health education spurs misconceptions.
Brands have tried to counter this perception, but the stigma lingers. In Japan, tampon adoption is noticeably lower compared to sanitary pads due to cultural conservatism and lingering anxieties around TSS. Even when companies promote organic or low-absorbency cotton tampons, health forums and social media discussions often bring TSS into focus, influencing purchasing decisions. The cautious narrative around TSS has also influenced regulatory landscapes.
Opportunity- Reusable Applicators Appeal to Environmentally Conscious Consumers
The rise of eco-friendly tampon options, mainly reusable applicators, is creating new opportunities for brands by catering to the surging demand for sustainable menstrual products. Several urban consumers, mainly in Europe and parts of Asia Pacific, are actively seeking products that reduce single-use plastic waste. For example, in 2023, U.K.-based Dame broadened its presence across Europe by promoting its reusable tampon applicator as a clean and green alternative. This helped the brand strengthen loyalty among environmentally conscious buyers.
Beyond environmental appeal, reusable applicators are also being marketed as a premium and long-term, cost-effective solution. These products are attracting middle- and upper-income consumers who value both sustainability and durability. Germany’s Einhorn, which traditionally focused on eco-friendly condoms, introduced sustainable tampon solutions packaged with reusable applicators. Its products gained popularity among young women who prefer brands with powerful ethical positioning.
Category-wise Analysis
Material Insights
By material, the market is segregated into cotton, rayon, blended, and others. Among these, cotton is predicted to hold approximately 34.8% of the market share in 2025 as modern consumers are questioning the safety of synthetic fibers and chemical treatments in traditional tampons.
Recent studies, including the one published in Environment International in 2023, revealed the presence of trace metals in various mainstream tampon brands. While the levels were within regulated limits, the findings pushed several users toward organic cotton options. These are typically marketed as free from pesticides, chlorine bleaching, and fragrance additives.
Blended tampons are gaining traction as they balance performance with cost-effectiveness, making them appealing to both manufacturers and consumers. These often use a mix of cotton and rayon. This combination allows for better absorbency at a lower production cost.
Rayon, when combined with cotton, provides a smooth texture that reduces friction during insertion and removal. This feature has been emphasized in consumer marketing across Asia Pacific, where tampon penetration remains low, but awareness is increasing.
Distribution Channel Insights
By distribution channel, the market is divided into supermarkets/hypermarkets, specialty stores, pharmacy stores, and online retail. Out of these, supermarkets/hypermarkets are poised to account for around 41.6% of the tampon market share in 2025, due to their ability to combine high visibility with consumer trust.
These outlets enable customers to browse a wide range of menstrual products side by side, compare prices, and make instant purchase decisions. In Europe, retailers such as Tesco and Carrefour have capitalized on this trend by launching private-label tampon brands that compete directly with Tampax and o.b.
Pharmacy stores are expected to experience steady growth as they position themselves as health and wellness destinations rather than merely medicine suppliers. This shift has built consumer trust, especially among women who associate pharmacies with professional advice and safety.
Another driver is the surging demand for organic and dermatologically tested tampons, which are often first launched through pharmacies before reaching mass retail. In addition, pharmacies are capitalizing on digital integration, thereby augmenting sales.
Regional Insights
North America Tampon Market Trends - Rising Awareness of Menstrual Hygiene Influences Product Preferences
In 2025, North America is anticipated to account for nearly 40.1% share owing to changing consumer preferences, sustainability concerns, and economic pressures. Increasing awareness about menstrual hygiene and a surge in preference toward eco-friendly and organic alternatives are also expected to boost the market. Brands are utilizing these trends by delivering unique products that appeal to environmentally conscious and health-conscious consumers.
The U.S. tampon market is seeing a high demand for organic and natural products. This is propelled by consumer concerns over the use of synthetic materials and a preference for products made from organic cotton and other natural fibers.
Economic factors, specifically inflation, have, however, led to high prices for menstrual products. Since 2019, the average price of a pack of tampons has risen by 36%, reaching approximately US$8.29 in 2024. This price hike has contributed to a decline in sales, with annual sales of pads and tampons dropping by 12% and 16%, respectively.
Europe Tampon Market Trends - EDANA Guidelines Fortify Quality Standards and Trace Chemical Limits
Tampons in Europe must comply with the General Product Safety Regulation (2023/988/EU), ensuring that manufacturers provide consumers with products that are safe to use. Voluntary guidelines such as the EDANA Tampons Code of Practice outline minimum standards for tampon production, labeling, and usage instructions.
Recent studies have raised concerns about the presence of toxic metals, including lead, arsenic, and cadmium, in tampons. Hence, EDANA emphasizes that heavy metals and trace chemicals are not intentionally added to tampons and are not part of modern absorbent hygiene products.
They tend to be present as residuals from the manufacturing process or due to environmental exposure. EDANA's Stewardship Program sets guidance values for substances such as pesticides, ensuring that detected levels are well below safety thresholds.
In several countries across Europe, campaigns and advocacy programs are actively promoting menstrual education and breaking cultural taboos. In the U.K. and Germany, NGOs collaborate with schools and community centers to provide education and access to menstrual products, including tampons.
Asia Pacific Tampon Market Trends - Affordable Sanitary Products Promote Education and Reduce Stigma
Across Asia Pacific, various initiatives are actively promoting the use of tampons and improving menstrual health awareness. These efforts encompass government policies, NGO programs, and community-backed projects aimed at providing access to menstrual hygiene products and education.
In India, the Myna Mahila Foundation empowers women by producing low-cost sanitary products and encouraging open discussions about menstruation. Their approach not only addresses hygiene requirements but also spurs community engagement and employment opportunities.
Similarly, the Desai Foundation launched the Asani Sanitary Napkins initiative. It helps in delivering affordable menstrual products made by rural women, thereby promoting education and reducing stigma. In Taiwan, Vivi Lin, a prominent activist, has been at the forefront of advocating for menstrual equity. Her efforts led to Taiwan becoming the first country in Asia to mandate the nationwide provision of free menstrual products.
Competitive Landscape
The global tampon market is highly competitive, with established brands facing pressure from new entrants and shifting consumer preferences. Leading brands such as Procter & Gamble, Kimberly-Clark, and Edgewell Personal Care continue to dominate.
To cater to the surging demand for eco-friendly products, brands such as Viv have emerged. Viv's organic cotton tampons, free from toxins and synthetic materials, have gained immense popularity, leading to a 3,000-person waitlist. Emerging players are focusing on transparency, including full ingredient disclosures and heavy metal testing, to resonate with health-conscious consumers.
Key Industry Developments
- In February 2025, Berlin-based Vyld introduced Kelpon, the world’s first tampon made from seaweed. The product was made available across restrooms in Germany through partnerships with employers, gyms, key event organizers, and coworking spaces.
- In May 2024, Daye extended access to cervical cancer prevention with the launch of its new HPV Diagnostic Tampon. The new at-home test enables users in the U.K. to discreetly and easily screen for 14 high-risk HPV strains.
Companies Covered in Tampon Market
- The Procter & Gamble Company
- Johnson & Johnson
- Kimberly-Clark Corporation
- Edgewell Personal Care Company
- Svenska Cellulosa Aktiebolaget (SCA)
- First Quality Enterprises Inc.
- Corman S.p.A.
- Natracare
- Playtex
- Bodywise Ltd.
- Lil-lets
- Rossmann
- Cora
Frequently Asked Questions
The tampon market is projected to reach US$ 5.7 Bn in 2025.
Surging preference for discreet menstrual products and rising adoption of organic cotton tampons are key drivers of the market.
The tampon market is poised to witness a CAGR of 5.7% from 2025 to 2032.
Development of reusable tampon applicators and strategic collaborations with healthcare providers are key market opportunities.
The Procter & Gamble Company, Johnson & Johnson, and Kimberly-Clark Corporation are a few key market players.


