


- Automation & Robotics
- Robotic End of Arm Tooling Market
Robotic End of Arm Tooling Market Size, Share, and Growth Forecast 2026 - 2033
Robotic End of Arm Tooling Market by Product Type (Grippers, Welding Torches, Suction Cups, Clamps, Fastening Tools, Painting/Spray Tools, Cutting & Soldering Tools, Others), Robot Type (Articulated Robots, Collaborative Robots/Cobots, SCARA Robots, Cartesian Robots, Delta Robots, Others), End-Use Industry (Automotive & Transportation, Electronics & Semiconductor, Food & Beverage, Healthcare & Pharmaceutical, Aerospace & Defense, Logistics & Warehousing, Consumer Goods & Packaging, Others), by Regional Analysis, 2026 - 2033
Robotic End of Arm Tooling Market Size and Trend Analysis
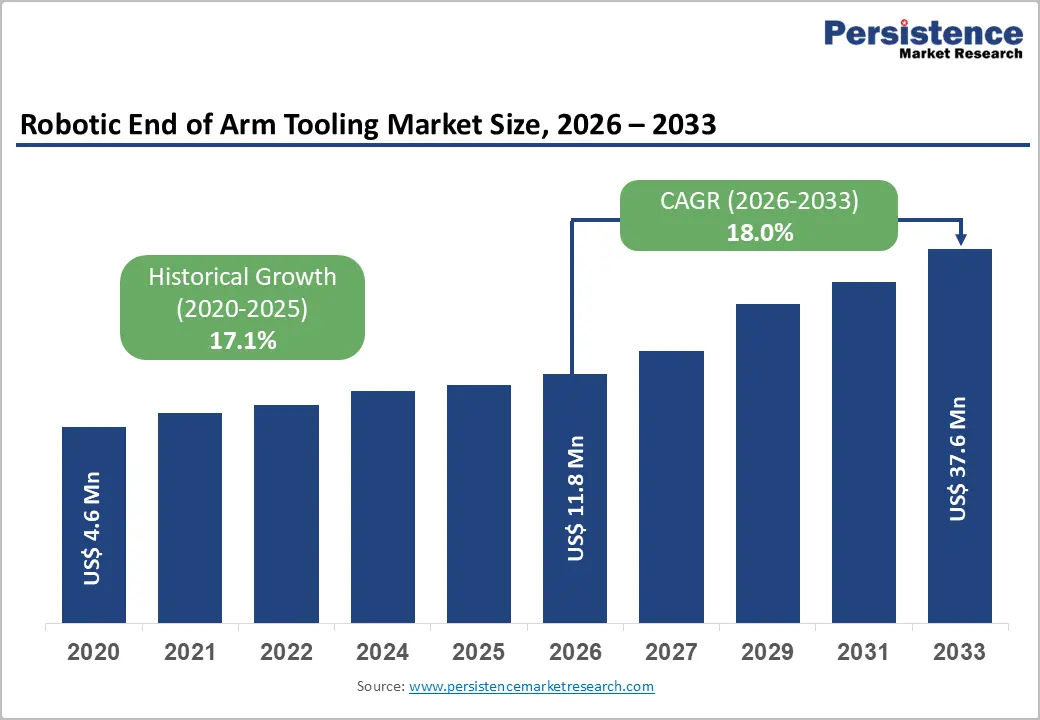
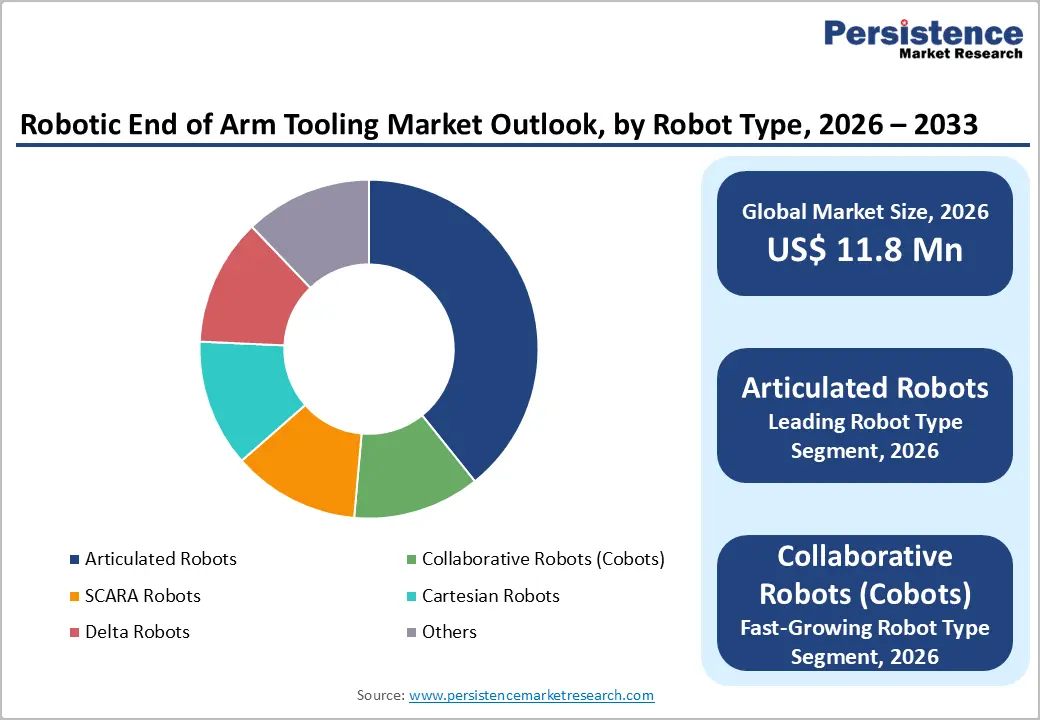
The global robotic end of arm tooling market size is expected to be valued at US$ 11.8 billion in 2026 and projected to reach US$ 37.6 billion by 2033, growing at a CAGR of 18.0% between 2026 and 2033.
The Robotic End of Arm Tooling (EOAT) market is on a strong upward trajectory, underpinned by accelerating global robot installations, the proliferation of collaborative robots (cobots), and rising demand for intelligent, sensor-integrated tooling across manufacturing and logistics sectors. According to the International Federation of Robotics (IFR), the global operational stock of industrial robots surpassed 4,664,000 units in 2024, a 9% year-on-year increase, directly expanding the addressable EOAT market, as each robot system requires purpose-engineered tooling. The transition to smart manufacturing under Industry 4.0 frameworks, combined with e-commerce-fueled warehouse automation and EV-driven automotive retooling, is simultaneously increasing both EOAT unit volumes and average selling prices, sustaining the market's double-digit growth trajectory through 2033.
Key Industry Highlights
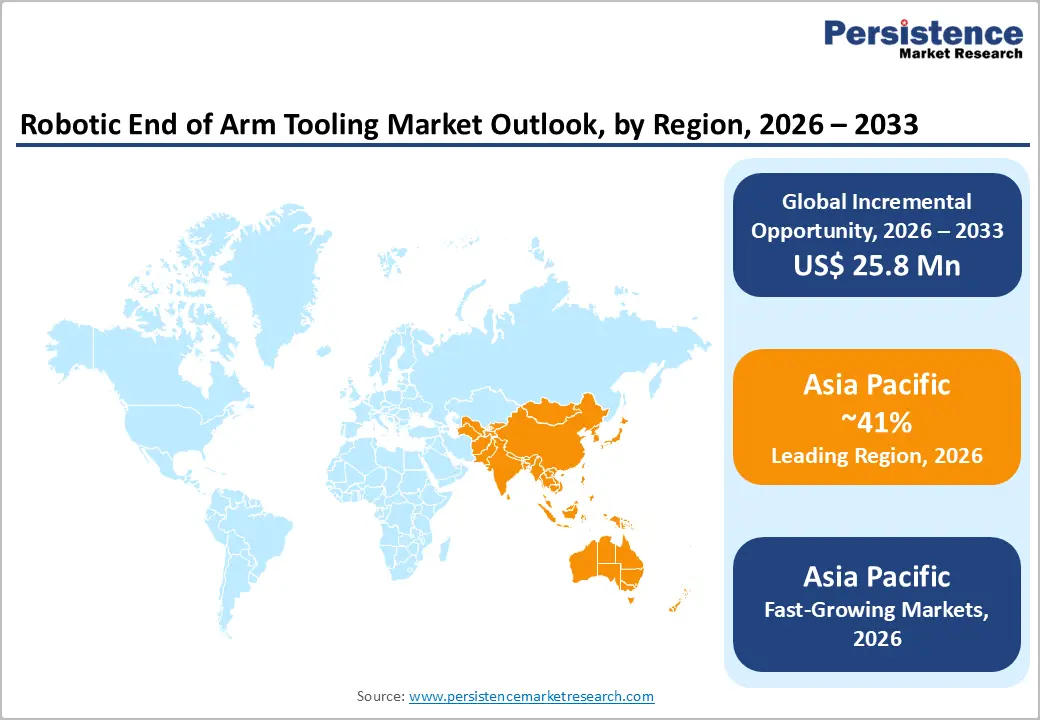
- Leading Region: Asia Pacific leads global Robotic EOAT adoption with approximately 41% revenue share in 2025, underpinned by China's 295,000 robot installations in 2024, Japan's world-leading robot OEMs, and South Korea's industry-leading robot density of 1,012 robots per 10,000 workers.
- Fastest Growing Region: Asia Pacific is simultaneously the fastest-growing region, projected at approximately 20% CAGR through 2033, driven by India's record 9,100 robot installations in 2024, robust PLI-backed manufacturing investment, and ASEAN supply-chain diversification trends.
- Dominant Segment: Grippers dominate the Robotic EOAT market with approximately 33% product-type share in 2025, supported by universal applicability across industries and SCHUNK's portfolio of over 11,000 standard gripper variants addressing diverse automation requirements globally.
- Fastest Growing Segment Cobot-specific EOAT is the fastest-growing robot type segment, driven by the cobot market's 20%+ annual growth rate, ISO/TS 15066 safety compliance requirements, and rapid cobot adoption across healthcare, food & beverage, and SME manufacturing sectors worldwide.
- Key Market Opportunity: Soft robotic and AI-guided adaptive EOAT systems represent the most significant growth opportunity, unlocking food processing, pharmaceutical, and e-commerce automation sectors where rigid EOAT has historically been technically inadequate or commercially unviable.
| Key Insights | Details |
|---|---|
| Robotic End of Arm Tooling Market Size (2026E) | US$ 11.8 Billion |
| Market Value Forecast (2033F) | US$ 37.6 Billion |
| Projected Growth CAGR (2026 - 2033) | 18.0% |
| Historical Market Growth (2020 - 2025) | 17.1% CAGR |
Market Dynamics
Market Growth Drivers
Record Global Robot Installations Creating Structural EOAT Volume Demand
The most direct and powerful driver of the Robotic EOAT market is the sustained growth in global industrial robot installations, which creates a structural demand relationship, every robot requires one or more end of arm tools. The International Federation of Robotics (IFR) confirmed a record 590,000 industrial robot installations in 2023, with Asia accounting for 73% of total deployments. The cumulative global operational robot stock surpassed 4.6 million units in 2024, representing a massive replacement and upgrade market for EOAT components. In the automotive sector, which accounts for 34% of global robot installations per IFR, EOAT demand is particularly strong across welding, painting, press handling, and EV battery assembly operations. With robot installations forecast to grow at a robust pace through 2033, EOAT market volumes are structurally linked to this expansion.
E-Commerce Boom and Warehouse Automation Accelerating Gripper and Vacuum Tool Demand
The sustained expansion of global e-commerce, which surpassed US$ 6.3 trillion in 2024 according to UNCTAD (United Nations Conference on Trade and Development), is a powerful demand catalyst for robotic EOAT, particularly adaptive grippers, vacuum cups, and multi-tool systems deployed in automated fulfillment centers. Global logistics operators including Amazon Robotics, Ocado Technology, and DHL Supply Chain are scaling up robotic picking deployments that rely on application-specific EOAT. The U.S. Bureau of Labor Statistics has documented sustained warehousing labor shortages that reinforce the ROI case for robotic automation. As SKU counts increase and consumer expectations for same-day delivery intensify, demand for adaptive, AI-guided EOAT capable of handling unstructured, mixed-format inventory is creating a high-growth sub-segment within the broader EOAT market.
Market Restraints
High Application-Specific Customization Costs Limiting SME Adoption
Unlike commodity robotic components, EOAT solutions are frequently application-specific, engineered for particular part geometries, materials, weight profiles, and operating environments. This customization requirement elevates non-recurring engineering (NRE) costs and extends project lead times. According to the Association for Advancing Automation (A3), tooling and integration costs can represent 30-50% of total robot system deployment costs. For small and medium enterprises (SMEs), which account for over 90% of businesses globally per the World Bank, this financial burden can be prohibitive, limiting market penetration beyond large industrial enterprises and constraining overall EOAT adoption rates.
Supply Chain Vulnerabilities and Extended Lead Times for Precision EOAT Components
Robotic EOAT systems incorporate precision-machined metal components, specialized elastomers, pneumatic actuators, and increasingly, microelectronic sensor packages, all sourced from globally distributed supply chains. The 2021-2023 global semiconductor shortage severely disrupted smart EOAT production schedules, particularly for electrically-actuated grippers and sensor-integrated tooling. The European Commission's Critical Raw Materials Act (2024) explicitly identifies supply chain vulnerabilities in precision manufacturing components as a strategic concern. Custom EOAT lead times, typically 8-16 weeks for bespoke designs, can delay entire automation project timelines, eroding customer confidence and creating near-term demand volatility for EOAT suppliers.
Market Opportunities
Soft Robotics and AI-Adaptive Gripping Unlocking Previously Unaddressed Markets
Soft robotic EOAT, leveraging flexible, compliant materials and pneumatic actuation, represents a transformative opportunity, enabling robotic automation in sectors where conventional rigid tooling is ineffective. Fresh produce handling, fragile consumer goods packaging, pharmaceutical vial manipulation, and e-commerce mixed-item picking all require gentle, adaptive grasping that soft EOAT uniquely provides. Companies such as Soft Robotics Inc. have demonstrated systems achieving over 95% reliable grasping across hundreds of diverse SKUs without reprogramming. When combined with AI-powered vision systems and tactile force sensing, adaptive EOAT can autonomously identify and grasp novel objects, a capability the U.S. Department of Defense Advanced Research Projects Agency (DARPA) has actively funded through its Robotic Autonomy in Complex Environments with Resiliency (RACER) and related programs. The food & beverage sector, governed by strict hygiene standards under FDA 21 CFR Part 117 and EU Regulation No. 852/2004, represents a particularly high-value market for hygienic soft EOAT systems.
Cobot-Compatible EOAT Ecosystem Driven by Rapid Global Cobot Market Expansion
The global collaborative robot (cobot) market is expanding at over 20% annually, creating proportionate and fast-growing demand for lightweight, force-limited, and safety-certified EOAT specifically designed for cobot platforms. Cobot EOAT must comply with ISO/TS 15066 (Collaborative Robots) and ISO 10218 safety standards, requirements that conventional industrial EOAT does not typically address. Specialist suppliers including Robotiq Inc., OnRobot A/S, and Weiss Robotics have built dedicated cobot EOAT ecosystems comprising grippers, force-torque sensors, and vision systems designed for rapid, tool-free deployment on cobot platforms. As cobots penetrate healthcare, food & beverage, and pharmaceutical sectors, which mandate EOAT materials compliant with FDA and EU food-contact regulations, a premium, high-specification cobot EOAT market segment is emerging with strong growth potential through 2033.
Category-wise Insights
Product Type Analysis
Grippers are the undisputed leading product type in the global Robotic End of Arm Tooling market, accounting for approximately 33% of total revenue share in 2025. Their market leadership reflects their universal applicability, grippers are deployed across virtually every robotic automation application, from automotive body assembly and electronics PCB handling to pharmaceutical dispensing and food processing. SCHUNK SE & Co. KG, the world's leading gripper manufacturer, offers a portfolio of over 11,000 standard gripper variants, underscoring the category's enormous breadth and addressable application scope. The transition from pneumatic to electric parallel grippers with integrated force measurement and IoT connectivity is increasing average unit prices and expanding applications into precision electronics and collaborative assembly environments. Suction cups represent the second-largest product type, critical for flat, smooth-surface handling in logistics and consumer goods packaging. Smart grippers with embedded sensing are the fastest-growing sub-segment within product types.
Robot Type Analysis
Articulated Robots, featuring rotary joints across 4 to 7 axes, are the dominant robot type for EOAT deployment, representing approximately 58% of EOAT demand by robot type in 2025. Their market leadership is structurally tied to articulated robots being the most prevalent industrial robot configuration globally, the IFR reported articulated robots constituted approximately 60% of all industrial robot installations in 2023. With payload capacities ranging from 3 kg to over 2,000 kg and a full 360-degree workspace envelope, articulated robots support the widest range of EOAT configurations across welding, palletizing, painting, and assembly tasks. Meanwhile, Collaborative Robots (Cobots) represent the fastest-growing robot type for EOAT deployment, with their installed base expanding at over 20% annually and creating dedicated demand for safety-certified, lightweight EOAT solutions that conventional articulated-robot tooling cannot serve.
End-Use Industry Analysis
The Automotive & Transportation industry is the dominant end-use vertical, contributing approximately 38% of total EOAT revenues by industry in 2025. This leadership reflects the automotive sector's foundational role in industrial robotics, accounting for 34% of global robot installations in 2023 per IFR. Automotive EOAT requirements span welding torches for body-in-white assembly, vacuum grippers for glass and panel handling, spray tools for paint application, and precision grippers for powertrain and EV battery module assembly. Germany's automotive sector, deploying 26,982 industrial robots in 2024, and Japan's ~13,000 automotive robot installations in 2024 sustain high EOAT procurement volumes. The transition to electric vehicle (EV) manufacturing is additionally generating new EOAT requirements for battery cell handling and electrode coating applications. Logistics & Warehousing is the fastest-growing end-use vertical, driven by global e-commerce expansion exceeding US$ 6.3 trillion in 2024 per UNCTAD.
Regional Insights
North America Robotic End of Arm Tooling Market Trends and Insights
North America holds approximately 27% of the global Robotic EOAT market share in 2025, led by the United States. Federal industrial policy is a significant demand catalyst: the CHIPS and Science Act ($52.7 billion in semiconductor manufacturing incentives), the Inflation Reduction Act (IRA) incentivizing EV and clean energy manufacturing, and the Advanced Manufacturing National Program Office (AMNPO) collectively drive automation investments in newly established domestic production facilities. The Association for Advancing Automation (A3) reported a 4.3% increase in North American robot orders in H1 2025 versus H1 2024, with EOAT demand growing commensurately.
The U.S. EOAT innovation ecosystem is anchored by specialist manufacturers including ATI Industrial Automation (tool changers and force-torque sensors), Applied Robotics Inc., and DESTACO (toggle clamps and grippers), all supported by strong university-industry R&D partnerships and active DARPA and DOE funding for advanced manufacturing automation. The reshoring of semiconductor, EV battery, and defense manufacturing, driven by geopolitical supply chain realignment, is creating greenfield automation investment opportunities, making North America a sustained high-value market for advanced EOAT solutions through 2033.
Europe Robotic End of Arm Tooling Market Trends and Insights
Europe accounts for approximately 24% of global Robotic EOAT market share in 2025, with Germany, Italy, France, Spain, and the UK as primary markets. Germany is both the largest EOAT consumption and manufacturing hub in Europe, home to global EOAT leaders SCHUNK SE & Co. KG, Festo AG & Co. KG, Zimmer Group, and Schmalz GmbH. The IFR confirmed 26,982 industrial robot installations in Germany in 2024, sustaining high EOAT volumes. Spain's 5,100 robot installations and France's 4,900 installations further contribute to European EOAT demand, with aerospace and food processing as key growth verticals.
The EU Machinery Regulation 2023/1230, replacing the legacy Machinery Directive 2006/42/EC, establishes harmonized safety standards for EOAT across EU member states, streamlining compliance for pan-European manufacturers and reducing market fragmentation. Europe's Horizon Europe research program continues to fund collaborative robotics and smart manufacturing research, generating technology spillovers into commercial EOAT development. The UK's Made Smarter initiative and Germany's sustained Industry 4.0 investment framework ensure continued institutional support for innovation in intelligent, modular EOAT products through the forecast period.
Asia Pacific Robotic End of Arm Tooling Market Trends and Insights
Asia Pacific dominates the global Robotic End of Arm Tooling market with approximately 41% revenue share in 2025, projected to grow at a CAGR of approximately 20% from 2026 to 2033, making it simultaneously the leading and fastest-growing region. China is the world's single largest robot market: the IFR reported 295,000 industrial robot installations in China in 2024, 54% of global total, with electronics accounting for 34% of domestic robot shipments. China's 'Made in China 2025' initiative and expanding domestic cobot manufacturers are driving both volume EOAT demand and new product development. Japan contributes premium EOAT demand through its world-leading robot OEMs, FANUC, Yaskawa Electric Corporation, and Denso Corporation, which integrate proprietary tooling into their robot platforms.
India is the region's fastest-growing national EOAT market, recording 9,100 robot installations in 2024, a 7% year-on-year increase, ranking sixth globally per IFR. India's Production Linked Incentive (PLI) scheme for electronics, pharmaceuticals, and automotive manufacturing is generating significant new automation investments, directly amplifying EOAT demand. South Korea, with the world's highest robot density at 1,012 robots per 10,000 manufacturing workers per IFR, drives premium EOAT demand in semiconductor wafer handling and display manufacturing. Vietnam and Thailand are emerging as significant new EOAT markets as global electronics and automotive OEMs establish new ASEAN production facilities, benefiting from supply-chain diversification strategies post-2020.
Competitive Landscape
The global robotic end-of-arm tooling market exhibits a moderately fragmented structure, with the presence of large automation solution providers alongside specialized tooling manufacturers. Competition is primarily driven by technological differentiation, product versatility, and the ability to support multiple robotic platforms across industrial applications. Vendors focus on optimizing payload-to-weight ratios, improving tool-change efficiency, and offering modular EOAT solutions that can be easily integrated with different robot systems. As automation adoption expands across industries, suppliers are increasingly emphasizing customization and application-specific tooling to address diverse manufacturing requirements.
Market participants are also prioritizing the development of intelligent EOAT solutions that incorporate sensing technologies, vision capabilities, and digital connectivity to enhance precision and operational efficiency. Strategic focus is shifting toward value-added offerings such as integrated automation packages, engineering support, and lifecycle services. In addition, companies are exploring new business models including subscription-based tooling services and digital simulation platforms, enabling faster deployment, improved productivity, and stronger long-term customer relationships.
Key Developments
- January, 2026: Bharat Forge signed a memorandum of understanding with Germany-based Agile Robots to explore collaboration in AI-driven robotics and industrial automation, focusing on developing vision-based robotic systems and intelligent automation solutions for civilian manufacturing sectors including automotive, healthcare, and consumer electronics.
- January, 2026: EYOU Robot Technology launched the world’s first fully automated production line for robot joint modules in Shanghai’s Zhangjiang Robot Valley, integrating assembly, calibration, and testing processes to enable large-scale manufacturing and strengthen supply capacity for humanoid robot manufacturers.
Companies Covered in Robotic End of Arm Tooling Market
- SCHUNK SE & Co. KG
- FIPA GmbH
- Festo AG & Co. KG
- Applied Robotics Inc.
- SMC Corporation
- Piab AB
- Robotiq Inc.
- EMI Corporation
- Zimmer Group
- Soft Robotics Inc.
- DESTACO (Dover Corporation)
- Bastian Solutions LLC (Toyota Industries)
- ATI Industrial Automation (IDEX Corporation)
- IAI Corporation (Intelligent Actuator Inc.)
- Schmalz GmbH
- OnRobot A/S
- Norgren (IMI plc)
- Gimatic S.r.l.
- Weiss Robotics GmbH & Co. KG
- Pneumax Group
Frequently Asked Questions
The global Robotic End of Arm Tooling market is estimated at US$ 11.8 billion in 2026 and is projected to reach US$ 37.6 billion by 2033, supported by rising industrial robot installations and increasing automation across manufacturing and logistics sectors.
The market is primarily driven by growing industrial robot deployments, expansion of e-commerce warehouse automation, rapid adoption of collaborative robots, and new tooling requirements emerging from electric vehicle and battery manufacturing.
Asia Pacific leads the market due to strong robotics adoption in China, a well-established robot manufacturing ecosystem in Japan, and high robot density in South Korea.
Key growth opportunities exist in soft robotic and AI-enabled adaptive tooling, expanding cobot-compatible EOAT solutions, and service-based robotics models that enable easier adoption among small and medium manufacturers.
Key companies operating in the market include SCHUNK SE & Co. KG, Festo AG & Co. KG, ATI Industrial Automation, SMC Corporation, Piab AB, Robotiq Inc., Zimmer Group, Schmalz GmbH, OnRobot A/S, DESTACO, Soft Robotics Inc., and Applied Robotics Inc.


