


- Specialty & Fine Chemicals
- Recycled Copper Market
Recycled Copper Market Size, Share, and Growth Forecast 2026 - 2033
Recycled Copper Market by Scrap Grade (No. 1 - 99% Cu Content, No. 2 - 94%-98% Cu Content, Light Copper Scrap - 88%-92% Cu Content, Red Brass Scrap - 75%-85% Cu Content, Others), by Source (Semi-Finished Products, Unalloyed Wires, Copper Smelter Slag, Electronic Scrap, Machinery Parts, Automotive Components, Solar Power Systems, Others), End-user, and Regional Analysis, 2026 - 2033
Recycled Copper Market Size and Trend Analysis
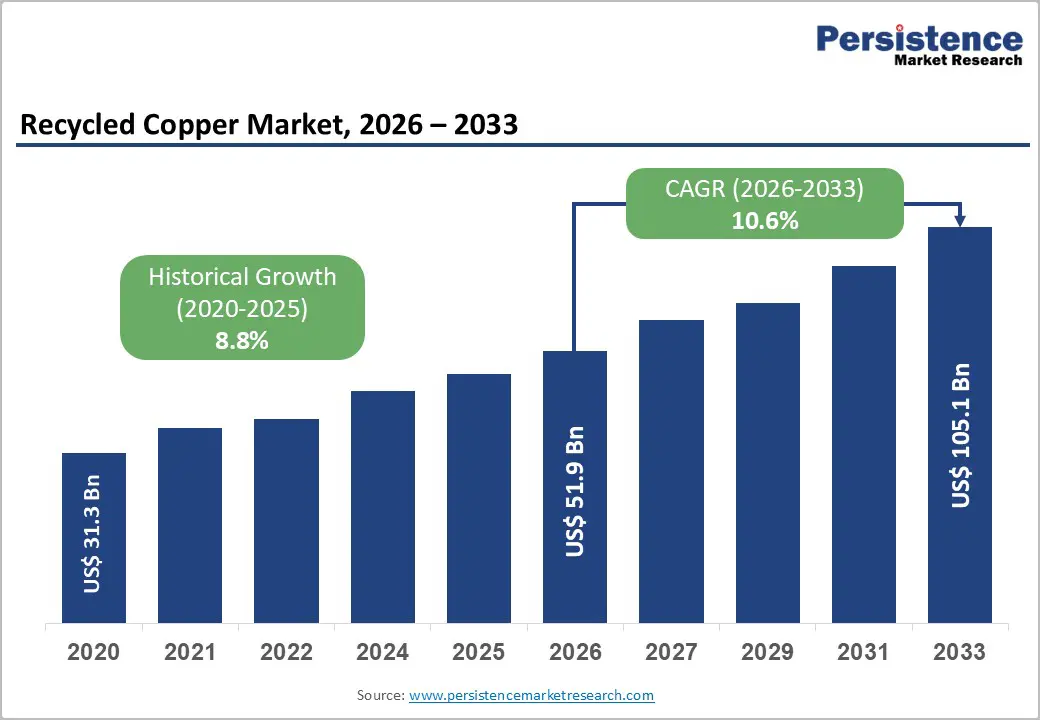
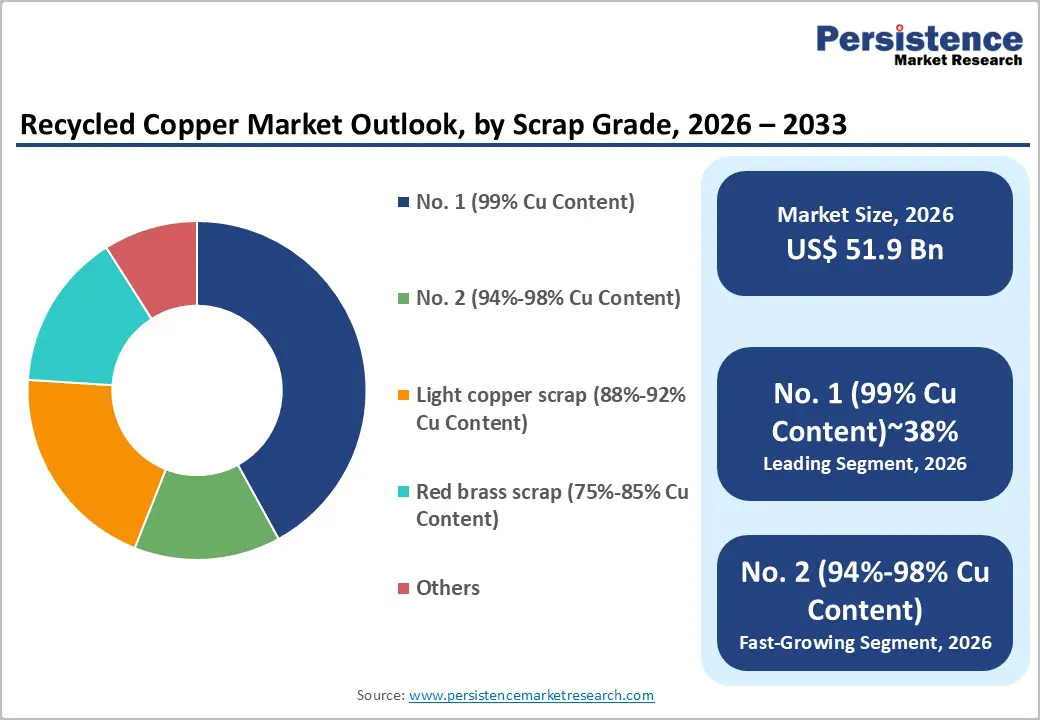
The global recycled copper market size is likely to be valued at US$ 51.9 Billion in 2026 and is expected to reach US$ 105.1 Billion by 2033, growing at a CAGR of 10.6% during the forecast period from 2026 to 2033. The market is fundamentally propelled by escalating global demand for sustainable copper sourcing, driven by renewable energy expansion, electric vehicle proliferation, and tightening environmental regulations on virgin copper mining.
Key Industry Highlights:
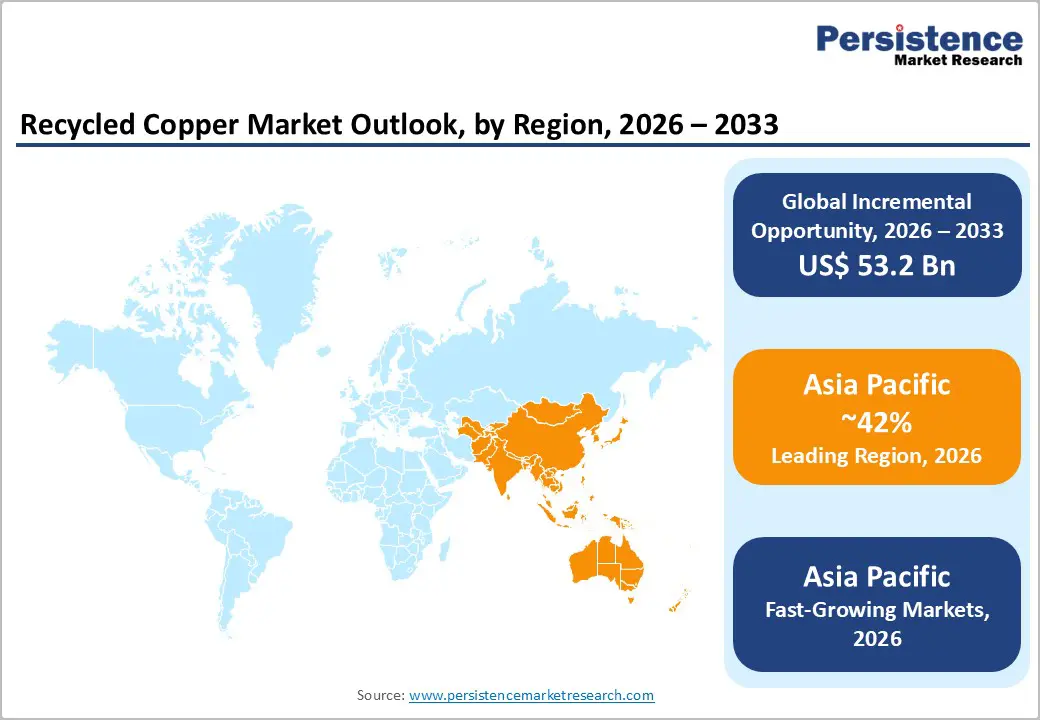
- Leading Region: Asia Pacific leads the global recycled copper market as the dominant region holding 43% share, with China consuming largest share of global copper supply and aggressively scaling secondary processing capacity under its "Dual Carbon" decarbonization strategy and national circular economy policies.
- Fastest-Growing Region: Asia Pacific is also the fastest-growing region with rising CAGR of 12.3%, driven by India's EV and solar expansion, rising ASEAN manufacturing output, and Japan's world-class urban mining capabilities generating accelerating secondary copper recovery volumes.
- Leading Segment: Electrical & Electronics is the dominant end-use segment, holding approximately 36% market share, sustained by global investments in smart grids, 5G infrastructure, data centers, and energy-efficient appliance production requiring high-conductivity copper inputs.
- Fastest-Growing Segment: Solar Power Systems represent the fastest-growing source segment, with IRENA projecting global installed solar PV capacity exceeding 5,457 GW by 2030, creating a rapidly growing feedstock stream of copper-rich decommissioned panel components.
- Key Opportunity: The most significant market opportunity lies in scaling formal e-waste recycling infrastructure, as only 22.3% of the approximately 62 million tonnes of global e-waste generated in 2023 was formally processed, representing a massive untapped high-purity secondary copper feedstock base.
| Key Insights | Details |
|---|---|
| Recycled Copper Market Size (2026E) | US$ 51.9 Billion |
| Market Value Forecast (2033F) | US$ 105.1 Billion |
| Projected Growth CAGR (2026 - 2033) | 10.6% |
| Historical Market Growth (2020 - 2025) | 8.8% |
Market Dynamics
Drivers - Surging Demand from Electrification and Renewable Energy Sectors
The global transition toward clean energy and electrification is one of the most powerful drivers increasing demand for recycled copper. According to the International Energy Agency (IEA), solar photovoltaic and wind energy projects are expected to account for most new electricity generation capacity additions through 2030. Copper plays an essential role in these systems, as it is widely used in wiring, transformers, and inverters due to its excellent electrical conductivity.
A single onshore wind turbine typically requires around 3 to 5 metric tonnes of copper, while offshore wind installations can use up to 15 metric tonnes per megawatt of capacity. Additionally, the Copper Development Association notes that battery electric vehicles consume nearly 83 kilograms of copper per unit, compared with about 23 kilograms in traditional internal combustion engine vehicles. Because recycled copper provides comparable metallurgical quality while reducing environmental impact, many clean energy developers and EV manufacturers prefer it as a sustainable sourcing option that also helps mitigate exposure to primary copper price volatility.
Regulatory Frameworks Advancing Circular Economy Adoption
Government regulations and international policy frameworks promoting circular economy principles are significantly strengthening demand for recycled copper. The European Union Circular Economy Action Plan, introduced under the European Green Deal, sets clear targets for increasing the use of secondary raw materials in industrial production and mandates higher recycling rates for non-ferrous metals. In the United States, the United States Environmental Protection Agency actively promotes metal recycling and reports that copper recycling produces around 65% fewer carbon emissions compared to primary smelting.
Furthermore, amendments to the Basel Convention that regulate the international movement of hazardous scrap materials have encouraged countries to strengthen domestic recycling infrastructure. These regulatory initiatives are pushing manufacturers in sectors such as automotive, electronics, and construction to gradually increase the share of recycled copper in their supply chains. As a result, regulatory support is embedding long-term structural demand for recycled copper across the global industrial value chain.
Restraint - Volatility in Scrap Supply and Inconsistency in Scrap Quality
One of the key challenges limiting the growth of the recycled copper market is the inconsistent availability of scrap copper and variations in its quality. High-grade scrap materials, particularly No. 1 copper containing about 99% copper content, are limited because many copper-based products such as electrical infrastructure, construction materials, and industrial equipment have long service lifecycles. According to the International Copper Study Group (ICSG), global refined copper recycling rates are estimated to be around 35%, indicating the difficulty in consistently collecting and processing adequate scrap volumes.
In addition, many scrap batches contain impurities or mixed grades of copper, which can reduce refining efficiency and increase processing costs for recycling facilities. These inconsistencies create operational challenges for secondary smelters and recyclers, often affecting production efficiency and profitability. As a result, manufacturers that depend on a stable copper supply may hesitate to rely entirely on recycled sources, limiting the market’s growth potential in certain industrial applications.
Price Competition from Primary Copper and LME Volatility
Recycled copper producers also face strong competition from primary copper suppliers, particularly during periods when global copper prices decline. Copper prices are largely determined by the London Metal Exchange (LME), and during demand slowdowns, prices have historically fallen below US$5,000 per tonne. When such price drops occur, the cost advantage of recycled copper compared with newly mined copper becomes much smaller.
This reduces the financial incentive for manufacturers and processors to invest in scrap copper procurement and recycling activities. Additionally, recyclers often operate on narrow margins because the difference between scrap acquisition costs and refined copper selling prices can fluctuate significantly. This situation becomes more challenging for processors dealing with lower-grade scrap materials such as light copper scrap or red brass scrap, where additional energy-intensive refining is required. Differences in carbon pricing policies across global markets further complicate operational costs for secondary smelters, creating uncertainty for long-term investments in recycling infrastructure.
Opportunity - Expanding E-Waste Recycling as a High-Yield Source Channel Opportunity
The rapid growth of consumer electronics, telecommunications equipment, and industrial electronic systems is creating large volumes of electronic waste, which represents one of the richest secondary sources of copper. According to the Global E-Waste Monitor 2024 published by the United Nations Institute for Training and Research (UNITAR) and the International Telecommunication Union (ITU), global e-waste generation reached approximately 62 million tonnes in 2023. However, only about 22.3% of this waste was formally collected and recycled. Electronic waste contains valuable copper-rich components such as printed circuit boards, transformer windings, and electric motor coils, which can achieve purity levels of up to 96% after proper processing.
This presents a significant opportunity for recycling companies investing in advanced hydrometallurgical and pyrometallurgical technologies designed for e-waste recovery. Furthermore, increasing implementation of Extended Producer Responsibility (EPR) regulations and manufacturer take-back programs is expected to improve formal collection rates, creating a reliable and high-value supply stream for recycled copper producers.
Solar Decommissioning and EV Scrap as Emerging Source Growth Channels
Solar power systems and electric vehicle components are emerging as important future sources of recycled copper, creating a significant growth opportunity for market participants. The International Renewable Energy Agency (IRENA) projects that global installed solar photovoltaic capacity will exceed 5,457 gigawatts by 2030. As the earliest solar installations reach the end of their operational lifespan, large volumes of copper-containing panels, inverters, and electrical systems will enter the recycling stream. This upcoming wave of solar equipment decommissioning is expected to generate millions of tonnes of recyclable copper materials.
At the same time, the global electric vehicle fleet is expanding rapidly, and aging EVs will eventually produce copper-rich scrap from battery systems, high-voltage cables, charging components, and electric drivetrains. Policy developments such as the European Battery Regulation 2023/1542 are already requiring minimum recycled material content in battery production. Companies developing specialized collection and recycling capabilities for these emerging sources will likely gain a strong competitive advantage in the coming decade.
Category-wise Analysis
Scrap Grade Insights
Among the various scrap grade segments, No. 1 copper scrap, which contains approximately 99% copper, holds the dominant share of market revenue at around 38%. The Institute of Scrap Recycling Industries defines this grade as unalloyed and uncoated copper materials such as wires, pipes, and cables that can be directly re-melted without requiring additional refining processes. Because of its high purity level and minimal contamination, No. 1 scrap is considered one of the most cost-efficient raw materials for copper wire rod manufacturers and high-conductivity cable producers.
Its compatibility with modern continuous casting technologies makes it particularly valuable for electrical and electronics applications that require reliable conductivity and quality standards. According to the European Copper Institute, more than 60% of the copper scrap used in European wire rod production comes from No. 1 grade materials. This strong reliance highlights the critical role this scrap category plays in maintaining stable global secondary copper supply chains.
Source Insights
Within the source segmentation of recycled copper, unalloyed wires represent the leading contributor, accounting for roughly 30% of total recycled copper volumes globally. Copper wire scrap is generated in large quantities from activities such as building demolitions, power grid modernization, telecommunications infrastructure upgrades, and industrial plant decommissioning. These activities are expanding rapidly as countries invest heavily in electrification and energy transition programs.
Unalloyed wire scrap typically retains a copper purity level exceeding 98%, which means it requires minimal preprocessing before it can be re-melted in secondary smelters. This characteristic significantly lowers refining costs and improves operational margins for recycling companies. According to the World Bureau of Metal Statistics, wire-based scrap consistently accounts for the largest single source category in global copper scrap trade. Continued investments in power grid modernization across North America, Europe, and Asia Pacific are expected to further strengthen the supply of wire-based scrap in the coming years.
End-user Insights
The Electrical and Electronics sector represents the largest end-use segment for recycled copper, accounting for approximately 36% of total market demand. Copper remains an essential material in electrical applications because of its exceptional electrical conductivity, which is approximately 59.6 × 10 S/m, making it difficult to replace with alternative metals. Recycled copper is widely used in power cables, motor windings, busbars, printed circuit boards, and switchgear components across the electronics industry. Growing global investments in smart grid modernization, 5G telecommunications infrastructure, hyperscale data centers, and energy-efficient appliances are significantly increasing demand for copper-based components.
According to the International Electrotechnical Commission, smart grid systems require substantial copper content due to advanced energy metering equipment, distribution automation technologies, and grid-edge computing hardware. Additionally, regulations such as the EU Ecodesign standards are encouraging manufacturers to adopt high-efficiency electrical components, which further increases copper consumption across various electronic products.
Regional Insights
North America Recycled Copper Market Trends
The United States plays a central role in the North American recycled copper market, supported by one of the most advanced scrap collection systems in the world and strong industrial demand from multiple sectors. According to the United States Geological Survey, the country recovers nearly 800,000 metric tonnes of secondary copper annually, which is supplied to wire rod mills, brass foundries, and specialty alloy manufacturers. Government initiatives such as the United States Environmental Protection Agency National Recycling Strategy are helping improve scrap collection rates across electronics, automotive, and construction industries.
Canada also contributes significantly to regional supply through the decommissioning of older energy infrastructure. Additionally, the United States-Mexico-Canada Agreement facilitates cross-border scrap trade, enabling efficient supply chain management across North America. Increasing adoption of AI-based scrap sorting technologies and advanced continuous casting processes is improving material recovery rates and strengthening the competitiveness of North American recycled copper producers in global markets.
Europe Recycled Copper Market Trends
Europe represents one of the most advanced recycled copper markets globally, driven by strong environmental regulations and ambitious industrial decarbonization targets. Germany leads the region in secondary copper processing capacity, with companies such as Aurubis AG operating large multi-metal recycling facilities capable of handling complex copper-containing scrap streams. The EU Critical Raw Materials Act, introduced in 2024, identifies copper as a strategic material, encouraging member states to expand domestic recycling capabilities.
Countries including France and Spain are increasingly investing in urban mining initiatives to reduce dependence on imported copper concentrates. Meanwhile, the United Kingdom continues to follow many EU recycling standards even after Brexit. According to the British Metals Recycling Association, the country processes more than 400,000 tonnes of non-ferrous metal scrap each year. Efforts to harmonize scrap quality standards under the End-of-Waste Criteria for Copper are also improving trade efficiency and price transparency across European recycling markets.
Asia Pacific Recycled Copper Market Trends
Asia Pacific is the fastest-growing regional market for recycled copper, primarily driven by strong industrial demand and rapid infrastructure expansion. China dominates the region as the world's largest copper consumer, accounting for more than 50% of global demand. The country’s “Dual Carbon” strategy aims to peak carbon emissions before 2030 and achieve carbon neutrality by 2060, creating strong policy support for non-ferrous metal recycling.
Government agencies such as the National Development and Reform Commission have introduced new quality standards and tax incentives for certified secondary copper processors. Meanwhile, India is experiencing growing demand for recycled copper due to its expanding electric mobility initiatives and renewable energy capacity targets. Japan also plays a significant role through advanced urban mining technologies developed by companies like DOWA Holdings and JX Advanced Metals. Additionally, emerging economies such as Vietnam, Thailand, and Indonesia are developing rapidly growing scrap processing industries supported by expanding electronics manufacturing sectors.
Competitive Landscape
The global recycled copper market is moderately fragmented, consisting of a mix of large multinational recycling companies, regional scrap processors, and specialized secondary smelters operating across different geographic regions. Market leaders mainly compete by strengthening their scrap procurement networks, improving metallurgical processing capabilities, and maintaining close relationships with industrial scrap generators. Strategic mergers and acquisitions remain a common growth strategy, allowing companies to consolidate scrap collection networks and secure a stable feedstock supply.
Research and development efforts are increasingly focused on improving sensor-based sorting technologies, artificial intelligence-driven contamination detection, and advanced hydrometallurgical refining methods. These innovations help recyclers economically process lower-grade scrap materials while improving recovery efficiency. Sustainability certifications, carbon footprint reporting, and verified recycled content traceability are also becoming important competitive advantages as manufacturers increasingly demand transparent and environmentally responsible sourcing practices to meet their environmental, social, and governance commitments.
Key Market Developments
- In January 2025, Nucor Corporation announced the expansion of copper scrap processing capabilities at its Marion, Ohio facility to strengthen secondary copper rod production capacity. The initiative aims to support growing U.S. demand driven by grid modernization programs and electric vehicle charging infrastructure expansion, which require reliable recycled copper supply for electrical components and transmission systems.
- In March 2024: Sims Metal Management formed a strategic partnership with an Australian e-waste recycling firm to increase copper recovery from discarded electronic equipment across the Asia Pacific region. The collaboration focuses on advanced sorting and recycling technologies to improve copper extraction efficiency and support sustainable metal supply chains.
- In September 2023: European Metal Recycling Ltd. (EMR) commissioned a modern copper granulation and recycling facility in the United Kingdom to expand its processing capacity and improve copper recovery quality. The plant uses advanced separation and refining technologies to produce higher-purity recycled copper meeting strict industry standards.
Companies Covered in Recycled Copper Market
- Sims Metal Management
- Nucor Corporation
- Commercial Metals Company (CMC)
- European Metal Recycling Ltd. (EMR)
- Schnitzer Steel Industries, Inc.
- David J. Joseph Company (DJJ)
- Recycling Group
- OmniSource Corporation
- Ferrous Processing & Trading
- Metalico, Inc.
- KWS Environmental
- SA Recycling, LLC
- BHS (Babcock & Wilcox)
- Recycled Metal Solutions, Inc.
- J.P. Morgan Chase & Co.
- Aurubis AG
- DOWA Holdings
- JX Advanced Metals
- Umicore N.V.
- Stena Recycling International
Frequently Asked Questions
The global Recycled Copper Market is valued at US$ 51.9 Billion in 2026 and is projected to reach US$ 105.1 Billion by 2033, advancing at a CAGR of 10.6% through the forecast period. The market recorded a historical CAGR of 8.8% between 2020 and 2025, reflecting its consistent long-term growth trajectory.
The foremost demand drivers include the global renewable energy transition, rapid EV adoption, and binding circular economy regulations. Recycled copper consumes up to 85% less energy than primary extraction, as recognized by the EPA, while the IEA projects sustained copper demand growth from solar, wind, and grid modernization programs through 2030 and beyond.
No. 1 copper scrap (99% Cu content) is the dominant grade segment, holding approximately 38% of total market revenues. Its high purity, suitability for direct re-melting, and widespread adoption in electrical wire rod production, with over 60% of European wire rod mills relying on this grade per European Copper Institute data, solidify its market leadership position.
Asia Pacific is the leading regional market, with China alone accounting for over 50% of global copper consumption. Supported by the "Dual Carbon" strategy, NDRC recycling guidelines, and large-scale EV and renewable energy deployments across the region, Asia Pacific sustains both the highest volume demand and the fastest growth rate globally.
Scaling formal e-waste recycling infrastructure represents the most compelling opportunity. With global e-waste generation reaching approximately 62 million tonnes in 2023 and only 22.3% formally processed, as reported by UNITAR and the ITU, there exists a vast untapped feedstock reservoir of high-purity secondary copper accessible through advanced hydrometallurgical processing and strengthened EPR regulatory frameworks.
Key market participants include Sims Metal Management, Nucor Corporation, Commercial Metals Company (CMC), European Metal Recycling Ltd. (EMR), Schnitzer Steel Industries, Inc., Aurubis AG, David J. Joseph Company (DJJ), OmniSource Corporation, SA Recycling, LLC, DOWA Holdings, JX Advanced Metals, Umicore N.V., and Stena Recycling International, among other regional and specialty processors.


