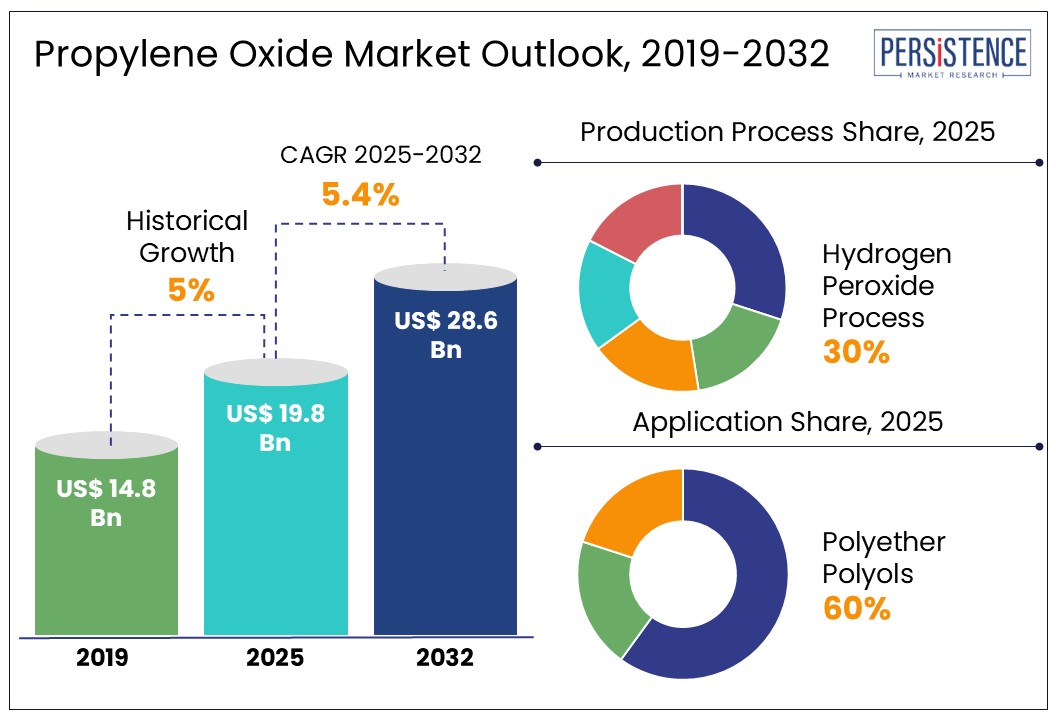
Propylene Oxide Market

Market Study on Propylene Oxide: Polyether Polyols to Remain Key End Use Over Decade

Propylene Oxide Market by Application (Polyether Polyols, Propylene Glycols, Propylene Glycol Ethers, and Others)

- Table of Content -

1. Executive Summary

    1.1. Global Market Outlook

    1.2. Demand Side Trends

    1.3. Supply Side Trends

    1.4. Technology Roadmap

    1.5. Analysis and Recommendations

2. Market Overview

    2.1. Market Coverage / Taxonomy

    2.2. Market Definition / Scope / Limitations

3. Key Market Trends

    3.1. Key Trends Impacting the Market

    3.2. Product Innovation / Development Trends

4. Key Success Factors

    4.1. Product Adoption / Usage Analysis

    4.2. Product USPs / Features

    4.3. Strategic Promotional Strategies

5. Global Market Demand Analysis 2017-2022 and Forecast, 2023-2033

    5.1. Historical Market Volume (Kilo Tons) Analysis, 2017-2022

    5.2. Current and Future Market Volume (Kilo Tons) Projections, 2023-2033

    5.3. Y-o-Y Growth Trend Analysis

6. Global Market - Pricing Analysis

    6.1. Regional Pricing Analysis By Applications

    6.2. Pricing Break-up

        6.2.1. Manufacturer Level Pricing

        6.2.2. Distributor Level Pricing

    6.3. Global Average Pricing Analysis Benchmark

7. Global Market Demand (in Value or Size in US$ Mn) Analysis 2017-2022 and Forecast, 2023-2033

    7.1. Historical Market Value (US$ Mn) Analysis, 2017-2022

    7.2. Current and Future Market Value (US$ Mn) Projections, 2023-2033

        7.2.1. Y-o-Y Growth Trend Analysis

        7.2.2. Absolute $ Opportunity Analysis

8. Market Background

    8.1. Macro-Economic Factors

        8.1.1. Global GDP Growth Outlook

        8.1.2. Parent Market Overview

        8.1.3. Global Automotive Industry Overview

        8.1.4. Global Construction Industry Overview

        8.1.5. Global Healthcare Market Growth Overview

        8.1.6. Global Manufacturing Value-Added Overview

        8.1.7. Other Forecast Factors

    8.2. Forecast Factors - Relevance & Impact

        8.2.1. Top Companies Historical Growth

        8.2.2. GDP Growth forecast

        8.2.3. Regulatory Impact Outlook

        8.2.4. Application Sectors Growth Outlook

        8.2.5. Covid-19 Impact Assessment

        8.2.6. Other Key Forecast Factors

    8.3. Value Chain

        8.3.1. Product Manufacturers

        8.3.2. Distributors

        8.3.3. Probable End Users

        8.3.4. Average Margins

    8.4. COVID-19 Crisis - Impact Assessment

        8.4.1. Current Statistics

        8.4.2. Short-Mid-Long Term Outlook

        8.4.3. Likely Rebound

    8.5. Market Dynamics

        8.5.1. Drivers

        8.5.2. Restraints

        8.5.3. Opportunity Analysis

    8.6. Global Supply Demand Analysis

    8.7. Key Applicable Regulations

9. Global Market Analysis 2017-2022 and Forecast 2023-2033, by Application

    9.1. Introduction / Key Findings

    9.2. Historical Market Size (US$ Mn) and Volume Analysis By Application, 2017-2022

    9.3. Current and Future Market Size (US$ Mn) and Volume Analysis and Forecast By Application, 2023-2033

        9.3.1. Polyether Polyols

        9.3.2. Propylene Glycols

        9.3.3. Propylene Glycol Ethers

        9.3.4. Others

            9.3.4.1. Flame Retardants

            9.3.4.2. Fumigants

            9.3.4.3. Textile Surfactants

            9.3.4.4. Modified Starch

    9.4. Market Attractiveness Analysis By Application

10. Global Market Analysis 2017-2022 and Forecast 2023-2033, by Region

    10.1. Introduction

    10.2. Historical Market Size (US$ Mn) and Volume Analysis By Region, 2017-2022

    10.3. Current Market Size (US$ Mn) and Volume Analysis and Forecast By Region, 2023-2033

        10.3.1. North America

        10.3.2. Latin America

        10.3.3. Europe

        10.3.4. Middle East and Africa (MEA)

        10.3.5. East Asia

        10.3.6. South Asia and Pacific

    10.4. Market Attractiveness Analysis By Region

11. North America Market Analysis 2017-2022 and Forecast 2023-2033

    11.1. Introduction

    11.2. Pricing Analysis

    11.3. Historical Market Size (US$ Mn) and Volume Trend Analysis By Market Taxonomy, 2017-2022

    11.4. Market Size (US$ Mn) and Volume Forecast By Market Taxonomy, 2023-2033

        11.4.1. By Country

            11.4.1.1. U.S.

            11.4.1.2. Canada

        11.4.2. By Application

    11.5. Market Attractiveness Analysis

        11.5.1. By Country

        11.5.2. By Application

    11.6. Market Trends

    11.7. Key Market Participants - Intensity Mapping

    11.8. Drivers and Restraints - Impact Analysis

12. Latin America Market Analysis 2017-2022 and Forecast 2023-2033

    12.1. Introduction

    12.2. Pricing Analysis

    12.3. Historical Market Size (US$ Mn) and Volume Trend Analysis By Market Taxonomy, 2017-2022

    12.4. Market Size (US$ Mn) and Volume Forecast By Market Taxonomy, 2023-2033

        12.4.1. By Country

            12.4.1.1. Brazil

            12.4.1.2. Mexico

            12.4.1.3. Rest of Latin America

        12.4.2. By Application

    12.5. Market Attractiveness Analysis

        12.5.1. By Country

        12.5.2. By Application

    12.6. Market Trends

    12.7. Key Market Participants - Intensity Mapping

    12.8. Drivers and Restraints - Impact Analysis

13. Europe Market Analysis 2017-2022 and Forecast 2023-2033

    13.1. Introduction

    13.2. Pricing Analysis

    13.3. Historical Market Size (US$ Mn) and Volume Trend Analysis By Market Taxonomy, 2017-2022

    13.4. Market Size (US$ Mn) and Volume Forecast By Market Taxonomy, 2023-2033

        13.4.1. By Country

            13.4.1.1. Germany

            13.4.1.2. Italy

            13.4.1.3. France

            13.4.1.4. U.K.

            13.4.1.5. Spain

            13.4.1.6. BENELUX

            13.4.1.7. Russia

            13.4.1.8. Rest of Europe

        13.4.2. By Application

    13.5. Market Attractiveness Analysis

        13.5.1. By Country

        13.5.2. By Application

    13.6. Market Trends

    13.7. Key Market Participants - Intensity Mapping

    13.8. Drivers and Restraints - Impact Analysis

14. South Asia and Pacific Market Analysis 2017-2022 and Forecast 2023-2033

    14.1. Introduction

    14.2. Pricing Analysis

    14.3. Historical Market Size (US$ Mn) and Volume Trend Analysis By Market Taxonomy, 2017-2022

    14.4. Market Size (US$ Mn) and Volume Forecast By Market Taxonomy, 2023-2033

        14.4.1. By Country

            14.4.1.1. India

            14.4.1.2. ASEAN

            14.4.1.3. ANZ

            14.4.1.4. Rest of South Asia & Pacific

        14.4.2. By Application

    14.5. Market Attractiveness Analysis

        14.5.1. By Country

        14.5.2. By Application

    14.6. Market Trends

    14.7. Key Market Participants - Intensity Mapping

    14.8. Drivers and Restraints - Impact Analysis

15. East Asia Market Analysis 2017-2022 and Forecast 2023-2033

    15.1. Introduction

    15.2. Pricing Analysis

    15.3. Historical Market Size (US$ Mn) and Volume Trend Analysis By Market Taxonomy, 2017-2022

    15.4. Market Size (US$ Mn) and Volume Forecast By Market Taxonomy, 2023-2033

        15.4.1. By Country

            15.4.1.1. China

            15.4.1.2. Japan

            15.4.1.3. South Korea

        15.4.2. By Application

    15.5. Market Attractiveness Analysis

        15.5.1. By Country

        15.5.2. By Application

    15.6. Market Trends

    15.7. Key Market Participants - Intensity Mapping

    15.8. Drivers and Restraints - Impact Analysis

16. Middle East and Africa Market Analysis 2017-2022 and Forecast 2023-2033

    16.1. Introduction

    16.2. Pricing Analysis

    16.3. Historical Market Size (US$ Mn) and Volume Trend Analysis By Market Taxonomy, 2017-2022

    16.4. Market Size (US$ Mn) and Volume Forecast By Market Taxonomy, 2023-2033

        16.4.1. By Country

            16.4.1.1. GCC Countries

            16.4.1.2. Turkey

            16.4.1.3. Northern Africa

            16.4.1.4. South Africa

            16.4.1.5. Rest of Middle East and Africa

        16.4.2. By Application

    16.5. Market Attractiveness Analysis

        16.5.1. By Country

        16.5.2. By Application

    16.6. Market Trends

    16.7. Key Market Participants - Intensity Mapping

    16.8. Drivers and Restraints - Impact Analysis

17. Country Wise Market Analysis 2023-2033

    17.1. Introduction

        17.1.1. Market Value Proportion Analysis, By Key Countries

        17.1.2. Global Vs. Country Growth Comparison

    17.2. U.S. Market Analysis

        17.2.1. By Application

    17.3. Canada Market Analysis

        17.3.1. By Application

    17.4. Mexico Market Analysis

        17.4.1. By Application

    17.5. Brazil Market Analysis

        17.5.1. By Application

    17.6. Germany Market Analysis

        17.6.1. By Application

    17.7. Italy Market Analysis

        17.7.1. By Application

    17.8. France Market Analysis

        17.8.1. By Application

    17.9. U.K. Market Analysis

        17.9.1. By Application

    17.10. Spain Market Analysis

        17.10.1. By Application

    17.11. Russia Market Analysis

        17.11.1. By Application

    17.12. China Market Analysis

        17.12.1. By Application

    17.13. Japan Market Analysis

        17.13.1. By Application

    17.14. S. Korea Market Analysis

        17.14.1. By Application

    17.15. India Market Analysis

        17.15.1. By Application

    17.16. ASEAN Market Analysis

        17.16.1. By Application

    17.17. Australia and New Zealand Market Analysis

        17.17.1. By Application

    17.18. Turkey Market Analysis

        17.18.1. By Application

    17.19. South Africa Market Analysis

        17.19.1. By Application

18. Market Structure Analysis

    18.1. Market Analysis by Tier of Companies (Propylene Oxide)

    18.2. Market Concentration

    18.3. Market Share Analysis of Top Players

    18.4. Production Capacity Analysis

    18.5. Market Presence Analysis

        18.5.1. By Technologies Footprint of Players

        18.5.2. By Regional Footprint of Players

        18.5.3. By Channel Footprint of Players

19. Competition Analysis

    19.1. Competition Dashboard

    19.2. Competition Benchmarking

    19.3. Competition Deep Dive

        19.3.1. LyondellBasell Industries Holdings B.V.

            19.3.1.1. Overview

            19.3.1.2. Product Portfolio

            19.3.1.3. Profitability by Market Segments (Product/Channel/Region)

            19.3.1.4. Sales Footprint

            19.3.1.5. Strategy Overview

        19.3.2. The Dow Chemicals

            19.3.2.1. Overview

            19.3.2.2. Product Portfolio

            19.3.2.3. Profitability by Market Segments (Product/Channel/Region)

            19.3.2.4. Sales Footprint

            19.3.2.5. Strategy Overview

        19.3.3. SK Chemicals

            19.3.3.1. Overview

            19.3.3.2. Product Portfolio

            19.3.3.3. Profitability by Market Segments (Product/Channel/Region)

            19.3.3.4. Sales Footprint

            19.3.3.5. Strategy Overview

        19.3.4. Royal Dutch Shell

            19.3.4.1. Overview

            19.3.4.2. Product Portfolio

            19.3.4.3. Profitability by Market Segments (Product/Channel/Region)

            19.3.4.4. Sales Footprint

            19.3.4.5. Strategy Overview

        19.3.5. Sumitomo Chemical Co., Ltd.

            19.3.5.1. Overview

            19.3.5.2. Product Portfolio

            19.3.5.3. Profitability by Market Segments (Product/Channel/Region)

            19.3.5.4. Sales Footprint

            19.3.5.5. Strategy Overview

        19.3.6. BASF SE

            19.3.6.1. Overview

            19.3.6.2. Product Portfolio

            19.3.6.3. Profitability by Market Segments (Product/Channel/Region)

            19.3.6.4. Sales Footprint

            19.3.6.5. Strategy Overview

        19.3.7. Huntsman International LLC.

            19.3.7.1. Overview

            19.3.7.2. Product Portfolio

            19.3.7.3. Profitability by Market Segments (Product/Channel/Region)

            19.3.7.4. Sales Footprint

            19.3.7.5. Strategy Overview

        19.3.8. AGC Chemicals

            19.3.8.1. Overview

            19.3.8.2. Product Portfolio

            19.3.8.3. Profitability by Market Segments (Product/Channel/Region)

            19.3.8.4. Sales Footprint

            19.3.8.5. Strategy Overview

        19.3.9. Repsol

            19.3.9.1. Overview

            19.3.9.2. Product Portfolio

            19.3.9.3. Profitability by Market Segments (Product/Channel/Region)

            19.3.9.4. Sales Footprint

            19.3.9.5. Strategy Overview

        19.3.10. CSPC Pharmaceutical Group Limited

            19.3.10.1. Overview

            19.3.10.2. Product Portfolio

            19.3.10.3. Profitability by Market Segments (Product/Channel/Region)

            19.3.10.4. Sales Footprint

            19.3.10.5. Strategy Overview

        19.3.11. Air Liquide

            19.3.11.1. Overview

            19.3.11.2. Product Portfolio

            19.3.11.3. Profitability by Market Segments (Product/Channel/Region)

            19.3.11.4. Sales Footprint

            19.3.11.5. Strategy Overview

        19.3.12. Air Products and Chemicals, Inc.

            19.3.12.1. Overview

            19.3.12.2. Product Portfolio

            19.3.12.3. Profitability by Market Segments (Product/Channel/Region)

            19.3.12.4. Sales Footprint

            19.3.12.5. Strategy Overview

        19.3.13. China Petrochemical Corporation

            19.3.13.1. Overview

            19.3.13.2. Product Portfolio

            19.3.13.3. Profitability by Market Segments (Product/Channel/Region)

            19.3.13.4. Sales Footprint

            19.3.13.5. Strategy Overview

        19.3.14. Eastman Chemical Company

            19.3.14.1. Overview

            19.3.14.2. Product Portfolio

            19.3.14.3. Profitability by Market Segments (Product/Channel/Region)

            19.3.14.4. Sales Footprint

            19.3.14.5. Strategy Overview

        19.3.15. Mitsui Chemicals, Inc.

            19.3.15.1. Overview

            19.3.15.2. Product Portfolio

            19.3.15.3. Profitability by Market Segments (Product/Channel/Region)

            19.3.15.4. Sales Footprint

            19.3.15.5. Strategy Overview

        19.3.16. LOTTE CHEMICAL CORPORATION

            19.3.16.1. Overview

            19.3.16.2. Product Portfolio

            19.3.16.3. Profitability by Market Segments (Product/Channel/Region)

            19.3.16.4. Sales Footprint

            19.3.16.5. Strategy Overview

        19.3.17. PetroChina International Co., Ltd.

            19.3.17.1. Overview

            19.3.17.2. Product Portfolio

            19.3.17.3. Profitability by Market Segments (Product/Channel/Region)

            19.3.17.4. Sales Footprint

            19.3.17.5. Strategy Overview

        19.3.18. Ineos Group Limited

            19.3.18.1. Overview

            19.3.18.2. Product Portfolio

            19.3.18.3. Profitability by Market Segments (Product/Channel/Region)

            19.3.18.4. Sales Footprint

            19.3.18.5. Strategy Overview

        19.3.19. Tokuyama Corporation

            19.3.19.1. Overview

            19.3.19.2. Product Portfolio

            19.3.19.3. Profitability by Market Segments (Product/Channel/Region)

            19.3.19.4. Sales Footprint

            19.3.19.5. Strategy Overview

        19.3.20. Hanwha Group

            19.3.20.1. Overview

            19.3.20.2. Product Portfolio

            19.3.20.3. Profitability by Market Segments (Product/Channel/Region)

            19.3.20.4. Sales Footprint

            19.3.20.5. Strategy Overview

20. Assumptions and Acronyms Used

21. Research Methodology

Sample Report

FREE Report Sample is Available

In-depth report coverage is now just a few seconds away

Download PDF Get FREE Report Sample

- List Of Table -

Table 01: Global Propylene Oxide Market Volume (KT) and Value (US$ Mn) Forecast by Application, 2017-2033

Table 02: Global Propylene Oxide Market Volume (KT) and Value (US$ Mn) Forecast by Region, 2017-2033

Table 03: North America Propylene Oxide Market Volume (KT) and Value (US$ Mn) Forecast by Country, 2017-2033

Table 04: North America Propylene Oxide Market Volume (KT) and Value (US$ Mn) Forecast by Application, 2017-2033

Table 05: Latin America Propylene Oxide Market Volume (KT) and Value (US$ Mn) Forecast by Country, 2017-2033

Table 06: Latin America Propylene Oxide Market Volume (KT) and Value (US$ Mn) Forecast by Application, 2017-2033

Table 07: Europe Propylene Oxide Market Volume (KT) and Value (US$ Mn) Forecast by Country, 2017-2033

Table 08: Europe Propylene Oxide Market Volume (KT) and Value (US$ Mn) Forecast by Application, 2017-2033

Table 09: East Asia Propylene Oxide Market Volume (KT) and Value (US$ Mn) Forecast by Country, 2017-2033

Table 10: East Asia Propylene Oxide Market Volume (KT) and Value (US$ Mn) Forecast by Application, 2017-2033

Table 11: South Asia Pacific Propylene Oxide Market Volume (KT) and Value (US$ Mn) Forecast by Country, 2017-2033

Table 12: South Asia Pacific Propylene Oxide Market Volume (KT) and Value (US$ Mn) Forecast by Application, 2017-2033

Table 13: Middle East & Africa Propylene Oxide Market Volume (KT) and Value (US$ Mn) Forecast by Country, 2017-2033

Table 14: Middle East & Africa Propylene Oxide Market Volume (KT) and Value (US$ Mn) Forecast by Application, 2017-2033

Custom Report Cover

Make This Report Your Own

Take Advantage of Intelligence Tailored to your Business Objective

> Get a Customized Version

- List Of Chart -

Figure 01: Global Historical Market Volume (KT) Analysis, 2017-2022

Figure 02: Global Current and Future Market Volume (KT) Analysis, 2023-2023

Figure 03: Global Propylene Oxide Historical Value (US$ Mn), 2017-2022

Figure 04: Global Propylene Oxide Value (US$ Mn) Forecast, 2023-2033

Figure 05: Global Propylene Oxide Absolute $ Opportunity, 2017 to 2022 and 2033

Figure 06: Global Propylene Oxide Market Share and BPS Analysis by Application, 2023 & 2033

Figure 07: Global Propylene Oxide Market Y-o-Y Growth by Application, 2023-2033

Figure 08: Global Propylene Oxide Market Attractiveness Analysis Application, 2023-2023

Figure 09: Global Propylene Oxide Market Absolute $ Opportunity by Polyether Polyols Segment, 2017-2022 and 2023-2033

Figure 10: Global Propylene Oxide Market Absolute $ Opportunity by Propylene Glycols Segment, 2017-2022 and 2023-2033

Figure 11: Global Propylene Oxide Market Absolute $ Opportunity by Propylene Glycol Ethers Segment, 2017-2033

Figure 12: Global Propylene Oxide Market Absolute $ Opportunity by Others Segment, 2017-2033

Figure 13: Global Propylene Oxide Market, BPS Analysis by Region - 2023 & 2033

Figure 14: Global Propylene Oxide Market, Y-o-Y Analysis by Region, 2017-2033

Figure 15: Global Propylene Oxide Market Attractiveness Analysis Region, 2023-2023

Figure 16: Global Propylene Oxide Market Absolute $ Opportunity by North America, 2017-2022 and 2023-2033

Figure 17: Global Propylene Oxide Market Absolute $ Opportunity by Latin America, 2017-2022 and 2023-2033

Figure 18: Global Propylene Oxide Market Absolute $ Opportunity by Europe Region, 2017-2022 and 2023-2033

Figure 19: Global Propylene Oxide Market Absolute $ Opportunity by East Asia Region, 2017-2022 and 2023-2033

Figure 20: Global Propylene Oxide Market Absolute $ Opportunity by South Asia Pacific Region, 2017-2022 and 2023-2033

Figure 21: Global Propylene Oxide Market Absolute $ Opportunity by Middle East & Africa Region, 2017-2022 and 2023-2033

Figure 22: North America Propylene Oxide Market, BPS Analysis by Country - 2023 & 2033

Figure 23: North America Propylene Oxide Market, Y-o-Y Growth Comparison by Country, 2023-2033

Figure 24: North America Propylene Oxide Market Attractiveness Index by Country, 2023-2033

Figure 25: North America Propylene Oxide Market Share and BPS Analysis by Application, 2023 & 2033

Figure 26: North America Propylene Oxide Market Y-o-Y Growth by Application, 2023-2033

Figure 27: North America Propylene Oxide Market Attractiveness Analysis Application, 2023-2023

Figure 28: Latin America Propylene Oxide Market, BPS Analysis by Country - 2023 & 2033

Figure 29: Latin America Propylene Oxide Market, Y-o-Y Growth Comparison by Country, 2022 - 2032

Figure 30: Latin America Propylene Oxide Market Attractiveness Index by Country, 2023-2033

Figure 31: Latin America Propylene Oxide Market Share and BPS Analysis by Application, 2023 & 2033

Figure 32: Latin America Propylene Oxide Market Y-o-Y Growth by Application, 2023-2033

Figure 33: Latin America Propylene Oxide Market Attractiveness Analysis Application, 2023-2023

Figure 34: Europe Propylene Oxide Market, BPS Analysis by Country - 2023 & 2033

Figure 35: Europe Propylene Oxide Market, Y-o-Y Growth Comparison by Country, 2023-2033

Figure 36: Europe Propylene Oxide Market Attractiveness Index by Country, 2023-2033

Figure 37: Europe Propylene Oxide Market Share and BPS Analysis by Application, 2023 & 2033

Figure 38: Europe Propylene Oxide Market Y-o-Y Growth by Application, 2023-2033

Figure 39: Europe Propylene Oxide Market Attractiveness Analysis Application, 2023-2023

Figure 40: East Asia Propylene Oxide Market, BPS Analysis by Country - 2023 & 2033

Figure 41: East Asia Propylene Oxide Market, Y-o-Y Growth Comparison by Country, 2023-2033

Figure 42: East Asia Propylene Oxide Market Attractiveness Index by Country, 2023-2033

Figure 43: East Asia Propylene Oxide Market Share and BPS Analysis by Application, 2023 & 2033

Figure 44: East Asia Propylene Oxide Market Y-o-Y Growth by Application, 2023-2033

Figure 45: East Asia Propylene Oxide Market Attractiveness Analysis Application, 2023-2023

Figure 46: South Asia Pacific Propylene Oxide Market, BPS Analysis by Country - 2023 & 2033

Figure 47: South Asia Pacific Propylene Oxide Market, Y-o-Y Growth Comparison by Country, 2023-2033

Figure 48: South Asia Pacific Propylene Oxide Market Attractiveness Index by Country, 2023-2033

Figure 49: South Asia Pacific Propylene Oxide Market Share and BPS Analysis by Application, 2023 & 2033

Figure 50: South Asia Pacific Propylene Oxide Market Y-o-Y Growth by Application, 2023-2033

Figure 51: South Asia Pacific Propylene Oxide Market Attractiveness Analysis Application, 2023-2023

Figure 52: Middle East & Africa Propylene Oxide Market, BPS Analysis by Country - 2023 & 2033

Figure 53: Middle East & Africa Propylene Oxide Market, Y-o-Y Growth Comparison by Country, 2023-2033

Figure 54: Middle East & Africa Propylene Oxide Market Attractiveness Index by Country,

Figure 55: Middle East & Africa Propylene Oxide Market Share and BPS Analysis by Application, 2023 & 2033

Figure 56: Middle East & Africa Propylene Oxide Market Y-o-Y Growth by Application, 2023-2033

Figure 57: Middle East & Africa Propylene Oxide Market Attractiveness Analysis Application, 2023-2023

This site uses cookies, including third-party cookies, that help us to provide and improve our services. Privacy Policy
Google translate