

- Executive Summary
- Global Power Quality Equipment Market Snapshot 2025 and 2032
- Market Opportunity Assessment, 2025-2032, US$ Bn
- Key Market Trends
- Industry Developments and Key Market Events
- Demand Side and Supply-Side Analysis
- PMR Analysis and Recommendations
- Market Overview
- Market Scope and Definitions
- Value Chain Analysis
- Macro-Economic Factors
- Global GDP Outlook
- Global Construction Industry Overview
- Global Industries Overview
- Forecast Factors - Relevance and Impact
- COVID-19 Impact Assessment
- PESTLE Analysis
- Porter's Five Forces Analysis
- Geopolitical Tensions: Market Impact
- Regulatory and Technology Landscape
- Market Dynamics
- Drivers
- Restraints
- Opportunities
- Trends
- Price Trend Analysis, 2019 - 2032
- Region-wise Price Analysis
- Price by Segments
- Price Impact Factors
- Global Power Quality Equipment Market Outlook: Historical (2019 - 2024) and Forecast (2025 - 2032)
- Key Highlights
- Global Power Quality Equipment Market Outlook: Equipment
- Introduction/Key Findings
- Historical Market Size (US$ Bn) and Volume (Units) Analysis by Equipment, 2019-2024
- Current Market Size (US$ Bn) and Volume (Units) Forecast, by Equipment, 2025-2032
- Power Quality Meters
- Surge Protection Devices
- Harmonic Filters
- Voltage Regulators
- Uninterruptable Power Supply (UPS)
- Market Attractiveness Analysis: Equipment
- Global Power Quality Equipment Market Outlook: Phase
- Introduction/Key Findings
- Historical Market Size (US$ Bn) and Volume (Units) Analysis by Phase, 2019-2024
- Current Market Size (US$ Bn) and Volume (Units) Forecast, by Phase, 2025-2032
- Single Phase
- Three Phase
- Market Attractiveness Analysis: Phase
- Global Power Quality Equipment Market Outlook: End-user
- Introduction/Key Findings
- Historical Market Size (US$ Bn) and Volume (Units) Analysis by End-user, 2019-2024
- Current Market Size (US$ Bn) and Volume (Units) Forecast, by End-user, 2025-2032
- Residential
- Commercial
- Industrial & Manufacturing
- Utilities
- Transportation
- Market Attractiveness Analysis: End-user
- Global Power Quality Equipment Market Outlook: Region
- Key Highlights
- Historical Market Size (US$ Bn) and Volume (Units) Analysis by Region, 2019-2024
- Current Market Size (US$ Bn) and Volume (Units) Forecast, by Region, 2025-2032
- North America
- Europe
- East Asia
- South Asia & Oceania
- Latin America
- Middle East & Africa
- Market Attractiveness Analysis: Region
- North America Power Quality Equipment Market Outlook: Historical (2019 - 2024) and Forecast (2025 - 2032)
- Key Highlights
- Pricing Analysis
- North America Market Size (US$ Bn) and Volume (Units) Forecast, by Country, 2025-2032
- U.S.
- Canada
- North America Market Size (US$ Bn) and Volume (Units) Forecast, by Equipment, 2025-2032
- Power Quality Meters
- Surge Protection Devices
- Harmonic Filters
- Voltage Regulators
- Uninterruptable Power Supply (UPS)
- North America Market Size (US$ Bn) and Volume (Units) Forecast, by Phase, 2025-2032
- Single Phase
- Three Phase
- North America Market Size (US$ Bn) and Volume (Units) Forecast, by End-user, 2025-2032
- Residential
- Commercial
- Industrial & Manufacturing
- Utilities
- Transportation
- Europe Power Quality Equipment Market Outlook: Historical (2019 - 2024) and Forecast (2025 - 2032)
- Key Highlights
- Pricing Analysis
- Europe Market Size (US$ Bn) and Volume (Units) Forecast, by Country, 2025-2032
- Germany
- Italy
- France
- U.K.
- Spain
- Russia
- Rest of Europe
- Europe Market Size (US$ Bn) and Volume (Units) Forecast, by Equipment, 2025-2032
- Power Quality Meters
- Surge Protection Devices
- Harmonic Filters
- Voltage Regulators
- Uninterruptable Power Supply (UPS)
- Europe Market Size (US$ Bn) and Volume (Units) Forecast, by Phase, 2025-2032
- Single Phase
- Three Phase
- Europe Market Size (US$ Bn) and Volume (Units) Forecast, by End-user, 2025-2032
- Residential
- Commercial
- Industrial & Manufacturing
- Utilities
- Transportation
- East Asia Power Quality Equipment Market Outlook: Historical (2019 - 2024) and Forecast (2025 - 2032)
- Key Highlights
- Pricing Analysis
- East Asia Market Size (US$ Bn) and Volume (Units) Forecast, by Country, 2025-2032
- China
- Japan
- South Korea
- East Asia Market Size (US$ Bn) and Volume (Units) Forecast, by Equipment, 2025-2032
- Power Quality Meters
- Surge Protection Devices
- Harmonic Filters
- Voltage Regulators
- Uninterruptable Power Supply (UPS)
- East Asia Market Size (US$ Bn) and Volume (Units) Forecast, by Phase, 2025-2032
- Single Phase
- Three Phase
- East Asia Market Size (US$ Bn) and Volume (Units) Forecast, by End-user, 2025-2032
- Residential
- Commercial
- Industrial & Manufacturing
- Utilities
- Transportation
- South Asia & Oceania Power Quality Equipment Market Outlook: Historical (2019 - 2024) and Forecast (2025 - 2032)
- Key Highlights
- Pricing Analysis
- South Asia & Oceania Market Size (US$ Bn) and Volume (Units) Forecast, by Country, 2025-2032
- India
- Southeast Asia
- ANZ
- Rest of SAO
- South Asia & Oceania Market Size (US$ Bn) and Volume (Units) Forecast, by Equipment, 2025-2032
- Power Quality Meters
- Surge Protection Devices
- Harmonic Filters
- Voltage Regulators
- Uninterruptable Power Supply (UPS)
- South Asia & Oceania Market Size (US$ Bn) and Volume (Units) Forecast, by Phase, 2025-2032
- Single Phase
- Three Phase
- South Asia & Oceania Market Size (US$ Bn) and Volume (Units) Forecast, by End-user, 2025-2032
- Residential
- Commercial
- Industrial & Manufacturing
- Utilities
- Transportation
- Latin America Power Quality Equipment Market Outlook: Historical (2019 - 2024) and Forecast (2025 - 2032)
- Key Highlights
- Pricing Analysis
- Latin America Market Size (US$ Bn) and Volume (Units) Forecast, by Country, 2025-2032
- Brazil
- Mexico
- Rest of LATAM
- Latin America Market Size (US$ Bn) and Volume (Units) Forecast, by Equipment, 2025-2032
- Power Quality Meters
- Surge Protection Devices
- Harmonic Filters
- Voltage Regulators
- Uninterruptable Power Supply (UPS)
- Latin America Market Size (US$ Bn) and Volume (Units) Forecast, by Phase, 2025-2032
- Single Phase
- Three Phase
- Latin America Market Size (US$ Bn) and Volume (Units) Forecast, by End-user, 2025-2032
- Residential
- Commercial
- Industrial & Manufacturing
- Utilities
- Transportation
- Middle East & Africa Power Quality Equipment Market Outlook: Historical (2019 - 2024) and Forecast (2025 - 2032)
- Key Highlights
- Pricing Analysis
- Middle East & Africa Market Size (US$ Bn) and Volume (Units) Forecast, by Country, 2025-2032
- GCC Countries
- South Africa
- Northern Africa
- Rest of MEA
- Middle East & Africa Market Size (US$ Bn) and Volume (Units) Forecast, by Equipment, 2025-2032
- Power Quality Meters
- Surge Protection Devices
- Harmonic Filters
- Voltage Regulators
- Uninterruptable Power Supply (UPS)
- Middle East & Africa Market Size (US$ Bn) and Volume (Units) Forecast, by Phase, 2025-2032
- Single Phase
- Three Phase
- Middle East & Africa Market Size (US$ Bn) and Volume (Units) Forecast, by End-user, 2025-2032
- Residential
- Commercial
- Industrial & Manufacturing
- Utilities
- Transportation
- Competition Landscape
- Market Share Analysis, 2024
- Market Structure
- Competition Intensity Mapping
- Competition Dashboard
- Company Profiles
- Eaton Corporation
- Company Overview
- Product Portfolio/Offerings
- Key Financials
- SWOT Analysis
- Company Strategy and Key Developments
- ABB Ltd.
- Siemens
- General Electric Company
- Honeywell International, Inc.
- Leviton Manufacturing Co., Inc.
- Emerson Electric Co.
- Schneider Electric S.E.
- Legrand
- Piller Power Systems
- Eaton Corporation
- Appendix
- Research Methodology
- Research Assumptions
- Acronyms and Abbreviations


- Power Generation, Transmission, & Distribution
- Power Quality Equipment Market
Power Quality Equipment Market Size, Share, and Growth Forecast for 2025 - 2032
Power Quality Equipment Market By Equipment (Power Quality Meters, Surge Protection Devices, Harmonic Filters, Others), Phase (Single Phase and Three Phase), End-user (Residential, Commercial, Others, and Regional Analysis for 2025 - 2032
Power Quality Equipment Market Size and Trends Analysis
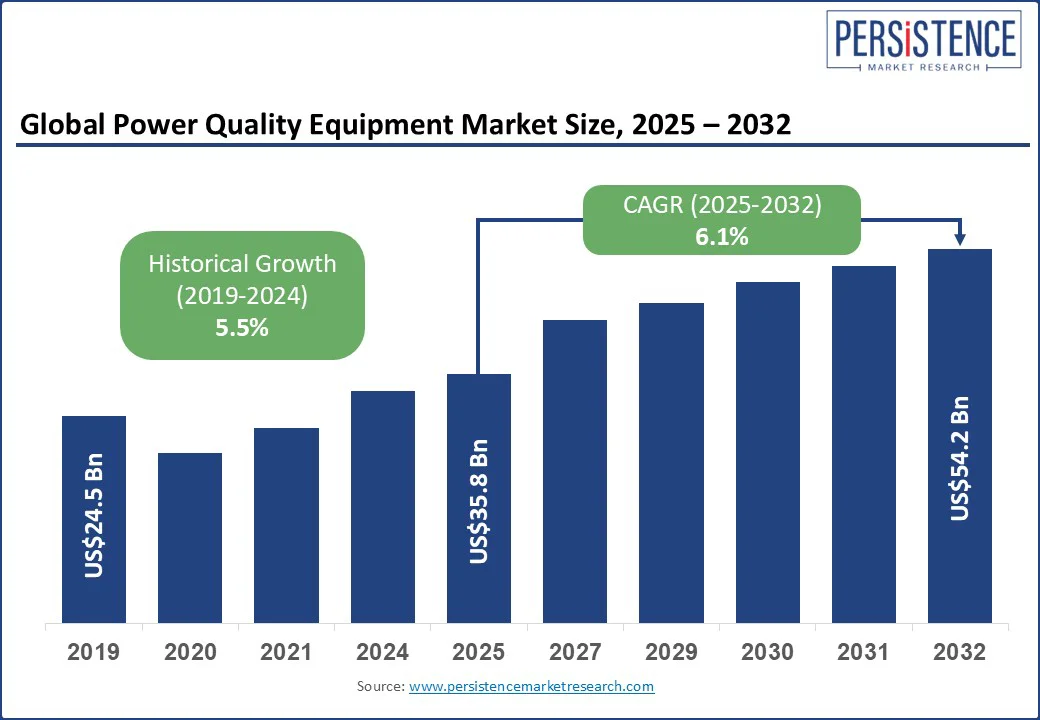
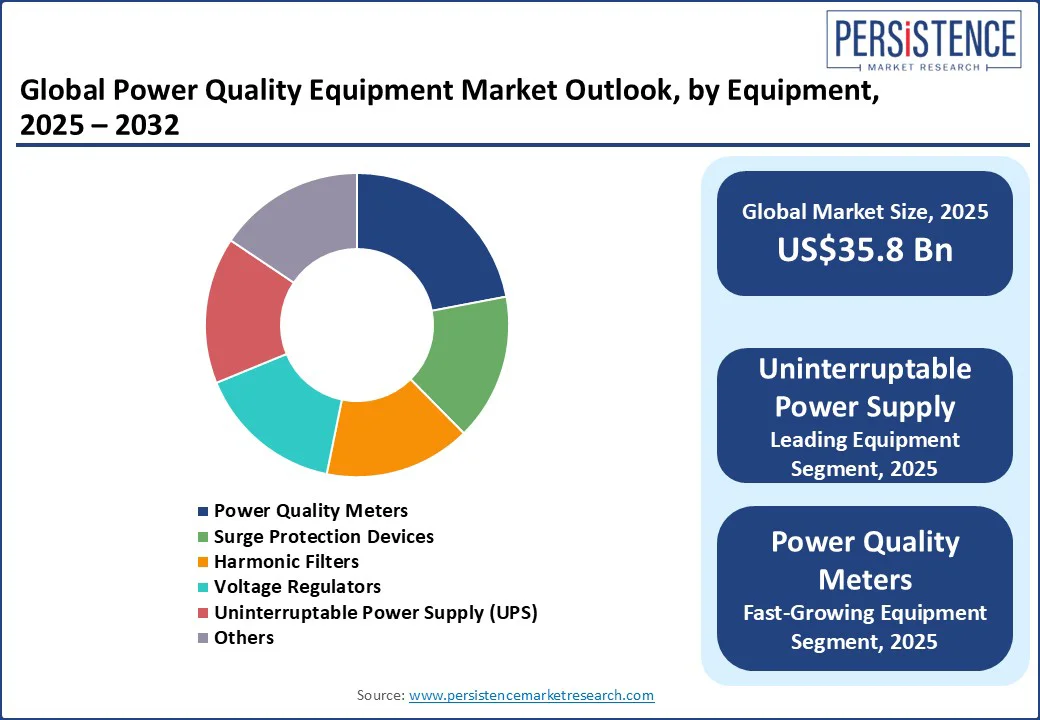
The global power quality equipment market size is likely to value at US$35.8 Bn in 2025 to US$54.2 Bn by 2032 growing at a CAGR of 6.1% during the forecast period from 2025 to 2032.
The rising demand for reliable and efficient power across industrial, commercial, and residential sectors drives the growth of the power quality equipment market.
Key growth factors include accelerating grid modernization, fast-paced industrialization, and the growing integration of renewable energy sources. Followed by the stringent power quality regulations aimed at minimizing disturbances and enhancing energy efficiency, this is driving the adoption of advanced power quality solutions. Developing regions face frequent power outages and voltage fluctuations, emphasizing the need for reliable power infrastructure.
The widespread use of sensitive electronic devices, which require consistent and high-quality power to operate effectively, is boosting market demand. Technological advancements are also playing a vital role, especially the incorporation of Internet of Things (IoT) capabilities. IoT integration enables real-time monitoring, predictive maintenance, and rapid response to power issues, significantly reducing downtime and operational costs while improving the overall power system performance.
Key Industry Highlights
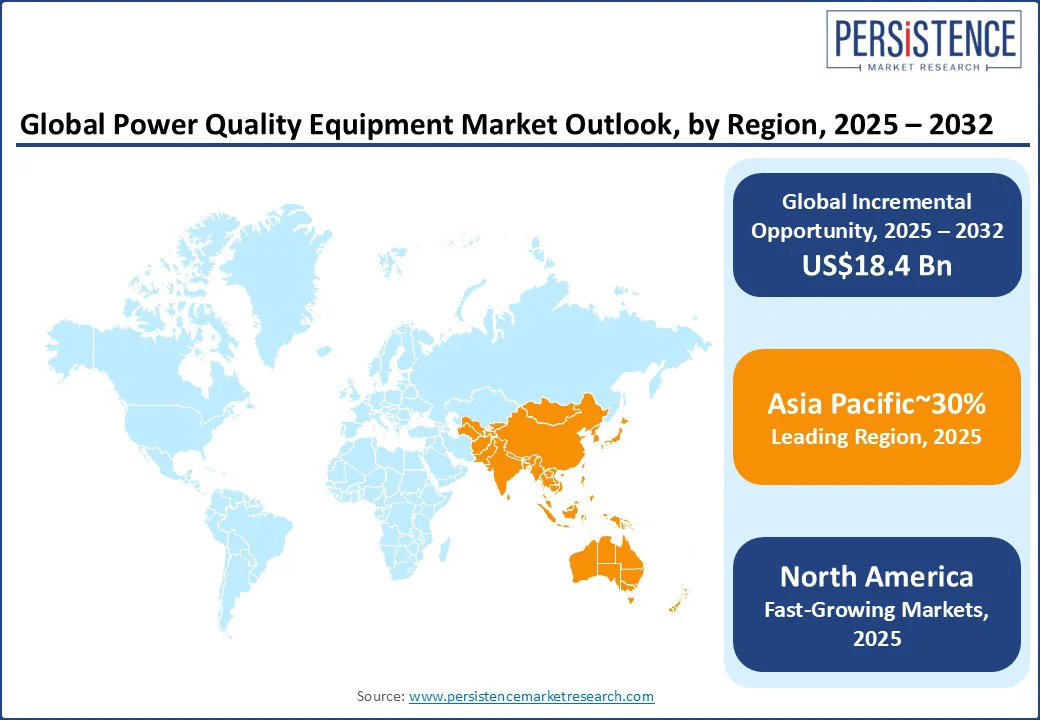
- Leading Region: Asia Pacific is expected to dominate with a market share of 30% in 2025, driven by rapid industrialization, urban growth, and the need for reliable electricity.
- Fastest-growing Region: North America is projected to be the fastest-growing region, driven by advanced infrastructure, a high concentration of manufacturing industries, and strong regulatory support.
- Dominant Equipment Type: The UPS segment held the largest market share of 27.2% in 2025, owing to its widespread use in guaranteeing a continuous power supply.
- Leading End-user: The industrial and manufacturing segment is projected to account for 35.6% in 2025, driven by rapid industrialization, increased automation, and stringent power quality regulations.
|
Global Market Attribute |
Key Insights |
|
Power Quality Equipment Market Size (2025E) |
US$35.8 Bn |
|
Market Value Forecast (2032F) |
US$54.2 Bn |
|
Projected Growth (CAGR 2025 to 2032) |
6.1% |
|
Historical Market Growth (CAGR 2019 to 2024) |
5.5% |
Market Dynamics
Driver - Growing Demand for Uninterrupted Power Supply
The global demand for fault-free power supply is rising significantly, due to the growing reliance on uninterrupted electricity in critical sectors such as IT & telecom, manufacturing, healthcare, and data centers. These industries require high-quality power to maintain continuous operations, avoid costly downtime, and ensure optimal productivity.
Any disruption, including voltage fluctuations or unexpected shutdowns, can lead to revenue loss, compromised safety, and operational inefficiencies. As a result, organizations are increasingly investing in advanced power quality equipment such as uninterruptible power supply (UPS) systems, voltage regulators, power conditioners, and harmonic filters to mitigate the risks of power disturbances.
According to the International Energy Agency (IEA), global investments in data centers have surged over the past two years, largely driven by growing digitalization and rapid adoption of artificial intelligence (AI). The U.S. leads this trend, with data center construction investments doubling, while countries including China and members of the European Union are also witnessing substantial growth. The IT and telecom sectors remain one of the largest users of power quality solutions.
Restraint - Limited Awareness Among End-users
Limited awareness among end-users remains a significant barrier to market growth. Despite the increasing availability of advanced solutions, many potential users, particularly in small- and medium-sized enterprises, lack sufficient awareness of the importance and benefits of maintaining high power quality. This knowledge gap often results in the underutilization of technologies such as voltage regulators, UPS systems, harmonic filters, and power conditioners.
Many businesses may not realize how poor power quality can lead to equipment damage, unplanned downtime, higher energy costs, and decreased operational efficiency. As a result, they may delay or completely overlook investments in power quality solutions, even when they are crucial to long-term reliability and cost savings. Rising awareness through educational initiatives, technical training, and targeted marketing will be essential to unlocking the full market potential and encouraging broader adoption of power quality technologies across diverse end-use industries.
Opportunity - Incorporating Renewable Energy Sources with Power Grids
Power quality plays a critical role in the successful integration of renewable energy into the power grid. One of the primary challenges is the voltage and frequency fluctuations caused by the inherently variable nature of renewable sources such as wind and solar.
These sources are intermittent and unpredictable, which requires additional measures to ensure grid stability and maintain a consistent balance between energy generation and consumption.
Addressing supply-side variability is essential, and power quality equipment becomes vital in this context. Tools that enhance grid flexibility are necessary to balance generation levels with demand in real time.
Another significant issue arises from harmonics introduced by power electronic devices commonly used in renewable energy systems. If not properly managed, these harmonics can cause equipment malfunctions or trigger system tripping. Implementing solutions to balance electrical loads and mitigate harmonic disturbances creates significant growth opportunities for the power quality equipment market, particularly as renewable energy adoption continues to accelerate globally.
Category-wise Analysis
Equipment Insights
The UPS segment held the largest market share of 27.2% in 2025, owing to its widespread use in guaranteeing a continuous power supply. The segment growth is further propelled by the growing demand for UPS in data centers, hospitals, and other critical infrastructure requiring an uninterrupted power supply.
The surge protection devices segment is expected to grow rapidly during the forecast period. Surge protection devices are essential for protecting electrical systems from voltage spikes. The segment is expected to grow due to the rising need to safeguard electronic devices in homes and workplaces. In addition, rising awareness about the protection of sensitive electronic equipment and increasing instances of voltage surges due to lightning and power outages are expected to fuel the segment growth.
End-user Insights
The industrial and manufacturing segment is projected to account for 35.6% in 2025, driven by rapid industrialization, increased automation, and stringent power quality regulations. As industries increasingly adopt advanced technologies such as IoT and automated systems, the need for stable and reliable power becomes critical to avoid equipment damage, operational downtime, and production losses. Substantial investments in industrial infrastructure and growing emphasis on power efficiency in manufacturing are boosting demand for power quality solutions.
The commercial segment is also expected to witness significant growth during the forecast period. This is largely driven by the rising demand for consistent and high-quality power in commercial facilities such as offices, retail centers, and data centers. As businesses become more dependent on digital infrastructure and automated systems, ensuring an uninterrupted power supply is essential for maintaining operational continuity and protecting sensitive electronic equipment.
Regional Insights
Asia Pacific Power Quality Equipment Market Trends - Growth Driven by Industrial Expansion and Power Infrastructure Needs
Asia Pacific is expected to lead the power quality equipment market, driven by rapid industrialization, urban growth, and the need for reliable electricity. Several countries in the region, such as Malaysia, Cambodia, and the Philippines, experience frequent power outages and inconsistent supply, making power quality solutions essential. The region’s expanding industrial, telecom, and commercial sectors are key consumers of this equipment.
China, as a global manufacturing hub, plays a major role, while countries including Vietnam, Malaysia, and Singapore are also poised for significant growth. Initiatives such as India’s “Make in India” and the Production Linked Incentive (PLI) schemes are boosting domestic manufacturing, with projections estimating the sector could exceed US$1 Tn by 2025. Likewise, South Korea plans to invest US$ 451 Bn in semiconductor manufacturing over the next decade.
North America Power Quality Equipment Market Trends - Dominant and Backed by Smart Grids, EV Growth, and Industrial Demand
North America is projected to be the fastest-growing region in the power quality equipment market, driven by advanced infrastructure, a high concentration of manufacturing industries, and strong regulatory support. The region is witnessing substantial investments in smart grid technologies, which are accelerating the adoption of power quality solutions. The U.S. leads the market, with ongoing initiatives to improve energy efficiency and system reliability. Additionally, the rapid growth of electric vehicles (EVs) presents new power quality challenges, increasing demand for specialized equipment.
According to the International Energy Agency (IEA), EVs on North American roads are expected to surge from 2.1 million in 2020 to over 20 million by 2030. Currently, North America contributes over 21% of total market revenue, reflecting strong demand from both industrial and commercial sectors. Rising awareness of the importance of a stable and clean power supply to protect sensitive equipment and ensure efficient operations continues to drive sustained market growth in the region.
Europe Power Quality Equipment Market - Emerging Key Growth Region Backed by Sustainability Goals and Grid Modernization
Europe is poised to become a rapidly expanding market for power quality equipment, driven by stringent energy efficiency standards and a strong focus on sustainability. The European Union’s initiatives to lower carbon emissions are encouraging increased investments in advanced power quality technologies. Leading countries such as Germany and France are actively modernizing their aging electrical infrastructure, while the U.K. is contributing to market growth through heightened awareness of power quality issues among end-users.
Europe’s ambitious renewable energy targets are a major growth catalyst. The intermittent nature of renewable sources such as wind and solar requires stable and high-quality power systems. According to Eurostat, the EU’s share of renewable energy in gross final energy consumption reached 22.1% in 2020, which is projected to reach 32% by 2030. These developments are expected to significantly boost the demand for power quality solutions across the region.
Competitive Landscape
The global power quality equipment market is highly competitive, with intense rivalry among key players aiming to strengthen their market position. Leading companies such as Schneider Electric, Eaton Corporation, and ABB hold a dominant share, supported by their broad product portfolios, technological expertise, and strong global distribution networks.
Emerging players are making their mark by focusing on specialized segments and offering innovative, cost-effective solutions. These companies often capitalize on agility and niche expertise to gain traction in the market.
Strategic initiatives, such as partnerships, mergers, and acquisitions, are commonly employed by both established and new entrants to expand their market footprint and enhance their product offerings. As demand for reliable and efficient power quality solutions continues to rise, the competition is driving continuous innovation.
Key Industry Developments:
- In September 2024, Siemens announced its agreement to acquire California-based Trayer Engineering Corporation (Trayer), a leader in the design and manufacturing of medium voltage secondary distribution switchgear suitable for outdoor and below-ground applications.
- In December 2024, ABB India announced that it had signed an agreement to acquire the power electronics business of Gamesa Electric in Spain, a subsidiary of Siemens Gamesa. This strengthened ABB’s position in the rapidly growing market for high-powered renewable power conversion technology.
Companies Covered in Power Quality Equipment Market
- Eaton Corporation
- ABB Ltd.
- Siemens
- General Electric Company
- Honeywell International, Inc.
- Leviton Manufacturing Co., Inc.
- Emerson Electric Co.
- Schneider Electric S.E.
- Legrand
- Piller Power Systems
Frequently Asked Questions
The power quality equipment market is set to reach US$ 35.8 Bn in 2025.
Increasing demand for reliable and uninterrupted power supply & growth in renewable energy integration are the major growth drivers.
The power quality equipment market is estimated to grow at a CAGR of 6.1% through 2032.
Growing EV infrastructure, electrified transportation, and increasing construction of data centers are the key market opportunities.
Eaton Corporation, ABB Ltd., Siemens, General Electric Company, and Honeywell International, Inc. are the key market players.


