


- Executive Summary
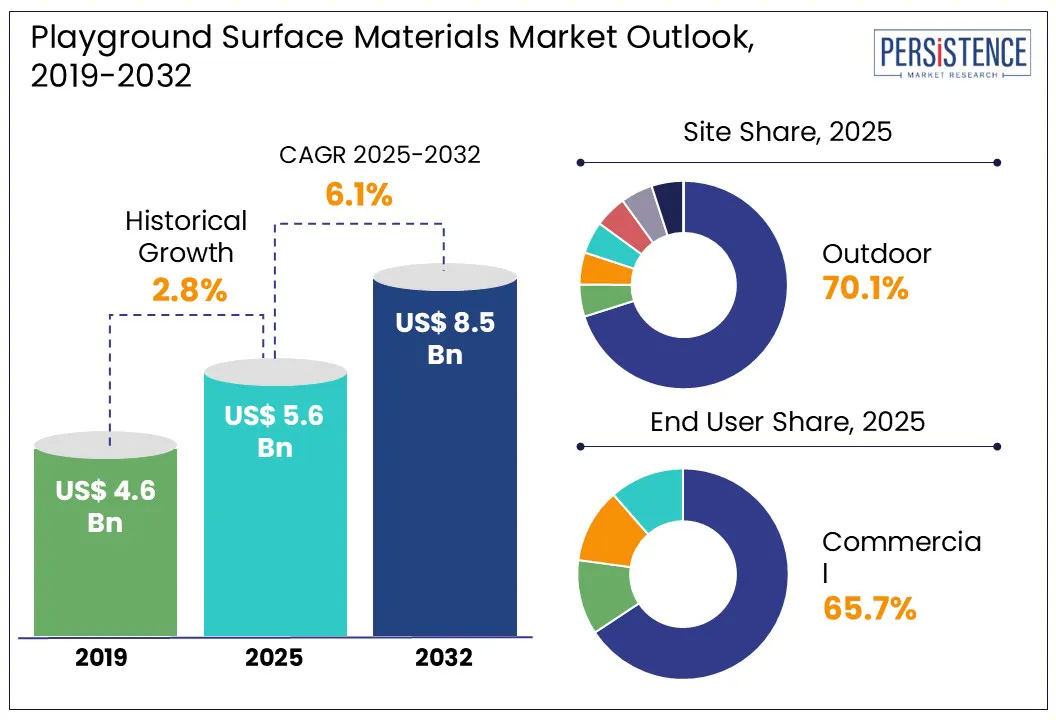
- Global Playground Surface Materials Market Snapshot 2025 and 2032
- Market Opportunity Assessment, 2025-2032, US$ Mn
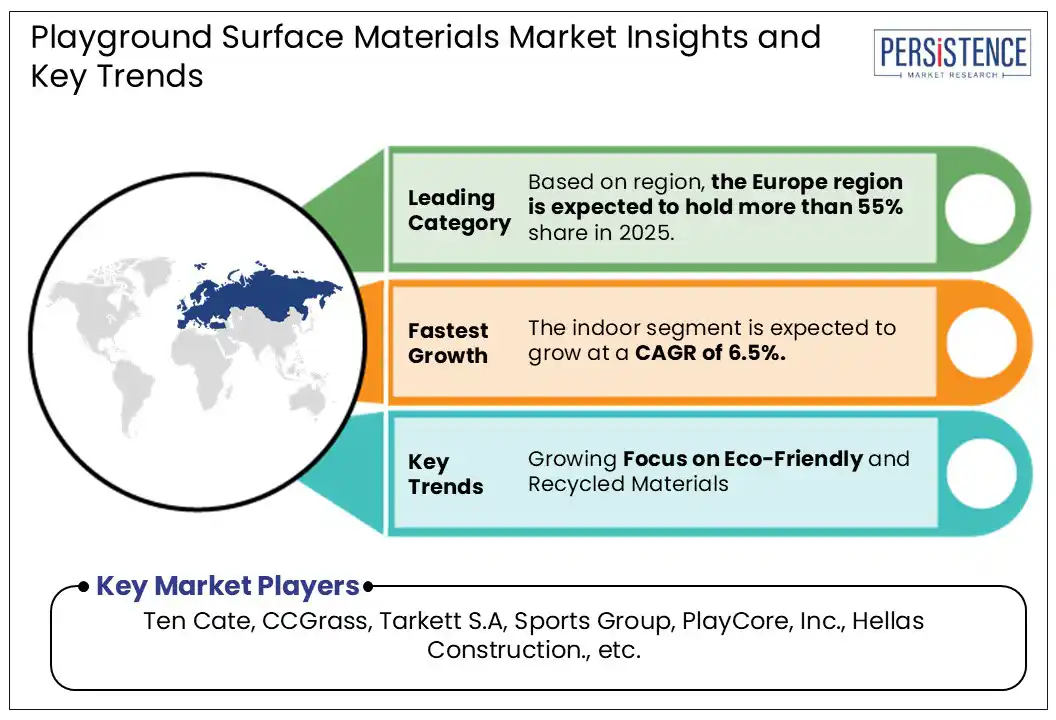
- Key Market Trends
- Industry Developments and Key Market Events
- Demand Side and Supply Side Analysis
- PMR Analysis and Recommendations
- Market Overview
- Market Scope and Definitions
- Value Chain Analysis
- Macro-Economic Factors
- Global GDP Outlook
- Overview of Public Investment in Recreational Infrastructure by Region
- Real Estate Development Trends by Region
- Global Public Infrastructure and Urban Developments Overview
- Forecast Factors – Relevance and Impact
- COVID-19 Impact Assessment
- PESTLE Analysis
- Porter's Five Forces Analysis
- Geopolitical Tensions: Market Impact
- Regulatory and Technology Landscape
- Market Dynamics
- Drivers
- Restraints
- Opportunities
- Trends
- Price Trend Analysis, 2019 – 2032
- Region-wise Price Analysis
- Price by Segments
- Price Impact Factors
- Global Playground Surface Materials Market Outlook:
- Key Highlights
- Global Playground Surface Materials Market Outlook: Material Type
- Introduction/Key Findings
- Historical Market Size (US$ Mn) Analysis by Material Type, 2019-2024
- Current Market Size (US$ Mn) Analysis and Forecast, by Material Type, 2025-2032
- Artificial Turf
- Rubber
- EPDM
- PU
- Rubber Mulch
- Sand
- Pea Gravel
- Engineered Wood Fiber
- Asphalt
- Concrete
- Market Attractiveness Analysis: Material Type
- Global Playground Surface Materials Market Outlook: Site
- Introduction/Key Findings
- Historical Market Size (US$ Mn) Analysis by Site, 2019-2024
- Current Market Size (US$ Mn) Analysis and Forecast, by Site, 2025-2032
- Indoor
- Outdoor
- Market Attractiveness Analysis: Site
- Global Playground Surface Materials Market Outlook: End User
- Introduction/Key Findings
- Historical Market Size (US$ Mn) Analysis by End User, 2019-2024
- Current Market Size (US$ Mn) Analysis and Forecast, by End User, 2025-2032
- Residential
- Commercial
- Public
- Other
- Market Attractiveness Analysis: End User
- Global Playground Surface Materials Market Outlook: Region
- Key Highlights
- Historical Market Size (US$ Mn) Analysis by Region, 2019-2024
- Current Market Size (US$ Mn) Analysis and Forecast, by Region, 2025-2032
- North America
- Europe
- East Asia
- South Asia & Oceania
- Latin America
- Middle East & Africa
- Market Attractiveness Analysis: Region
- North America Playground Surface Materials Market Outlook:
- Key Highlights
- Pricing Analysis
- North America Market Size (US$ Mn) Analysis and Forecast, by Country, 2025-2032
- U.S.
- Canada
- North America Market Size (US$ Mn) Analysis and Forecast, by Material Type, 2025-2032
- Artificial Turf
- Rubber
- EPDM
- PU
- Rubber Mulch
- Sand
- Pea Gravel
- Engineered Wood Fiber
- Asphalt
- Concrete
- North America Market Size (US$ Mn) Analysis and Forecast, by Site, 2025-2032
- Indoor
- Outdoor
- North America Market Size (US$ Mn) Analysis and Forecast, by End User, 2025-2032
- Residential
- Commercial
- Public
- Other
- Europe Playground Surface Materials Market Outlook:
- Key Highlights
- Pricing Analysis
- Europe Market Size (US$ Mn) Analysis and Forecast, by Country, 2025-2032
- Germany
- Italy
- France
- U.K.
- Spain
- Russia
- Rest of Europe
- Europe Market Size (US$ Mn) Analysis and Forecast, by Material Type, 2025-2032
- Artificial Turf
- Rubber
- EPDM
- PU
- Rubber Mulch
- Sand
- Pea Gravel
- Engineered Wood Fiber
- Asphalt
- Concrete
- Europe Market Size (US$ Mn) Analysis and Forecast, by Site, 2025-2032
- Indoor
- Outdoor
- Europe Market Size (US$ Mn) Analysis and Forecast, by End User, 2025-2032
- Residential
- Commercial
- Public
- Other
- East Asia Playground Surface Materials Market Outlook:
- Key Highlights
- Pricing Analysis
- East Asia Market Size (US$ Mn) Analysis and Forecast, by Country, 2025-2032
- China
- Japan
- South Korea
- East Asia Market Size (US$ Mn) Analysis and Forecast, by Material Type, 2025-2032
- Artificial Turf
- Rubber
- EPDM
- PU
- Rubber Mulch
- Sand
- Pea Gravel
- Engineered Wood Fiber
- Asphalt
- Concrete
- East Asia Market Size (US$ Mn) Analysis and Forecast, by Site, 2025-2032
- Indoor
- Outdoor
- East Asia Market Size (US$ Mn) Analysis and Forecast, by End User, 2025-2032
- Residential
- Commercial
- Public
- Other
- South Asia & Oceania Playground Surface Materials Market Outlook:
- Key Highlights
- Pricing Analysis
- South Asia & Oceania Market Size (US$ Mn) Analysis and Forecast, by Country, 2025-2032
- India
- Southeast Asia
- ANZ
- Rest of SAO
- South Asia & Oceania Market Size (US$ Mn) Analysis and Forecast, by Material Type, 2025-2032
- Artificial Turf
- Rubber
- EPDM
- PU
- Rubber Mulch
- Sand
- Pea Gravel
- Engineered Wood Fiber
- Asphalt
- Concrete
- South Asia & Oceania Market Size (US$ Mn) Analysis and Forecast, by Site, 2025-2032
- Indoor
- Outdoor
- South Asia & Oceania Market Size (US$ Mn) Analysis and Forecast, by End User, 2025-2032
- Residential
- Commercial
- Public
- Other
- Latin America Playground Surface Materials Market Outlook:
- Key Highlights
- Pricing Analysis
- Latin America Market Size (US$ Mn) Analysis and Forecast, by Country, 2025-2032
- Brazil
- Mexico
- Rest of LATAM
- Latin America Market Size (US$ Mn) Analysis and Forecast, by Material Type, 2025-2032
- Artificial Turf
- Rubber
- EPDM
- PU
- Rubber Mulch
- Sand
- Pea Gravel
- Engineered Wood Fiber
- Asphalt
- Concrete
- Latin America Market Size (US$ Mn) Analysis and Forecast, by Site, 2025-2032
- Indoor
- Outdoor
- Latin America Market Size (US$ Mn) Analysis and Forecast, by End User, 2025-2032
- Residential
- Commercial
- Public
- Other
- Middle East & Africa Playground Surface Materials Market Outlook:
- Key Highlights
- Pricing Analysis
- Middle East & Africa Market Size (US$ Mn) Analysis and Forecast, by Country, 2025-2032
- GCC Countries
- South Africa
- Northern Africa
- Rest of MEA
- Middle East & Africa Market Size (US$ Mn) Analysis and Forecast, by Material Type, 2025-2032
- Artificial Turf
- Rubber
- EPDM
- PU
- Rubber Mulch
- Sand
- Pea Gravel
- Engineered Wood Fiber
- Asphalt
- Concrete
- Middle East & Africa Market Size (US$ Mn) Analysis and Forecast, by Site, 2025-2032
- Indoor
- Outdoor
- Middle East & Africa Market Size (US$ Mn) Analysis and Forecast, by End User, 2025-2032
- Residential
- Commercial
- Public
- Other
- Competition Landscape
- Market Share Analysis, 2024
- Market Structure
- Competition Intensity Mapping
- Competition Dashboard
- Company Profiles
- Ten Cate
- Company Overview
- Product Portfolio/Offerings
- Key Financials
- SWOT Analysis
- Company Strategy and Key Developments
- CCGrass
- Tarkett S.A
- Sports Group
- PlayCore, Inc.
- Hellas Construction
- Tarmac
- Domo Sports Grass
- All Victory Grass (Guangzhou) Co., Ltd.
- Carlisle Polyurethane Systems (Accella Polyurethane Systems)
- Zeager Bros. Inc.
- The Fibar Group LLC (Nice S.p.A.)
- Polytan GmbH
- Surface America, Inc.
- LTR Products LLC (GroundSmart®)
- Ten Cate
- Appendix
- Research Methodology
- Research Assumptions
- Acronyms and Abbreviations

Loading page data
Please wait a moment


