


- Specialty & Fine Chemicals
- Platinum Group Metals Market
Platinum Group Metals Market Size, Share, and Growth Forecast 2026 - 2033
Platinum Group Metals Market by Metal Type (Platinum, Palladium, Rhodium, Iridium, Other), Application (Catalytic Converters, Electricals & Electronics, Fuel Cells, Jewelry, Glass, Ceramics & Pigments, Other), Source (Mining, Recycling), Industry (Automotive, Electronics & Semiconductor, Chemical, Energy, Jewelry, Healthcare, Other), and Regional Analysis for 2026 - 2033
Platinum Group Metals Market Size and Trend Analysis
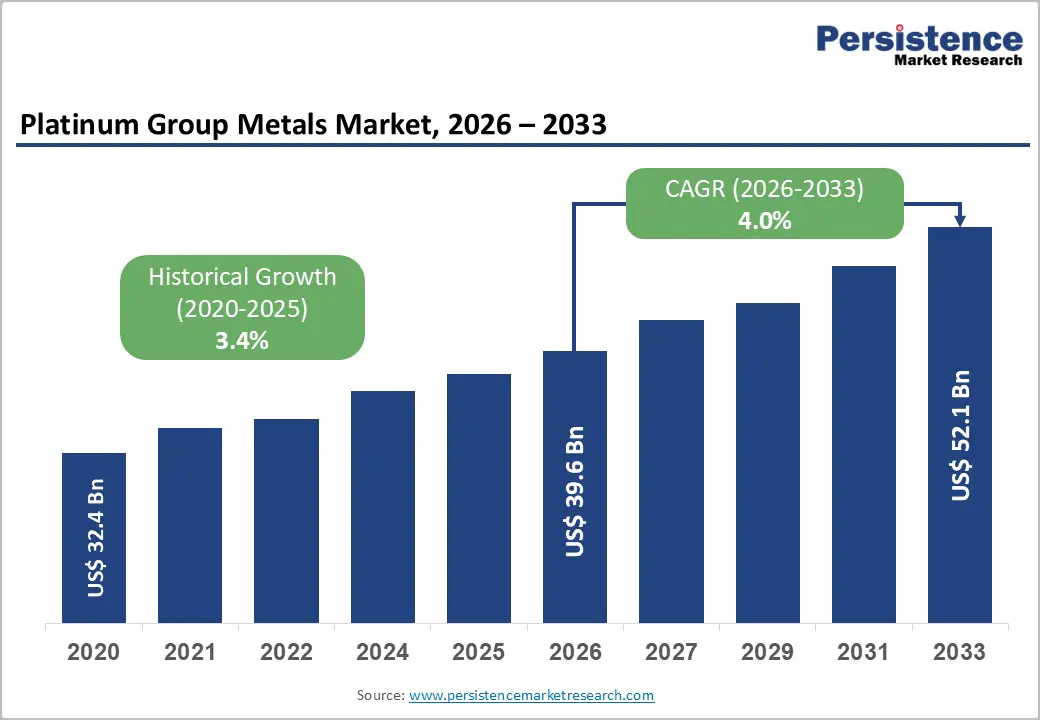
The global Platinum Group Metals market size is supposed to be valued at US$ 39.6 Bn in 2026 and is projected to reach US$ 52.1 Bn by 2033, growing at a CAGR of 4.0% between 2026 and 2033.
This sustained expansion is primarily driven by growing global demand for emission-reduction technologies, especially catalytic converters in internal combustion engines and hybrid vehicles, combined with an accelerating shift toward green hydrogen infrastructure, where platinum serves as an indispensable catalyst in proton exchange membrane electrolyzers. Tightening regulatory frameworks such as Euro 7 and China VI-b emission standards are compelling automakers to increase PGM loadings per vehicle, while government-backed hydrogen programs in the U.S. (underpinned by the Inflation Reduction Act), Canada, and Europe are opening structurally new demand avenues, reinforcing the long-term growth trajectory of the market.
Key Industry Highlights:
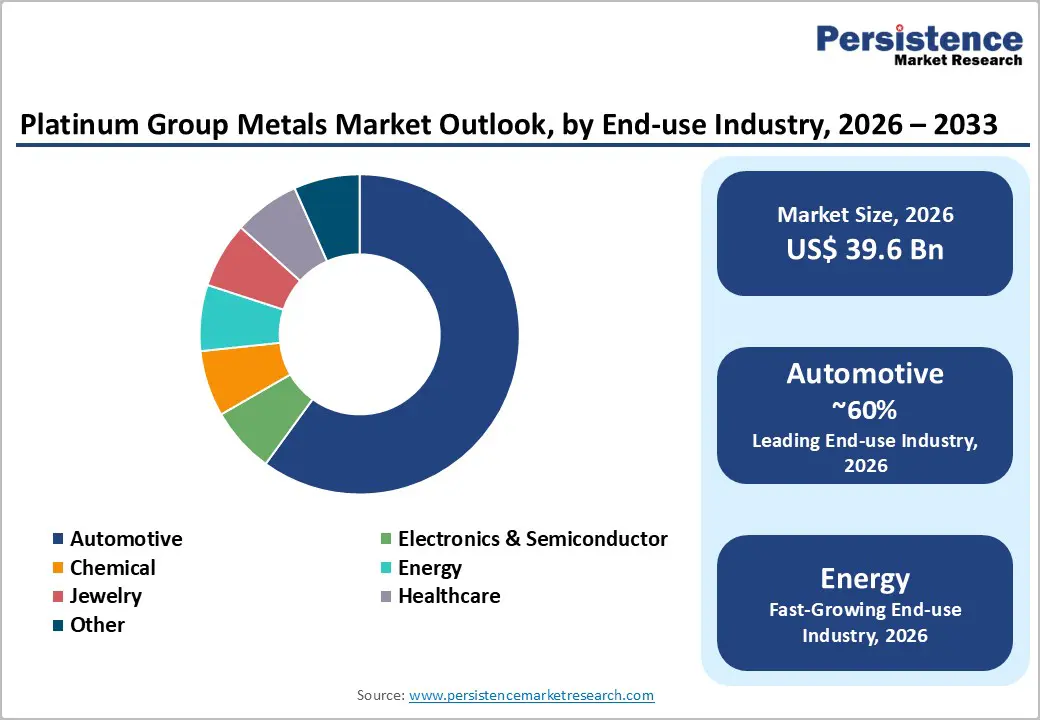
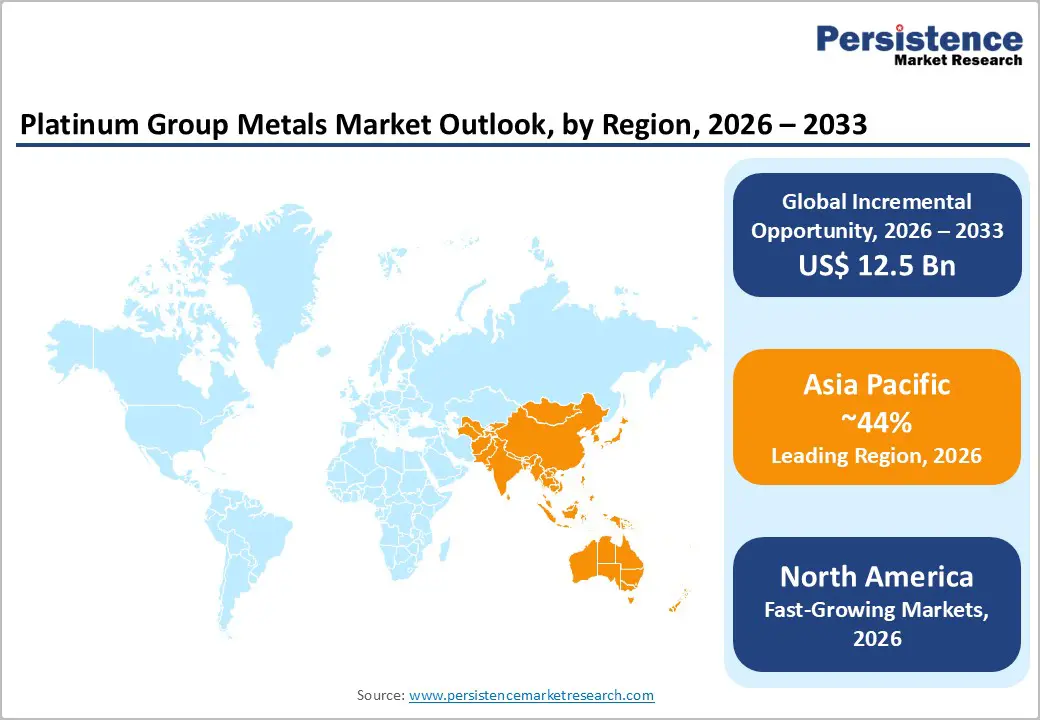
- Leading Region: Asia Pacific dominates the Platinum Group Metals market with approximately 44% of global consumption, driven by China's massive automotive fleet, advanced electronics manufacturing, and growing hydrogen fuel cell investment in Japan and South Korea.
- Fastest Growing Region: North America is the fastest-growing regional market, propelled by the U.S. Inflation Reduction Act, Canada's 40% clean-hydrogen tax credit, and accelerating domestic demand for PGM-intensive hydrogen electrolyzers and catalytic converter recycling infrastructure.
- Dominant Segment: Catalytic Converters lead the Application segment with 27% market share, as increasingly stringent global emission regulations, Euro 7, China VI-b, and U.S. Tier 3, continue to sustain robust PGM loading requirements across automotive powertrains.
- Fastest Growing Segment: Renewable Energy and Hydrogen (Energy end-use) is the fastest-growing segment, projected to expand at a 9.50% CAGR through 2030, with the World Platinum Investment Council estimating hydrogen applications could absorb 11% of annual platinum demand by 2030.
- Key Market Opportunity: The scale-up of PGM recycling from spent catalytic converters and electronic waste, already representing 60% of annual supply, offers companies a sustainable, ESG-aligned, and cost-competitive growth avenue as circular economy regulations tighten globally.
| Key Insights | Details |
|---|---|
|
Platinum Group Metals Market Size (2026E) |
US$ 39.6 Bn |
|
Market Value Forecast (2033F) |
US$ 52.1 Bn |
|
Projected Growth CAGR (2026–2033) |
4.0% |
|
Historical Market Growth (2020–2025) |
3.4% |
Market Dynamics
Drivers - Stringent Emission Regulations Fueling Autocatalyst Demand
One of the principal and enduring drivers of the Platinum Group Metals (PGM) market is the continual tightening of global vehicle emission regulations. Standards such as Euro-7 in Europe, China-VI-b, and Bharat Stage-VI (BS-VI) in India mandate reductions exceeding 95% in carbon monoxide, hydrocarbons, and nitrogen oxides compared with pre-regulation levels, targets achieved primarily through three-way catalytic converters that rely on platinum, palladium, and rhodium.
The U.S. Environmental Protection Agency has consistently emphasized the critical role of catalytic converters in significantly decreasing harmful vehicular emissions nationwide. Additionally, the rising adoption of hybrid electric vehicles, which require 10–15% more PGMs than conventional petrol vehicles, alongside projected platinum autocatalyst demand reaching an eight-year high of 3.24-million-oz in 2025, reinforces the sustained importance of this regulatory driver.
Accelerating Adoption of Hydrogen Fuel Cell Technologies
The global transition toward a hydrogen-based economy constitutes a significant long-term driver for Platinum Group Metals (PGMs), particularly platinum and iridium. Platinum functions as an essential catalyst in proton exchange membrane (PEM) electrolyzers and fuel cells, enabling highly efficient oxygen reduction reactions. According to the International Energy Agency, PEM technologies are expected to support substantial growth in platinum demand across the hydrogen production and heavy-duty mobility sectors.
Hydrogen-related demand is projected to double annually through 2025, and the World Platinum Investment Council estimates that hydrogen applications could account for 11% of total platinum demand by 2030. Supportive policies, including Canada’s 40% clean-hydrogen tax credit and the U.S. Inflation Reduction Act, are further accelerating multi-gigawatt electrolyzer deployments, positioning hydrogen technologies as one of the fastest-expanding drivers of PGM consumption.
Restraints - Supply Concentration and Geopolitical Risk
The Platinum Group Metals (PGM) supply chain is highly concentrated geographically, creating persistent exposure to production disruptions and geopolitical risks. South Africa accounts for more than 70% of global platinum output, while Russia provides approximately 26% of palladium supply, primarily through the Norilsk complex. This concentration contributed to a 3% decline in mined platinum production in 2024 due to reduced output in both countries.
South African operations face structural challenges, including deep, labor-intensive mining, rising energy costs, and intermittent social unrest. Concurrently, geopolitical tensions involving Russia introduce inventory instability and long-term supply uncertainty. Together, these factors limit the market’s ability to scale supply in line with growing demand.
Price Volatility Undermining Investment Certainty
Extreme price volatility across the Platinum Group Metals (PGM) market presents a substantial structural challenge for both downstream industries and upstream project developers. Palladium, which exceeded US$3,400/oz following geopolitical tensions arising from Russia’s invasion of Ukraine, later declined by nearly 37% within a short period.
Similarly, rhodium fell sharply from its 2021 peak of almost US$30,000/oz to approximately US$4,365/oz by February 2024, creating significant financial strain across the industry. Such instability undermines the reliability of long-term offtake agreements, particularly for fuel-cell manufacturers planning capital-intensive hydrogen infrastructure, thereby posing a persistent constraint on overall market momentum.
Opportunity - Rising PGM Demand from Green Hydrogen Infrastructure Build-Out
The rapid expansion of green hydrogen infrastructure represents one of the most significant growth opportunities for Platinum Group Metals (PGM) between 2026 and 2033. Proton exchange membrane (PEM) electrolyzers, dependent on platinum as their primary catalyst, are witnessing annual deployment growth of approximately 28% across both automotive and stationary power applications. Substantial policy support, particularly through the U.S. Inflation Reduction Act and Canada’s 40% clean-hydrogen tax credit, is enabling multi-gigawatt electrolyzer procurement.
Concurrently, national hydrogen strategies in Japan and South Korea are positioning Asia as a major emerging demand hub. Fuel cell vehicles require platinum loadings of 20–30 grams per unit, with automakers planning production exceeding ten million such vehicles by 2032. For PGM producers and refiners, this shift establishes a structurally new and diversified demand pathway beyond traditional autocatalyst applications.
PGM Recycling as a Circular Economy Growth Avenue
The expanding PGM recycling sector offers a significant opportunity for companies seeking to reduce reliance on primary mining while addressing rising global demand sustainably. Approximately 60% of PGMs used in new products are now derived from recycled materials, underscoring the maturity and strategic importance of secondary supply channels. In June 2024, four major North American catalytic converter recyclers, PGM of Texas, Legend Smelting and Recycling, Daniel Ball Converter Recycling, and Maryland Core, Inc., merged to form Elemental North America, illustrating the efficiency gains achievable through consolidation.
Similarly, the January 2024 partnership between Elemental Holding SA and Mitsubishi Corporation strengthened integrated recycling capabilities from collection to refined metal. As electronic waste and end-of-life vehicle volumes increase, PGM recycling presents a scalable, cost-effective, and ESG-aligned avenue for capturing additional market value.
Category-wise Insights
By Metal Type
Platinum maintains a leading position within the Platinum Group Metals market, holding an estimated 32% revenue share in the base year. Its dominance is supported by exceptional catalytic efficiency, strong corrosion resistance, and broad industrial applicability. The metal plays a vital role in automotive catalytic converters, where it facilitates the neutralization of harmful exhaust emissions across diesel, gasoline, and hybrid powertrains.
Beyond the automotive sector, platinum’s essential contribution to PEM hydrogen fuel cells, its integration into advanced electronic components, and its sustained demand in the jewelry industry further reinforce its market leadership. According to the World Platinum Investment Council, the global platinum market recorded a supply deficit of roughly 878,000 ounces in 2023, with an additional deficit of about 539,000 ounces projected for 2025. These factors collectively underscore platinum’s irreplaceability and enduring demand.
By Application
Catalytic converters constitute the leading application segment within the Platinum Group Metals (PGM) market, representing approximately 27% of global PGM consumption. Their dominance is supported by the widespread enforcement of stringent vehicle emission standards across major automotive markets, including Euro-7, China-VI-b, and U.S. EPA Tier-3 regulations. Within these systems, platinum, palladium, and rhodium operate synergistically in three-way catalytic converters to transform carbon monoxide, unburned hydrocarbons, and nitrogen oxides into environmentally benign gases.
According to the U.S. Geological Survey, catalytic converters remain the largest end-use category for PGMs globally. Continued production of internal combustion engine vehicles, particularly across Asia, together with increasing hybrid vehicle adoption in Europe and North America, ensures the sustained leadership of this segment throughout the forecast period.
By Source
Mining remains the predominant source of Platinum Group Metals (PGMs), with 71% market share, supplying most of the primary global output. South Africa’s Bushveld Igneous Complex alone contributes over 70% of worldwide platinum production, underscoring the sector’s high geographic concentration. According to industry estimates, South Africa is expected to produce 4.3 million ounces of platinum in 2024, rising to approximately 4.5 million ounces by 2030.
Although recycling represents the fastest-growing source segment, driven by increasing recovery from end-of-life autocatalysts and electronic waste, amounting to nearly 120,000 kilograms of combined palladium-platinum recycled in 2024, primary mining continues to define the global supply foundation. This is largely due to the essential role of high-grade ore deposits in meeting expanding demand, particularly from hydrogen technologies and advanced electronics that require ultra-high-purity metals.
By Industry
The automotive segment represents the largest share of the Platinum Group Metals (PGM) market by end-use industry, accounting for nearly 60% of total consumption in 2024. This dominance is supported by the global vehicle fleet’s continued dependence on PGM-intensive catalytic converter systems to meet increasingly stringent emission regulations across major markets, including China, India, Europe, and North America. Heavy-duty commercial vehicles, such as trucks and buses, require substantially higher PGM loadings per unit, contributing to strong demand even as passenger electric-vehicle adoption rises.
The Energy sector, driven particularly by renewable hydrogen applications, is the fastest-growing end-use category, expanding at a projected CAGR of 9.50% through 2030 as PEM electrolyzer installations scale globally. Additionally, the Electronics & Semiconductor industry offers high-margin growth, with platinum, palladium, and ruthenium enabling advanced capacitors and next-generation memory technologies.
Regional Insights
North America Platinum Group Metals Market Trends
North America holds a strategically important position in the global platinum group metals (PGM) market, supported by the United States’ stringent regulatory landscape and expanding investments in clean energy infrastructure. The U.S. Environmental Protection Agency mandates emission reductions of more than 95% for light-duty vehicles, ensuring sustained demand for PGM-based autocatalysts. Additionally, the U.S. Inflation Reduction Act continues to direct significant capital toward hydrogen fuel cell development, with multi-gigawatt electrolyzer contracts benefiting from generous production tax credits.
Canada’s 40% clean-hydrogen tax credit further strengthens regional demand. On the supply side, Sibanye-Stillwater’s Stillwater Complex in Montana, recognized as the largest PGM mine in the Western Hemisphere, provides critical domestic output. Supported by leading fuel cell manufacturers, automotive OEMs, and national laboratories, the region is emerging as the fastest-growing PGM demand hub, reinforced by the 2024 formation of Elemental North America through the consolidation of four major recyclers.
Europe Platinum Group Metals Trends
Europe remains a pivotal market for platinum group metals (PGMs), supported by some of the world’s most stringent vehicle emission regulations and an ambitious regional hydrogen strategy. Germany, France, the U.K., and Spain host major automotive manufacturers whose production volumes heavily rely on PGM-based catalytic converters. Europe produced more than 16-million passenger vehicles in 2022, underscoring the scale of autocatalyst demand across the region.
Furthermore, the European Commission’s decision to effectively delay the 2035 phase-out of new internal combustion engine vehicles has extended long-term PGM demand for producers and refiners. Europe’s advancing hydrogen economy provides an additional structural growth catalyst, with the EU Hydrogen Strategy and REPowerEU initiative accelerating investment in green hydrogen projects. Leading technology players such as Johnson Matthey and BASF SE further reinforce Europe’s role as both a major consumer and an innovation hub within the PGM value chain.
Asia Pacific Platinum Group Metals Trends
Asia Pacific remains the dominant region in the global Platinum Group Metals (PGM) market, accounting for approximately 44% of worldwide consumption. China serves as the primary demand center, operating simultaneously as the world’s largest automotive market, a major electronics manufacturing hub, and an expanding investor in hydrogen infrastructure. In 2024, the country produced nearly 26 million vehicles, most equipped with palladium-intensive catalytic converters, while the 2025 launch of platinum futures on the Guangzhou Futures Exchange significantly enhanced market liquidity.
Japan and South Korea continue to advance national hydrogen strategies, positioning both nations at the forefront of PEM fuel cell adoption and increasing platinum and iridium demand. Meanwhile, India’s expanding automotive sector, supported by BS-VI emission standards, is further strengthening regional autocatalyst consumption. Collectively, these factors establish Asia Pacific as the sustained global demand leader through 2033.
Competitive Landscape
The global platinum group metals (PGM) market is characterized by a moderately consolidated structure, with leading producers such as Valterra Platinum, Norilsk Nickel, Impala Platinum Holdings, Sibanye-Stillwater, and Northam Platinum controlling a substantial share of primary mined output. These companies are increasingly pursuing vertical integration across mining, smelting, refining, and recycling to enhance value-chain efficiency and profitability. Strategic diversification into hydrogen fuel cell technologies, battery metals, and advanced recycling capabilities is further reshaping competitive positioning. At the same time, South African producers continue to implement cost-optimization measures and mine rationalization in response to price volatility, while emerging players focus on secondary supply partnerships to offer ESG-aligned, cost-competitive alternatives.
Key Developments
- May 2025: Valterra Platinum listed on the Johannesburg Stock Exchange (JSE) as an independent entity following its demerger from Anglo American plc, marking the largest equity capital market transaction in JSE history, according to Standard Bank.
- December 2023: Lifezone Metals Limited announced the signing of a term sheet with a subsidiary of Glencore plc for a platinum, palladium, and rhodium recycling project utilizing Lifezone Metals' hydrometallurgical technology ("Hydromet"), to be based in the USA.
- February 2025: Diversified miner Sibanye-Stillwater announced it had reached a chrome management deal with Glencore's Merafe Venture in South Africa, as it seeks to partially offset the impact of an extended platinum metal price slump.
Top Companies in Platinum Group Metals Market
Valterra Platinum (South Africa) is the world's largest primary PGM producer, with vertically integrated assets described as the most technologically advanced processing infrastructure in the industry. Targeting production of 3.0–3.2 million PGM oz annually, it has invested over R6 billion in processing asset upgrades over two years. Its demerger from Anglo American plc in 2025 positions it as a fully focused, independent PGM champion with multiple brownfield growth options across South Africa and Zimbabwe.
Norilsk Nickel / Nornickel (Russia) is the world's largest producer of refined palladium and among the top producers of platinum globally, operating extensive nickel-copper-PGM deposits across Siberia's Norilsk-Talnakh region. The company's Sulphur Project demonstrates its commitment to reducing environmental impact. In May 2024, Nornickel announced plans to establish a PGM refinery in Bahrain, seeking to diversify its refining footprint amid ongoing geopolitical pressures on Russian commodity exports.
Sibanye-Stillwater Limited (South Africa) has evolved into one of the world's most diversified precious metals companies, operating PGM assets in South Africa and the Stillwater Complex in Montana, USA, the largest PGM operation in the Western Hemisphere. With reported liquidity of approximately US$ 2.6 billion, the company is well-positioned for growth investments. Its February 2024 collaboration with Heraeus Precious Metals to explore novel PGM applications in the hydrogen market reflects its commitment to creating future demand channels beyond conventional autocatalysis.
Companies Covered in Platinum Group Metals Market
- Valterra Platinum
- Norilsk Nickel
- Impala Platinum Holdings Limited
- Sibanye-Stillwater Limited
- Northam Platinum Holdings Limited
- Glencore plc
- Johnson Matthey
- African Rainbow Minerals Limited
- Platinum Group Metals Limited
- BASF SE
- Vale S.A.
Frequently Asked Questions
The global Platinum Group Metals market is valued at US$ 39.6 Bn in 2026 and is projected to reach US$ 52.1 Bn by 2033, growing at a compound annual growth rate of 4.0% during the forecast period 2026–2033. The market recorded a historical CAGR of 3.4% between 2020 and 2025.
The primary demand drivers include tightening global vehicle emission standards (such as Euro 7, China VI-b, and U.S. EPA Tier 3), which sustain PGM demand in automotive catalytic converters, and the rapid scale-up of hydrogen fuel cell infrastructure, where platinum serves as the critical catalyst in PEM electrolyzers. The World Platinum Investment Council (WPIC) estimates hydrogen applications could absorb 11% of annual platinum demand by 2030.
Platinum is the leading segment by metal type, holding approximately 32% of the market share. Its dominance is driven by its indispensable role in automotive catalytic converters, hydrogen fuel cells, and industrial processes. The WPIC projected a global platinum supply deficit of approximately 539,000 oz in 2025, highlighting the structural demand-supply imbalance underpinning platinum's premium market position.
Asia Pacific is the leading region, accounting for approximately 44% of global PGM consumption. China's status as the world's largest automotive market, combined with its expanding electronics and hydrogen sectors, positions the region as the primary demand engine. Japan and South Korea further contribute through national hydrogen investment programs.
The most significant growth opportunity lies in the expansion of green hydrogen infrastructure. Platinum-loaded PEM electrolyzers are central to the emerging hydrogen economy, with governments including the U.S., Canada, and multiple EU member states committing substantial policy and financial support. Additionally, PGM recycling, already representing around 60% of annual supply, offers a scalable, sustainable opportunity for market participants as circular economy mandates strengthen globally.
The leading companies in the global Platinum Group Metals market include Valterra Platinum, Norilsk Nickel, Impala Platinum Holdings Limited, Sibanye-Stillwater Limited, Northam Platinum Holdings Limited, Glencore plc, Johnson Matthey, BASF SE, African Rainbow Minerals Limited, Platinum Group Metals Limited, and Vale S.A., among others.


