


- Executive Summary
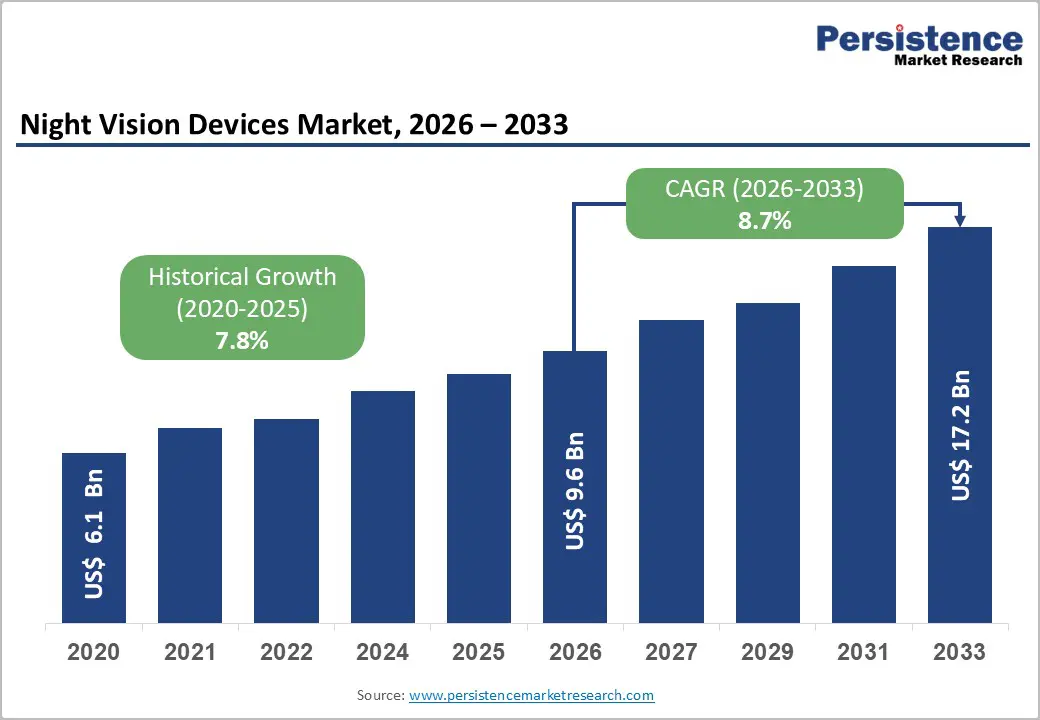
- Global Night Vision Devices Market Snapshot 2026 and 2033
- Market Opportunity Assessment, 2026 - 2033, US$ Bn
- Key Market Trends
- Industry Developments and Key Market Events
- Demand Side and Supply Side Analysis
- PMR Analysis and Recommendations
- Market Overview
- Market Scope and Definitions
- Value Chain Analysis
- Macro-Economic Factors
- Global GDP Outlook
- Expenditure on Border Surveillance by Country Overview
- Expenditure on Medical Devices by Country Overview
- Expenditure on Security Surveillance by Country
- Forecast Factors - Relevance and Impact
- COVID-19 Impact Assessment
- PESTLE Analysis
- Porter's Five Forces Analysis
- Geopolitical Tensions: Market Impact
- Regulatory and Technology Landscape
- Market Dynamics
- Drivers
- Restraints
- Opportunities
- Trends
- Price Trend Analysis, 2020 - 2033
- Region-wise Price Analysis
- Price by Segments
- Price Impact Factors
- Global Night Vision Devices Market Outlook: Historical (2020 - 2025) and Forecast (2026 - 2033)
- Key Highlights
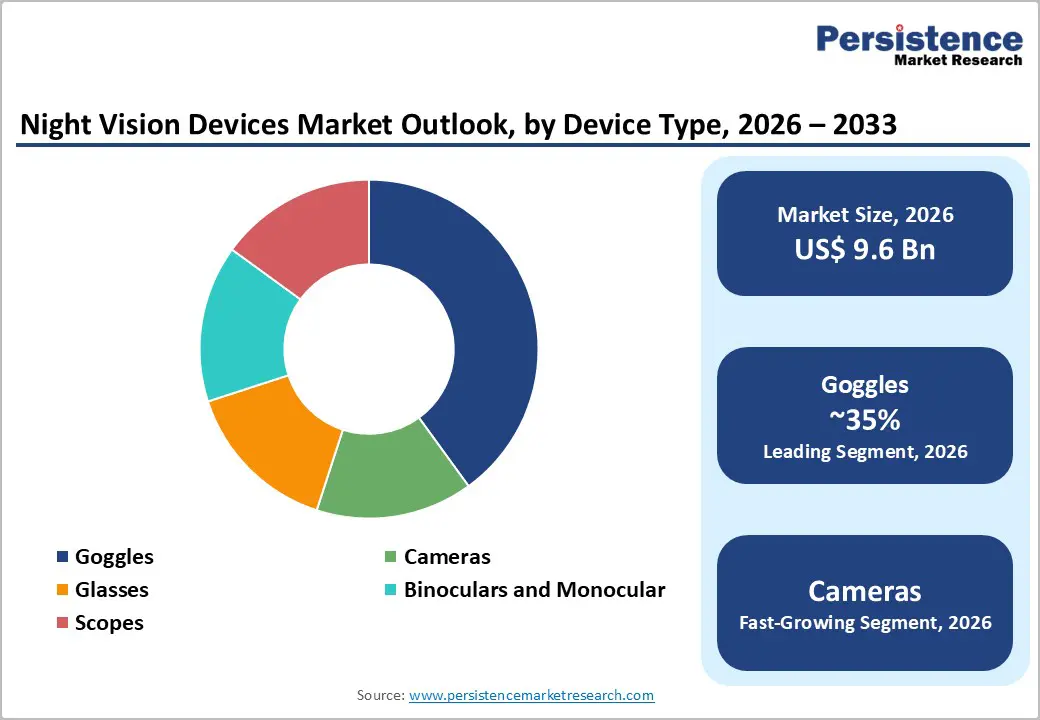
- Global Night Vision Devices Market Outlook: Device Type
- Introduction/Key Findings
- Historical Market Size (US$ Bn) and Volume (Units) Analysis by Device Type, 2020-2025
- Current Market Size (US$ Bn) and Volume (Units) Forecast, by Device Type, 2026-2033
- Goggles
- Cameras
- Glasses
- Binoculars and Monocular
- Scopes
- Market Attractiveness Analysis: Device Type
- Global Night Vision Devices Market Outlook: By Application
- Introduction/Key Findings
- Historical Market Size (US$ Bn) and Volume (Units) Analysis by By Application, 2020-2025
- Current Market Size (US$ Bn) and Volume (Units) Forecast, by By Application, 2026-2033
- Border surveillance
- Maritime & Coastal surveillance
- Medical
- Security
- Engineering
- Fire and Rescue
- Law Enforcement
- Others
- Market Attractiveness Analysis: By Application
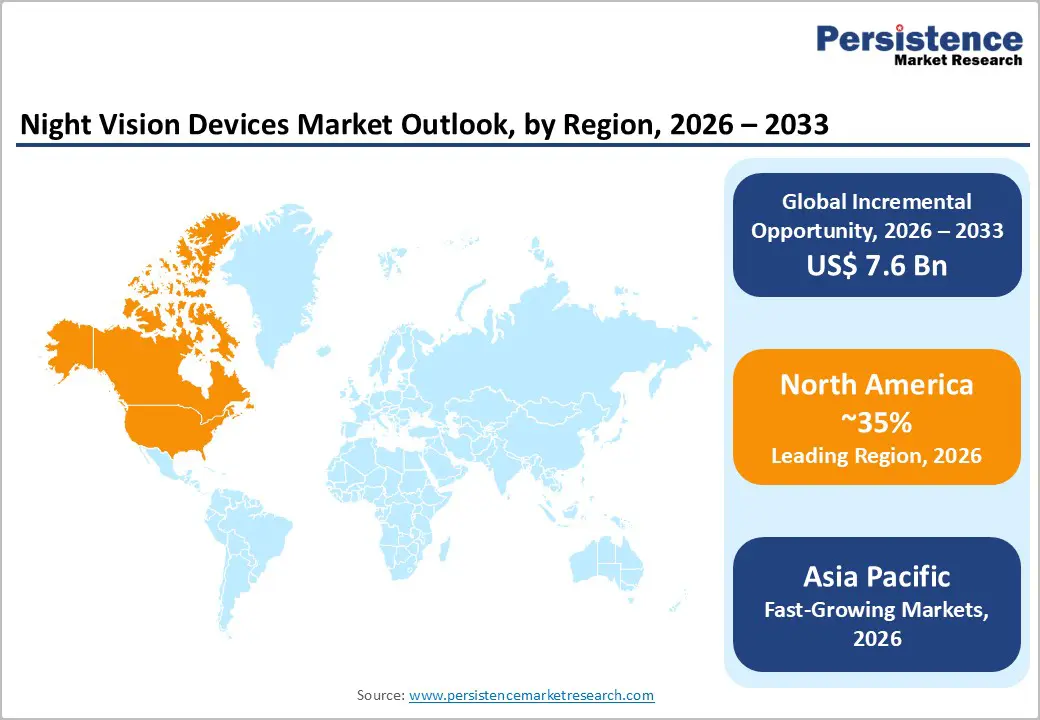
- Global Night Vision Devices Market Outlook: Region
- Key Highlights
- Historical Market Size (US$ Bn) and Volume (Units) Analysis by Region, 2020-2025
- Current Market Size (US$ Bn) and Volume (Units) Forecast, by Region, 2026-2033
- North America
- Europe
- East Asia
- South Asia & Oceania
- Latin America
- Middle East & Africa
- Market Attractiveness Analysis: Region
- North America Night Vision Devices Market Outlook: Historical (2020 - 2025) and Forecast (2026 - 2033)
- Key Highlights
- Pricing Analysis
- North America Market Size (US$ Bn) and Volume (Units) Forecast, by Country, 2026-2033
- U.S.
- Canada
- North America Market Size (US$ Bn) and Volume (Units) Forecast, by Device Type, 2026-2033
- Goggles
- Cameras
- Glasses
- Binoculars and Monocular
- Scopes
- North America Market Size (US$ Bn) and Volume (Units) Forecast, by By Application, 2026-2033
- Border surveillance
- Maritime & Coastal surveillance
- Medical
- Security
- Engineering
- Fire and Rescue
- Law Enforcement
- Others
- Europe Night Vision Devices Market Outlook: Historical (2020 - 2025) and Forecast (2026 - 2033)
- Key Highlights
- Pricing Analysis
- Europe Market Size (US$ Bn) and Volume (Units) Forecast, by Country, 2026-2033
- Germany
- Italy
- France
- U.K.
- Spain
- Russia
- Rest of Europe
- Europe Market Size (US$ Bn) and Volume (Units) Forecast, by Device Type, 2026-2033
- Goggles
- Cameras
- Glasses
- Binoculars and Monocular
- Scopes
- Europe Market Size (US$ Bn) and Volume (Units) Forecast, by By Application, 2026-2033
- Border surveillance
- Maritime & Coastal surveillance
- Medical
- Security
- Engineering
- Fire and Rescue
- Law Enforcement
- Others
- East Asia Night Vision Devices Market Outlook: Historical (2020 - 2025) and Forecast (2026 - 2033)
- Key Highlights
- Pricing Analysis
- East Asia Market Size (US$ Bn) and Volume (Units) Forecast, by Country, 2026-2033
- China
- Japan
- South Korea
- East Asia Market Size (US$ Bn) and Volume (Units) Forecast, by Device Type, 2026-2033
- Goggles
- Cameras
- Glasses
- Binoculars and Monocular
- Scopes
- East Asia Market Size (US$ Bn) and Volume (Units) Forecast, by By Application, 2026-2033
- Border surveillance
- Maritime & Coastal surveillance
- Medical
- Security
- Engineering
- Fire and Rescue
- Law Enforcement
- Others
- East Asia Market Size (US$ Bn) and Volume (Units) Forecast, by , 2026-2033
- South Asia & Oceania Night Vision Devices Market Outlook: Historical (2020 - 2025) and Forecast (2026 - 2033)
- Key Highlights
- Pricing Analysis
- South Asia & Oceania Market Size (US$ Bn) and Volume (Units) Forecast, by Country, 2026-2033
- India
- Southeast Asia
- ANZ
- Rest of SAO
- South Asia & Oceania Market Size (US$ Bn) and Volume (Units) Forecast, by Device Type, 2026-2033
- Goggles
- Cameras
- Glasses
- Binoculars and Monocular
- Scopes
- South Asia & Oceania Market Size (US$ Bn) and Volume (Units) Forecast, by By Application, 2026-2033
- Border surveillance
- Maritime & Coastal surveillance
- Medical
- Security
- Engineering
- Fire and Rescue
- Law Enforcement
- Others
- Latin America Night Vision Devices Market Outlook: Historical (2020 - 2025) and Forecast (2026 - 2033)
- Key Highlights
- Pricing Analysis
- Latin America Market Size (US$ Bn) and Volume (Units) Forecast, by Country, 2026-2033
- Brazil
- Mexico
- Rest of LATAM
- Latin America Market Size (US$ Bn) and Volume (Units) Forecast, by Device Type, 2026-2033
- Goggles
- Cameras
- Glasses
- Binoculars and Monocular
- Scopes
- Latin America Market Size (US$ Bn) and Volume (Units) Forecast, by By Application, 2026-2033
- Border surveillance
- Maritime & Coastal surveillance
- Medical
- Security
- Engineering
- Fire and Rescue
- Law Enforcement
- Others
- Middle East & Africa Night Vision Devices Market Outlook: Historical (2020 - 2025) and Forecast (2026 - 2033)
- Key Highlights
- Pricing Analysis
- Middle East & Africa Market Size (US$ Bn) and Volume (Units) Forecast, by Country, 2026-2033
- GCC Countries
- South Africa
- Northern Africa
- Rest of MEA
- Middle East & Africa Market Size (US$ Bn) and Volume (Units) Forecast, by Device Type, 2026-2033
- Goggles
- Cameras
- Glasses
- Binoculars and Monocular
- Scopes
- Middle East & Africa Market Size (US$ Bn) and Volume (Units) Forecast, by By Application, 2026-2033
- Border surveillance
- Maritime & Coastal surveillance
- Medical
- Security
- Engineering
- Fire and Rescue
- Law Enforcement
- Others
- Competition Landscape
- Market Share Analysis, 2025
- Market Structure
- Competition Intensity Mapping
- Competition Dashboard
- Company Profiles
- L-3 Technologies
- Company Overview
- Product Portfolio/Offerings
- Key Financials
- SWOT Analysis
- Company Strategy and Key Developments
- ITT Inc.
- Elbit Systems
- Thales Group
- Hensoldt
- Safran Electronics & Defense
- Hikvision Digital Technology
- Dahua Technology
- FLIR Systems
- Iris Innovations
- Axis Communications
- Pulsar
- Tele-Lux Electronics
- Raytheon Technologies
- Leonardo S.p.A.
- L-3 Technologies
- Appendix
- Research Methodology
- Research Assumptions
- Acronyms and Abbreviations

Loading page data
Please wait a moment


