


- Executive Summary
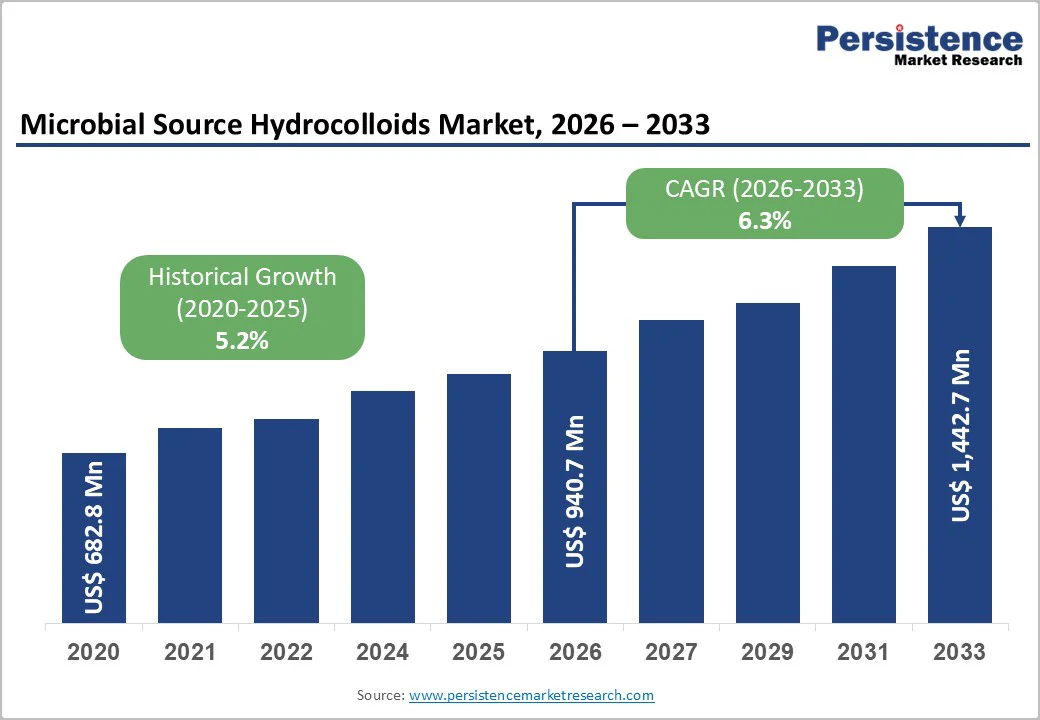
- Global Microbial Source Hydrocolloids Market Snapshot, 2026 and 2033
- Market Opportunity Assessment, 2026 - 2033, US$ Mn
- Key Market Trends
- Future Market Projections
- Premium Market Insights
- Industry Developments and Key Market Events
- PMR Analysis and Recommendations
- Market Overview
- Market Scope and Definition
- Market Dynamics
- Drivers
- Restraints
- Opportunity
- Challenges
- Key Trends
- COVID-19 Impact Analysis
- Forecast Factors - Relevance and Impact
- Value Added Insights
- Value Chain Analysis
- Key Market Players
- Regulatory Landscape
- PESTLE Analysis
- Porter’s Five Forces Analysis
- Price Trend Analysis, 2020 - 2033
- Key Factors Impacting Product Prices
- Pricing Analysis, By Product Type
- Regional Prices and Product Preferences
- Global Microbial Source Hydrocolloids Market Outlook
- Key Highlights
- Market Volume (Tons) Projections
- Market Size (US$ Mn) and Y-o-Y Growth
- Absolute $ Opportunity
- Market Size (US$ Mn) Analysis and Forecast
- Historical Market Size (US$ Mn) Analysis, 2020-2025
- Market Size (US$ Mn) Analysis and Forecast, 2026-2033
- Global Microbial Source Hydrocolloids Market Outlook: Product Type
- Historical Market Size (US$ Mn) and Volume (Tons) Analysis, By Product Type, 2020-2025
- Market Size (US$ Mn) and Volume (Tons) Analysis and Forecast, By Product Type, 2026-2033
- Xanthan Gum
- Gellan Gum
- Curdlan
- Dextran
- Others
- Market Attractiveness Analysis: Product Type
- Global Microbial Source Hydrocolloids Market Outlook: Form
- Historical Market Size (US$ Mn) and Volume (Tons) Analysis, By Form, 2020-2025
- Market Size (US$ Mn) and Volume (Tons) Analysis and Forecast, By Form, 2026-2033
- Powder
- Liquid
- Others
- Market Attractiveness Analysis: Form
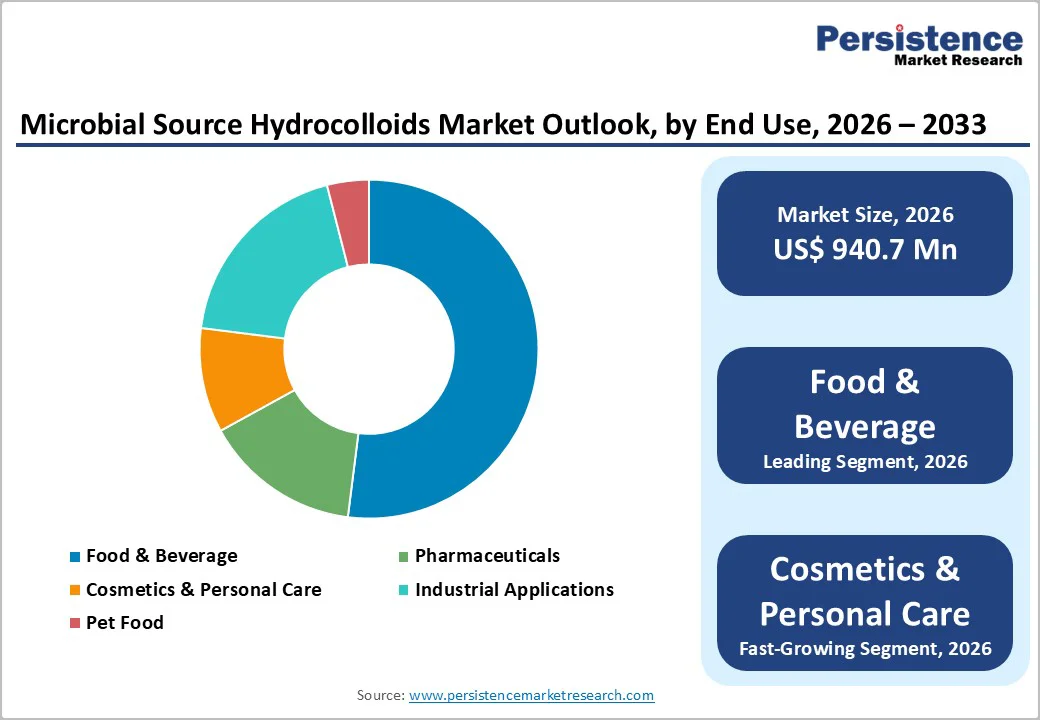
- Global Microbial Source Hydrocolloids Market Outlook: End Use
- Historical Market Size (US$ Mn) and Volume (Tons) Analysis, By End Use, 2020-2025
- Market Size (US$ Mn) and Volume (Tons) Analysis and Forecast, By End Use, 2026-2033
- Food & Beverage
- Pharmaceuticals
- Cosmetics & Personal Care
- Industrial End Uses
- Pet Food
- Market Attractiveness Analysis: End Use
- Key Highlights
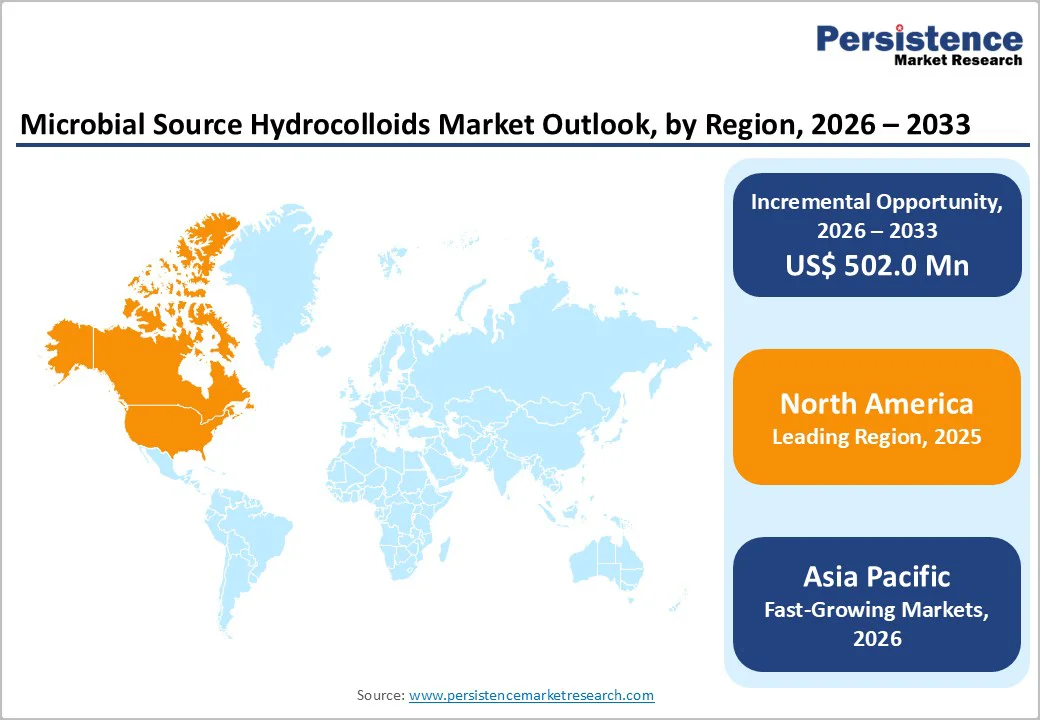
- Global Microbial Source Hydrocolloids Market Outlook: Region
- Historical Market Size (US$ Mn) and Volume (Tons) Analysis, By Region, 2020-2025
- Market Size (US$ Mn) and Volume (Tons) Analysis and Forecast, By Region, 2026-2033
- North America
- Latin America
- Europe
- East Asia
- South Asia and Oceania
- Middle East & Africa
- Market Attractiveness Analysis: Region
- North America Microbial Source Hydrocolloids Market Outlook
- Historical Market Size (US$ Mn) and Volume (Tons) Analysis, By Market, 2020-2025
- By Country
- By Product Type
- By Form
- By End Use
- Market Size (US$ Mn) and Volume (Tons) Analysis and Forecast, By Country, 2026-2033
- U.S.
- Canada
- Market Size (US$ Mn) and Volume (Tons) Analysis and Forecast, By Product Type, 2026-2033
- Xanthan Gum
- Gellan Gum
- Curdlan
- Dextran
- Others
- Market Size (US$ Mn) and Volume (Tons) Analysis and Forecast, By Form, 2026-2033
- Powder
- Liquid
- Others
- Market Size (US$ Mn) and Volume (Tons) Analysis and Forecast, By End Use, 2026-2033
- Food & Beverage
- Pharmaceuticals
- Cosmetics & Personal Care
- Industrial End Uses
- Pet Food
- Market Attractiveness Analysis
- Historical Market Size (US$ Mn) and Volume (Tons) Analysis, By Market, 2020-2025
- Europe Microbial Source Hydrocolloids Market Outlook
- Historical Market Size (US$ Mn) and Volume (Tons) Analysis, By Market, 2020-2025
- By Country
- By Product Type
- By Form
- By End Use
- Market Size (US$ Mn) and Volume (Tons) Analysis and Forecast, By Country, 2026-2033
- Germany
- France
- U.K.
- The Netherlands
- Spain
- Russia
- Rest of Europe
- Market Size (US$ Mn) and Volume (Tons) Analysis and Forecast, By Product Type, 2026-2033
- Xanthan Gum
- Gellan Gum
- Curdlan
- Dextran
- Others
- Market Size (US$ Mn) and Volume (Tons) Analysis and Forecast, By Form, 2026-2033
- Powder
- Liquid
- Others
- Market Size (US$ Mn) and Volume (Tons) Analysis and Forecast, By End Use, 2026-2033
- Food & Beverage
- Pharmaceuticals
- Cosmetics & Personal Care
- Industrial End Uses
- Pet Food
- Market Attractiveness Analysis
- Historical Market Size (US$ Mn) and Volume (Tons) Analysis, By Market, 2020-2025
- East Asia Microbial Source Hydrocolloids Market Outlook
- Historical Market Size (US$ Mn) and Volume (Tons) Analysis, By Market, 2020-2025
- By Country
- By Product Type
- By Form
- By End Use
- Market Size (US$ Mn) and Volume (Tons) Analysis and Forecast, By Country, 2026-2033
- China
- Japan
- South Korea
- Market Size (US$ Mn) and Volume (Tons) Analysis and Forecast, By Product Type, 2026-2033
- Xanthan Gum
- Gellan Gum
- Curdlan
- Dextran
- Others
- Market Size (US$ Mn) and Volume (Tons) Analysis and Forecast, By Form, 2026-2033
- Powder
- Liquid
- Others
- Market Size (US$ Mn) and Volume (Tons) Analysis and Forecast, By End Use, 2026-2033
- Food & Beverage
- Pharmaceuticals
- Cosmetics & Personal Care
- Industrial End Uses
- Pet Food
- Market Attractiveness Analysis
- Historical Market Size (US$ Mn) and Volume (Tons) Analysis, By Market, 2020-2025
- South Asia & Oceania Microbial Source Hydrocolloids Market Outlook
- Historical Market Size (US$ Mn) and Volume (Tons) Analysis, By Market, 2020-2025
- By Country
- By Product Type
- By Form
- By End Use
- Market Size (US$ Mn) and Volume (Tons) Analysis and Forecast, By Country, 2026-2033
- India
- Indonesia
- Thailand
- The Philippines
- ANZ
- Rest of South Asia & Oceania
- Market Size (US$ Mn) and Volume (Tons) Analysis and Forecast, By Product Type, 2026-2033
- Xanthan Gum
- Gellan Gum
- Curdlan
- Dextran
- Others
- Market Size (US$ Mn) and Volume (Tons) Analysis and Forecast, By Form, 2026-2033
- Powder
- Liquid
- Others
- Market Size (US$ Mn) and Volume (Tons) Analysis and Forecast, By End Use, 2026-2033
- Food & Beverage
- Pharmaceuticals
- Cosmetics & Personal Care
- Industrial End Uses
- Pet Food
- Market Attractiveness Analysis
- Historical Market Size (US$ Mn) and Volume (Tons) Analysis, By Market, 2020-2025
- Latin America Microbial Source Hydrocolloids Market Outlook
- Historical Market Size (US$ Mn) and Volume (Tons) Analysis, By Market, 2020-2025
- By Country
- By Product Type
- By Form
- By End Use
- Market Size (US$ Mn) and Volume (Tons) Analysis and Forecast, By Country, 2026-2033
- Brazil
- Mexico
- Rest of Latin America
- Market Size (US$ Mn) and Volume (Tons) Analysis and Forecast, By Product Type, 2026-2033
- Xanthan Gum
- Gellan Gum
- Curdlan
- Dextran
- Others
- Market Size (US$ Mn) and Volume (Tons) Analysis and Forecast, By Form, 2026-2033
- Powder
- Liquid
- Others
- Market Size (US$ Mn) and Volume (Tons) Analysis and Forecast, By End Use, 2026-2033
- Food & Beverage
- Pharmaceuticals
- Cosmetics & Personal Care
- Industrial End Uses
- Pet Food
- Market Attractiveness Analysis
- Historical Market Size (US$ Mn) and Volume (Tons) Analysis, By Market, 2020-2025
- Middle East & Africa Microbial Source Hydrocolloids Market Outlook
- Historical Market Size (US$ Mn) and Volume (Tons) Analysis, By Market, 2020-2025
- By Country
- By Product Type
- By Form
- By End Use
- Market Size (US$ Mn) and Volume (Tons) Analysis and Forecast, By Country, 2026-2033
- GCC Countries
- Egypt
- South Africa
- Northern Africa
- Rest of Middle East & Africa
- Market Size (US$ Mn) and Volume (Tons) Analysis and Forecast, By Product Type, 2026-2033
- Xanthan Gum
- Gellan Gum
- Curdlan
- Dextran
- Others
- Market Size (US$ Mn) and Volume (Tons) Analysis and Forecast, By Form, 2026-2033
- Powder
- Liquid
- Others
- Market Size (US$ Mn) and Volume (Tons) Analysis and Forecast, By End Use, 2026-2033
- Food & Beverage
- Pharmaceuticals
- Cosmetics & Personal Care
- Industrial End Uses
- Pet Food
- Market Attractiveness Analysis
- Historical Market Size (US$ Mn) and Volume (Tons) Analysis, By Market, 2020-2025
- Competition Landscape
- Market Share Analysis, 2025
- Market Structure
- Competition Intensity Mapping By Market
- Competition Dashboard
- Company Profiles (Details - Overview, Financials, Strategy, Recent Developments)
- Tate & Lyle
- Overview
- Segments and Product Type
- Key Financials
- Market Developments
- Market Strategy
- J.M. Huber Corporation
- Ingredion
- IFF
- Cargill, Incorporated
- ADM
- Jungbunzlauer Suisse AG
- Deosen Biochemical(Ordos) Ltd.
- Fufeng Group Company Limited
- Meihua Holdings Group Co., Ltd.
- Others
- Tate & Lyle
- Appendix
- Research Methodology
- Research Assumptions
- Acronyms and Abbreviations

Loading page data
Please wait a moment


