

- Executive Summary
- Global Liquid-Filled Hard Capsules Market Snapshot 2026 and 2033
- Market Opportunity Assessment, 2026-2033, US$ Bn
- Key Market Trends
- Industry Developments and Key Market Events
- Demand Side and Supply-Side Analysis
- PMR Analysis and Recommendations
- Market Overview
- Market Scope and Definitions
- Market Dynamics
- Driver
- Restraint
- Opportunities
- Trends
- Macro-Economic Factors
- Global GDP Outlook
- Global Prison Growth Outlook
- Global Prison Population by Country
- Global Private Prison Market Growth Outlook
- Forecast Factors – Relevance and Impact
- COVID-19 Impact Assessment
- Value Added Insights
- Value Chain analysis
- Key Market Players
- Product Adoption Analysis
- Key Promotional Strategies by key players
- PESTLE Analysis
- Porter's Five Forces Analysis
- Regulatory and Technology Landscape
- Global Liquid-Filled Hard Capsules Market Outlook: Historical (2020 – 2025) and Forecast (2026 – 2033)
- Key Highlights
- Global Liquid-Filled Hard Capsules Market Outlook: Product
- Introduction/Key Findings
- Historical Market Size (US$ Bn) Analysis by Product, 2020-2025
- Current Market Size (US$ Bn) Forecast, by Product, 2026-2033
- Liquid in Capsules
- Pellets in Liquid-filled Capsules
- Pellets in Capsule in Liquid-filled Capsules
- Capsule in Liquid-filled Capsules
- Tablet in Liquid-filled Capsules
- Market Attractiveness Analysis: Product
- Global Liquid-Filled Hard Capsules Market Outlook: Raw Material
- Introduction/Key Findings
- Historical Market Size (US$ Bn) Analysis by Raw Material, 2020-2025
- Current Market Size (US$ Bn) Forecast, by Raw Material, 2026-2033
- Gelatin
- Hypromellose Capsules (HPMCs)
- Market Attractiveness Analysis: Raw Material
- Global Liquid-Filled Hard Capsules Market Outlook: Application
- Introduction/Key Findings
- Historical Market Size (US$ Bn) Analysis by Application, 2020-2025
- Current Market Size (US$ Bn) Forecast, by Application, 2026-2033
- Cough & Cold Preparations
- Cardiovascular Therapy Drugs
- Health Supplements
- Vitamin & Dietary Supplements
- Other
- Market Attractiveness Analysis: Application
- Global Liquid-Filled Hard Capsules Market Outlook: End User
- Introduction/Key Findings
- Historical Market Size (US$ Bn) Analysis by End User, 2020-2025
- Current Market Size (US$ Bn) Forecast, by End User, 2026-2033
- Pharmaceutical Companies
- Nutraceutical Companies
- Cosmeceutical Companies
- Contract Manufacturing Organizations
- Market Attractiveness Analysis: End User
- Global Liquid-Filled Hard Capsules Market Outlook: Region
- Key Highlights
- Historical Market Size (US$ Bn) Analysis by Region, 2020-2025
- Current Market Size (US$ Bn) Forecast by Region, 2026-2033
- North America
- Europe
- East Asia
- South Asia & Oceania
- Latin America
- Middle East & Africa
- Market Attractiveness Analysis: Region
- North America Liquid-Filled Hard Capsules Market Outlook: Historical (2020 – 2025) and Forecast (2026 – 2033)
- Key Highlights
- North America Market Size (US$ Bn) Forecast, by Country, 2026-2033
- U.S.
- Canada
- North America Market Size (US$ Bn) Forecast, by Product, 2026-2033
- Liquid in Capsules
- Pellets in Liquid-filled Capsules
- Pellets in Capsule in Liquid-filled Capsules
- Capsule in Liquid-filled Capsules
- Tablet in Liquid-filled Capsules
- North America Market Size (US$ Bn) Forecast, by Raw Material, 2026-2033
- Gelatin
- Hypromellose Capsules (HPMCs)
- North America Market Size (US$ Bn) Forecast, by Application, 2026-2033
- Cough & Cold Preparations
- Cardiovascular Therapy Drugs
- Health Supplements
- Vitamin & Dietary Supplements
- Other
- North America Market Size (US$ Bn) Forecast, by End User, 2026-2033
- Pharmaceutical Companies
- Nutraceutical Companies
- Cosmeceutical Companies
- Contract Manufacturing Organizations
- Europe Liquid-Filled Hard Capsules Market Outlook: Historical (2020 – 2025) and Forecast (2026 – 2033)
- Key Highlights
- Europe Market Size (US$ Bn) Forecast, by Country, 2026-2033
- Germany
- Italy
- France
- U.K.
- Spain
- Russia
- Rest of Europe
- Europe Market Size (US$ Bn) Forecast, by Product, 2026-2033
- Liquid in Capsules
- Pellets in Liquid-filled Capsules
- Pellets in Capsule in Liquid-filled Capsules
- Capsule in Liquid-filled Capsules
- Tablet in Liquid-filled Capsules
- Europe Market Size (US$ Bn) Forecast, by Raw Material, 2026-2033
- Gelatin
- Hypromellose Capsules (HPMCs)
- Europe Market Size (US$ Bn) Forecast, by Application, 2026-2033
- Cough & Cold Preparations
- Cardiovascular Therapy Drugs
- Health Supplements
- Vitamin & Dietary Supplements
- Other
- Europe Market Size (US$ Bn) Forecast, by End User, 2026-2033
- Pharmaceutical Companies
- Nutraceutical Companies
- Cosmeceutical Companies
- Contract Manufacturing Organizations
- East Asia Liquid-Filled Hard Capsules Market Outlook: Historical (2020 – 2025) and Forecast (2026 – 2033)
- Key Highlights
- East Asia Market Size (US$ Bn) Forecast, by Country, 2026-2033
- China
- Japan
- South Korea
- East Asia Market Size (US$ Bn) Forecast, by Product, 2026-2033
- Liquid in Capsules
- Pellets in Liquid-filled Capsules
- Pellets in Capsule in Liquid-filled Capsules
- Capsule in Liquid-filled Capsules
- Tablet in Liquid-filled Capsules
- East Asia Market Size (US$ Bn) Forecast, by Raw Material, 2026-2033
- Gelatin
- Hypromellose Capsules (HPMCs)
- East Asia Market Size (US$ Bn) Forecast, by Application, 2026-2033
- Cough & Cold Preparations
- Cardiovascular Therapy Drugs
- Health Supplements
- Vitamin & Dietary Supplements
- Other
- East Asia Market Size (US$ Bn) Forecast, by End User, 2026-2033
- Pharmaceutical Companies
- Nutraceutical Companies
- Cosmeceutical Companies
- Contract Manufacturing Organizations
- South Asia & Oceania Liquid-Filled Hard Capsules Market Outlook: Historical (2020 – 2025) and Forecast (2026 – 2033)
- Key Highlights
- South Asia & Oceania Market Size (US$ Bn) Forecast, by Country, 2026-2033
- India
- Southeast Asia
- ANZ
- Rest of SAO
- South Asia & Oceania Market Size (US$ Bn) Forecast, by Product, 2026-2033
- Liquid in Capsules
- Pellets in Liquid-filled Capsules
- Pellets in Capsule in Liquid-filled Capsules
- Capsule in Liquid-filled Capsules
- Tablet in Liquid-filled Capsules
- South Asia & Oceania Market Size (US$ Bn) Forecast, by Raw Material, 2026-2033
- Gelatin
- Hypromellose Capsules (HPMCs)
- South Asia & Oceania Market Size (US$ Bn) Forecast, by Application, 2026-2033
- Cough & Cold Preparations
- Cardiovascular Therapy Drugs
- Health Supplements
- Vitamin & Dietary Supplements
- Other
- South Asia & Oceania Market Size (US$ Bn) Forecast, by End User, 2026-2033
- Pharmaceutical Companies
- Nutraceutical Companies
- Cosmeceutical Companies
- Contract Manufacturing Organizations
- Latin America Liquid-Filled Hard Capsules Market Outlook: Historical (2020 – 2025) and Forecast (2026 – 2033)
- Key Highlights
- Latin America Market Size (US$ Bn) Forecast, by Country, 2026-2033
- Brazil
- Mexico
- Rest of LATAM
- Latin America Market Size (US$ Bn) Forecast, by Product, 2026-2033
- Liquid in Capsules
- Pellets in Liquid-filled Capsules
- Pellets in Capsule in Liquid-filled Capsules
- Capsule in Liquid-filled Capsules
- Tablet in Liquid-filled Capsules
- Latin America Market Size (US$ Bn) Forecast, by Raw Material, 2026-2033
- Gelatin
- Hypromellose Capsules (HPMCs)
- Latin America Market Size (US$ Bn) Forecast, by Application, 2026-2033
- Cough & Cold Preparations
- Cardiovascular Therapy Drugs
- Health Supplements
- Vitamin & Dietary Supplements
- Other
- Latin America Market Size (US$ Bn) Forecast, by End User, 2026-2033
- Pharmaceutical Companies
- Nutraceutical Companies
- Cosmeceutical Companies
- Contract Manufacturing Organizations
- Middle East & Africa Liquid-Filled Hard Capsules Market Outlook: Historical (2020 – 2025) and Forecast (2026 – 2033)
- Key Highlights
- Middle East & Africa Market Size (US$ Bn) Forecast, by Country, 2026-2033
- GCC Countries
- South Africa
- Northern Africa
- Rest of MEA
- Middle East & Africa Market Size (US$ Bn) Forecast, by Product, 2026-2033
- Liquid in Capsules
- Pellets in Liquid-filled Capsules
- Pellets in Capsule in Liquid-filled Capsules
- Capsule in Liquid-filled Capsules
- Tablet in Liquid-filled Capsules
- Middle East & Africa Market Size (US$ Bn) Forecast, by Raw Material, 2026-2033
- Gelatin
- Hypromellose Capsules (HPMCs)
- Middle East & Africa Market Size (US$ Bn) Forecast, by Application, 2026-2033
- Cough & Cold Preparations
- Cardiovascular Therapy Drugs
- Health Supplements
- Vitamin & Dietary Supplements
- Other
- Middle East & Africa Market Size (US$ Bn) Forecast, by End User, 2026-2033
- Pharmaceutical Companies
- Nutraceutical Companies
- Cosmeceutical Companies
- Contract Manufacturing Organizations
- Competition Landscape
- Market Share Analysis, 2025
- Market Structure
- Competition Intensity Mapping
- Competition Dashboard
- Company Profiles
- Lonza
- Company Overview
- Product Portfolio/Offerings
- Key Financials
- SWOT Analysis
- Company Strategy and Key Developments
- VANTAGE NUTRITION
- INNERCAP Technologies, Inc.
- LIQUIDCAPSULE MANUFACTURING LLC
- SuHeung
- Altasciences
- Others
- Lonza
- Appendix
- Research Methodology
- Research Assumptions
- Acronyms and Abbreviations


- Pharmaceuticals
- Liquid-Filled Hard Capsules Market
Liquid-Filled Hard Capsules Market Size, Share, and Growth Forecast 2026 - 2033
Liquid-Filled Hard Capsules Market by Product (Liquid in Capsules, Pellets in Liquid-filled Capsules, Pellets in Capsule in Liquid-filled Capsules, Capsule in Liquid-filled Capsules, Tablet in Liquid-filled Capsules), by Raw Material, by Application, by End User, by Regional Analysis, 2026-2033
Liquid-Filled Hard Capsules Market Size and Trend Analysis
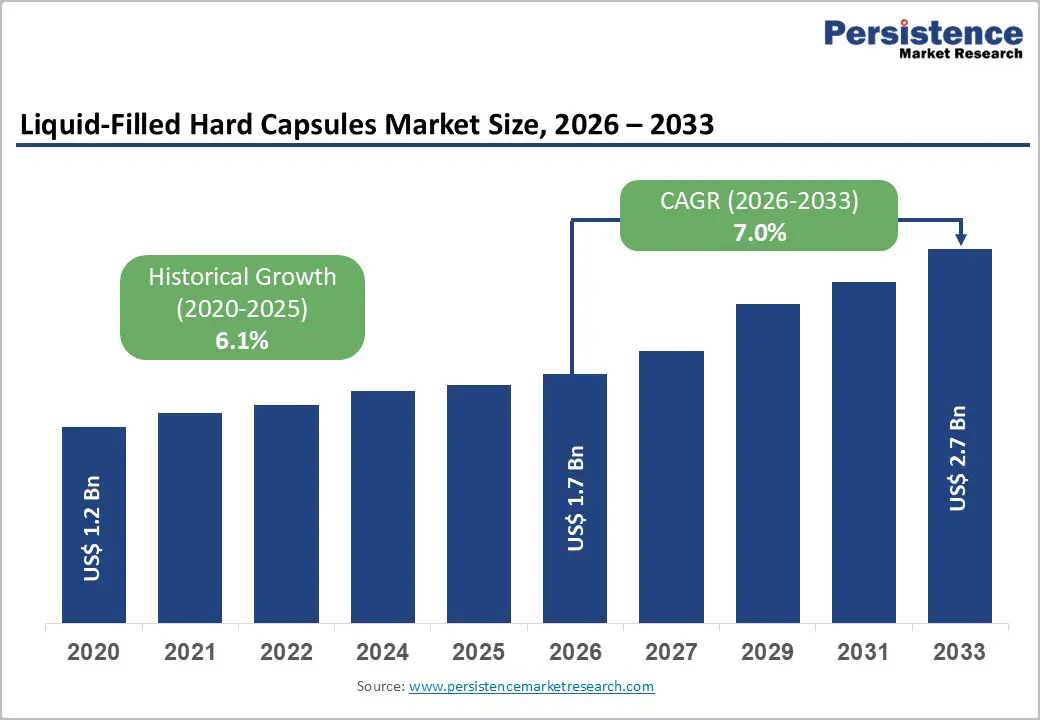
The global liquid-filled hard capsules market size is expected to be valued at US$ 1.7 billion in 2026 and projected to reach US$ 2.7 billion by 2033, growing at a CAGR of 7.0% between 2026 and 2033.
Hard gelatin capsules have served as a traditional and widely adopted dosage form for both prescription (Rx) and over-the-counter (OTC) drugs, as well as herbal products. They offer a convenient and effective means of delivering drugs that exist in powder or pellet forms. However, as pharmaceutical science progresses and market expectations evolve, certain categories of drugs necessitate innovative and diverse approaches to formulation. Demand for the faster development and launch of new products is another driving force in this pursuit of novel formulations.
Key Market highlights
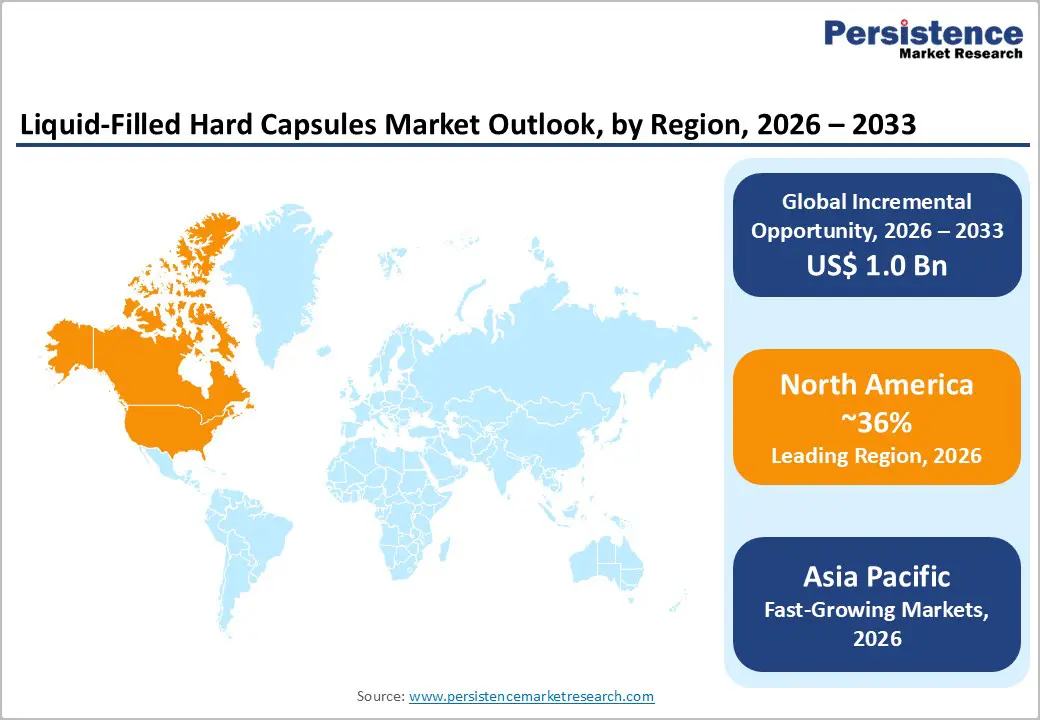
- North America leads the liquid-filled hard capsules market, supported by advanced pharmaceutical infrastructure, strong R&D investments, high adoption of innovative dosage forms, and favourable regulatory frameworks.
- Asia Pacific is the fastest-growing region, driven by expanding pharmaceutical manufacturing, rising chronic disease prevalence, increasing government support, and growing adoption of advanced oral drug delivery systems.
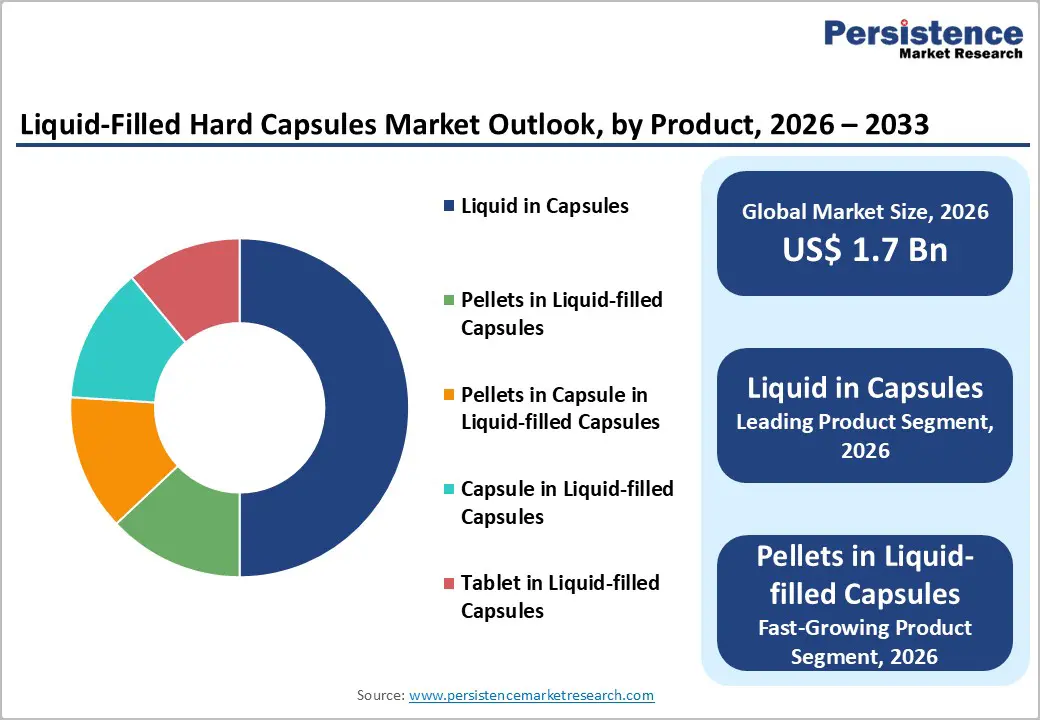
- Liquid in Capsules dominates product demand due to simplicity in formulation, high bioavailability, cost-effectiveness, and versatility across therapeutics like NSAIDs, nutraceuticals, and cough & cold medications.
- Pellets in Liquid-Filled Capsules represent the fastest-growing segment, fuelled by controlled-release capabilities, multiparticulate technologies, pediatric applications, and rising adoption in generic and specialty drug pipelines.
| Key Insights | Details |
|---|---|
| Liquid-Filled Hard Capsules Market Size (2026E) | US$ 1.7 Bn |
| Market Value Forecast (2033F) | US$ 2.7 Bn |
| Projected Growth (CAGR 2026 to 2033) | 7.0% |
| Historical Market Growth (CAGR 2020 to 2025) | 6.1% |
Market Dynamics
Driver: Growing Emphasis on Advancements and Innovations in Capsule-Filling Technology
As technology continues to evolve, the market is witnessing newer and more advanced capsule-filling techniques. Among these innovations, liquid-filled hard capsule encapsulation stands out as one of the most promising and formidable contenders. Liquid-filled hard capsules (LFHCs) offer several advantages, such as improved drug solubility, enhanced bioavailability, and precise dosing, making them an attractive alternative to traditional dosage forms.
One notable innovation in LFHC technology is the use of precision liquid filling systems. These systems allow for accurate and consistent dosing of the liquid formulation into hard gelatin capsules. Capsugel, now a part of Lonza, has developed advanced liquid-filling machines that can handle a wide range of formulations, including oils, suspensions, and solutions. The automated nature of these machines ensures high production efficiency and minimizes the risk of errors in dosing.
Advancements in formulation science have led to the development of specialized excipients and surfactants that enhance the stability and bioavailability of liquid-filled capsules. This enables the formulation of challenging compounds, such as poorly soluble drugs and sensitive biologics, into LFHC. Another area of innovation is the improvement in capsule shell materials. Manufacturers like CapsCanada and Qualicaps have developed specialized gelatin and vegetarian (cellulose-based) capsules that provide excellent barrier properties, ensuring the integrity and stability of the liquid contents over time.
Advancements in sealing technologies have led to the development of tamper-evident and child-resistant features for LFHC, enhancing patient safety and compliance. All these technological advances are likely to push the global market for liquid-filled hard capsules forward, providing market players with lucrative growth opportunities.
Restraint: Complex Manufacturing Process of LFHCs a Pain Point
Not all drugs are suitable for formulation as liquids in LFHCs. Drugs with limited solubility in suitable excipients or those that are chemically unstable in liquid form may not be viable candidates for LFHC. Liquid formulations are generally more prone to degradation and have a shorter shelf-life compared to solid dosage forms. Stability concerns are limiting the use of LFHCs for drugs that require extended storage and shelf life. The manufacturing process for LFHCs is more complex compared to conventional solid dosage forms. Specialized equipment and processes are required for precise liquid filling, which can increase production costs and may not be feasible for all drug products.
LFHCs do not offer the same flexibility in doing as some other dosage forms. It can be challenging to accurately and consistently adjust dosages for individual patients, which is essential for personalized medicine. The market can face certain challenges due to the factors mentioned above, which are expected to impact on the widespread adoption and growth of liquid-filled hard capsules.
Opportunity: Expansion in Multi-Particulate Technologies
Pellets in Liquid-filled Capsules, identified as the fastest-growing product segment in the liquid-filled hard capsules market, offer significant advantages in controlled drug release. These multi-particulate systems allow for pulsatile or extended-release profiles, which are particularly valuable for irritant or sensitive drugs, enhancing patient tolerability and therapeutic outcomes. By enabling precise dose distribution and minimizing gastrointestinal irritation, they support better compliance, especially in populations such as pediatrics and geriatrics. Companies like Patheon have demonstrated innovations achieving up to 90% content uniformity, highlighting the reliability and scalability of these technologies. This precision also allows pharmaceutical firms to extend patent life for established compounds through novel delivery formats.
The Asia Pacific region presents a key growth opportunity for multi-particulate liquid-filled capsules due to its expanding manufacturing capabilities, cost efficiencies, and increasing contract research organization (CRO) collaborations. With pharmaceutical pipelines projected to grow by approximately 15%, local production of advanced LFHCs is expected to accelerate adoption across both generic and specialty drugs. Investment in multi-particulate technologies positions companies to capture rising demand in emerging markets and deliver differentiated products globally.
Category-wise Insights
Product Analysis
Liquid in capsules remains the leading product segment in the liquid-filled hard capsules market, capturing approximately 52% share in 2025. These capsules are widely preferred for their ability to fill hydrophobic liquids, such as NSAIDs, vitamins, and other lipophilic formulations, achieving high bioavailability of up to 95%. Compliance with Pharmacopoeia Europaea (Ph. Eur.) standards ensures seal integrity and minimizes leakage, supporting efficient high-speed production lines capable of manufacturing around 300,000 capsules per hour. The simplicity of filling, coupled with cost-effectiveness, typically 20% lower than multi-particulate systems, which reinforces their widespread adoption. Additionally, liquid capsules offer versatility across therapeutic categories, including cough and cold medications, nutraceuticals, and dietary supplements. Their consistent performance, compatibility with various formulation viscosities, and ability to deliver precise dosing make liquid in capsules a reliable choice for manufacturers seeking scalable, high-throughput production while maintaining formulation stability and patient compliance. This combination of efficiency, affordability, and therapeutic flexibility drives its dominant market position.
Raw Material Analysis
Gelatin remains the dominant raw material in liquid-filled hard capsules, accounting for approximately 70% of global usage. Its film-forming properties, gloss, and ability to provide tamper-evident seals make it highly suitable for pharmaceutical applications. Type A gelatin, derived primarily from bovine sources, is favored for its superior mechanical strength, elasticity, and compatibility with liquid fills. According to GPC guidelines, gelatin ensures capsule integrity under various storage and handling conditions, making it ideal for both high-speed manufacturing and long-term stability. Compared to hydroxypropyl methylcellulose (HPMC), gelatin is around 30% less expensive, contributing to lower production costs without compromising performance. Additionally, gelatin offers excellent machinability, supporting automated encapsulation systems and consistent dosing. Its widespread acceptance in global pharmacopeia standards, combined with consumer familiarity and regulatory compliance, solidifies its position as the material of choice for liquid-filled hard capsules. The dominance of gelatin reflects both economic advantages and functional reliability for large-scale pharmaceutical production.
End User Analysis
Pharmaceutical companies are the largest end users in the liquid-filled hard capsules market, commanding approximately 60% of market share in 2025. These organizations prioritize product quality, regulatory compliance, and intellectual property protection when selecting capsule technologies. Liquid-filled capsules offer advantages in bioavailability, dose precision, and patient compliance, making them particularly suitable for both branded and generic drug formulations. The flexibility of liquid fills allows manufacturers to develop differentiated products with improved solubility, faster onset of action, and customized release profiles. Regulatory incentives, such as FDA ANDA filings, have increased by around 18% for liquid capsules, highlighting the growing adoption of these dosage forms in generic markets to demonstrate bioequivalence and therapeutic efficacy. Pharmaceutical companies also leverage liquid-filled capsules to expand their product pipelines in therapeutic areas including cardiovascular, analgesics, and nutraceuticals. The combination of operational efficiency, formulation versatility, and regulatory alignment reinforces pharmaceutical companies’ dominant role in driving market demand and supporting the continued growth of liquid-filled hard capsules globally.
Regional Insights
North America Liquid-Filled Hard Capsules Market Trends and Insights
North America is the largest regional market for liquid-filled hard capsules (LFHCs), with the U.S. accounting for approximately 33% of global market share in 2025. The region’s dominance is supported by a mature pharmaceutical and biotechnology industry, high adoption of advanced drug delivery systems, and substantial investments in research and development. U.S.-based pharmaceutical and biotech companies dedicate significant resources to drug discovery, preclinical and clinical trials, process optimization, and post-approval studies. Government agencies, including the National Institutes of Health (NIH) and the Biomedical Advanced Research and Development Authority (BARDA), provide crucial funding, further stimulating innovation. This strong focus on R&D enables the development of new therapies and high-quality drug formulations, including liquid-filled capsules that improve bioavailability, patient compliance, and dosage precision. Ongoing innovation in formulation technologies, automation, and high-throughput manufacturing continues to reinforce North America’s leadership. Looking ahead, continued R&D investment and supportive regulatory frameworks are expected to drive sustained growth and technological advancement in the LFHC segment across the region.
Asia Pacific Liquid-Filled Hard Capsules Market Trends and Insights
Asia Pacific is the fastest-growing region in the liquid-filled hard capsules market, with China holding around 8% of global market share in 2025. Historically, Chinese pharmaceutical manufacturers focused primarily on generic drug production, with limited R&D investment. However, recent government initiatives are pushing the industry toward innovation, increased production of patented drugs, and higher product quality standards. Policies encouraging consolidation of smaller companies aim to create larger, more competitive manufacturers capable of developing advanced formulations, including liquid-filled capsules. This shift is expected to enhance adoption of LFHCs for both domestic and export markets.
Rising chronic disease prevalence, growing healthcare infrastructure, and increasing pharmaceutical manufacturing capabilities across the Asia Pacific region are also driving demand. Local producers are expected to invest more in R&D, focusing on controlled release, multiparticulate, and improved bioavailability formulations. Combined with government support and expanding access to modern healthcare, these factors signal a positive trajectory for the LFHC market in China and the broader Asia Pacific region, positioning it as a high-growth market segment globally.
Competitive Landscape
Market Structure Analysis
The liquid-filled hard capsules market is characterized by a high degree of fragmentation, with numerous competitors operating at both local and global levels. In response to the demands and preferences of patients, these companies are implementing various strategies to enhance their market position and expand their consumer base such as increased research and development activities, product launches, and mergers.?
Key Market Developments
- In May 2025, ACG, a global provider of fully integrated manufacturing solutions for the pharmaceutical and nutraceutical industries, launched the world’s first Personalised Capsule Machine (PCM).
- In July 2022, Lonza, a well-known global development and manufacturing company, declared that it would begin construction on a sizable commercial pharma product fill and finish unit in Stein. The facility is expected to be functional by the year 2026.
- In March 2021, CapsCanada, introduced its liquid-filled hard capsule manufacturing service in North America. This service is aimed at providing advanced solutions for pharmaceutical companies seeking to develop liquid formulations encapsulated in hard gelatin capsules.
Companies Covered in Liquid-Filled Hard Capsules Market
- Lonza
- VANTAGE NUTRITION
- INNERCAP Technologies, Inc.
- LIQUIDCAPSULE MANUFACTURING LLC
- SuHeung
- Altasciences
- Others
Frequently Asked Questions
The global Liquid-Filled Hard Capsules market reaches US$ 1.7 billion in 2026.
Rising chronic diseases, increasing oral drug adoption, enhanced bioavailability, patient compliance, pharmaceutical R&D, and growing nutraceutical consumption globally.
North America leads with 38% share in 2025.
Expansion in Asia Pacific, investment in novel formulations, multiparticulate and controlled-release capsules, and partnerships with hospitals and nutraceutical manufacturers.
Leaders include Lonza, VANTAGE NUTRITION, INNERCAP Technologies, Inc., and LIQUIDCAPSULE MANUFACTURING LLC.


