


- Executive Summary
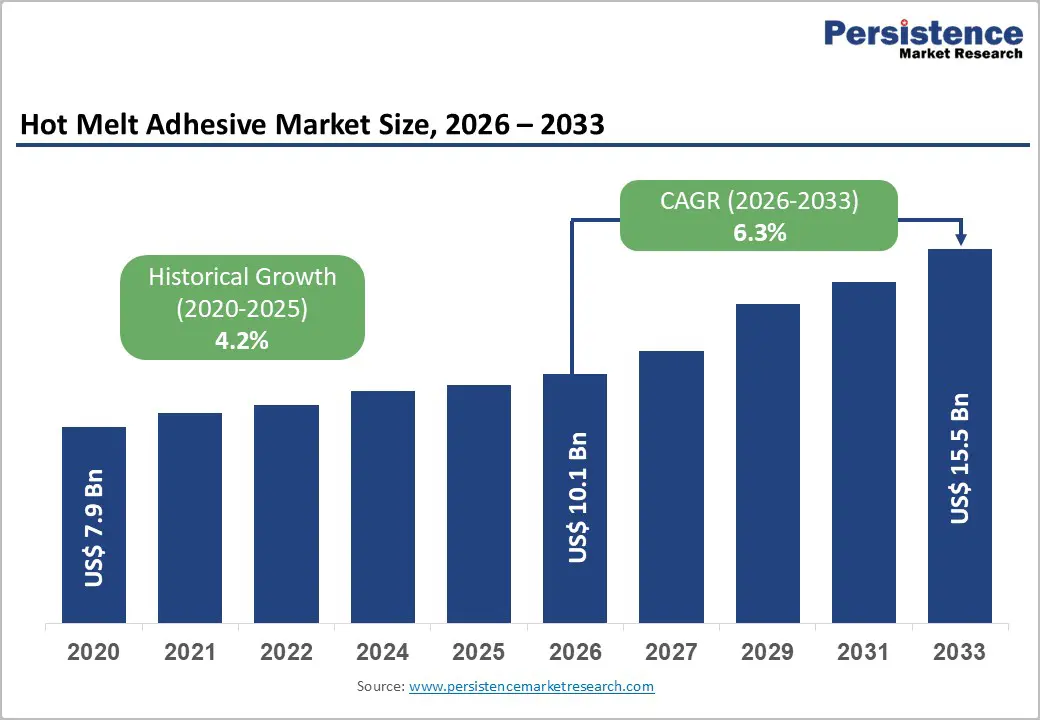
- Global Hot Melt Adhesive Market Snapshot 2026 and 2033
- Market Opportunity Assessment, 2026-2033, US$ Bn
- Key Market Trends
- Industry Developments and Key Market Events
- Demand Side and Supply Side Analysis
- PMR Analysis and Recommendations
- Market Overview
- Market Scope and Definitions
- Value Chain Analysis
- Macro-Economic Factors
- Global GDP Outlook
- Global Prison Growth Outlook
- Global Crime Rates by Country
- Global Prison Population by Country
- Global Private Prison Market Growth Outlook
- Other Macro-economic Factors
- Forecast Factors – Relevance and Impact
- COVID-19 Impact Assessment
- PESTLE Analysis
- Porter's Five Forces Analysis
- Geopolitical Tensions: Market Impact
- Regulatory and Technology Landscape
- Market Dynamics
- Drivers
- Restraints
- Opportunities
- Trends
- Price Trend Analysis, 2020 – 2033
- Region-wise Price Analysis
- Price by Segments
- Price Impact Factors
- Global Hot Melt Adhesive Market Outlook: Historical (2020 – 2025) and Forecast (2026 – 2033)
- Key Highlights
- Global Hot Melt Adhesive Market Outlook: Product Type
- Introduction/Key Findings
- Historical Market Size (US$ Bn) and Volume (Tons) Analysis by Product Type, 2020-2025
- Current Market Size (US$ Bn) and Volume (Tons) Forecast, by Product Type, 2026-2033
- Ethylene Vinyl Acetate (EVA)
- Polyamide
- Polyolefin
- Polyurethane
- Styrene Block Copolymers (SBC)
- Silane Modified Polymers
- Other
- Market Attractiveness Analysis: Product Type
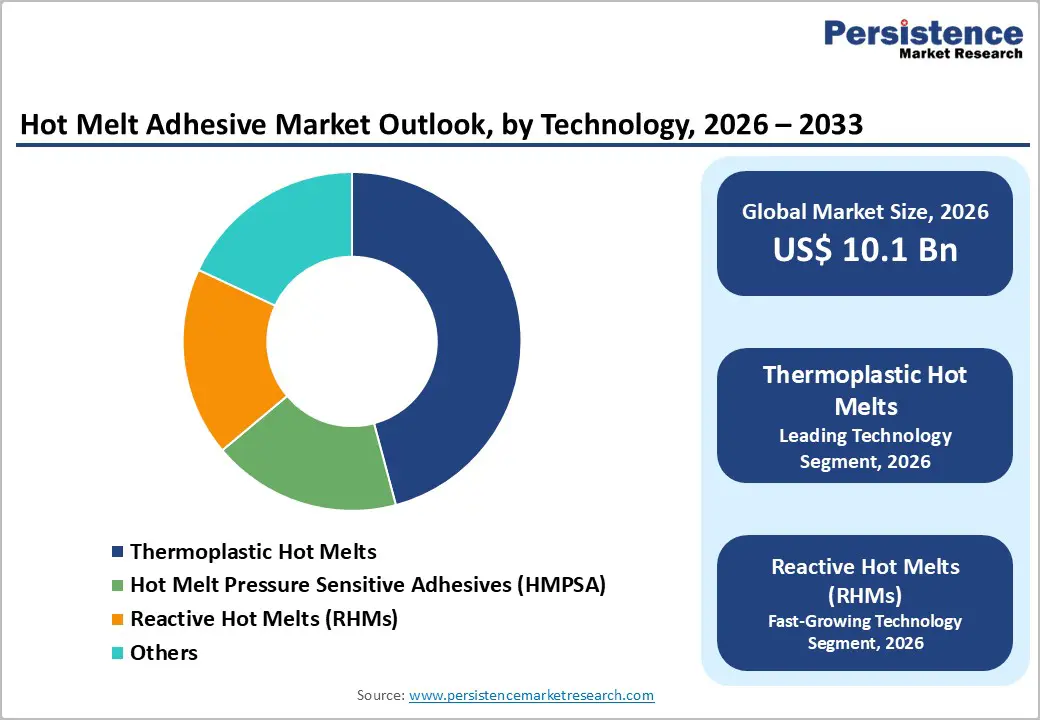
- Global Hot Melt Adhesive Market Outlook: Technology
- Introduction/Key Findings
- Historical Market Size (US$ Bn) and Volume (Tons) Analysis by Technology, 2020-2025
- Current Market Size (US$ Bn) and Volume (Tons) Forecast, by Technology, 2026-2033
- Thermoplastic Hot Melts
- Hot Melt Pressure Sensitive Adhesives (HMPSA)
- Reactive Hot Melts (RHMs)
- Others
- Market Attractiveness Analysis: Technology
- Global Hot Melt Adhesive Market Outlook: End-Use Industry
- Introduction/Key Findings
- Historical Market Size (US$ Bn) and Volume (Tons) Analysis by End-Use Industry, 2020-2025
- Current Market Size (US$ Bn) and Volume (Tons) Forecast, by End-Use Industry, 2026-2033
- Packaging
- Woodworking
- Automotive
- Bookbinding & Graphic Arts
- Nonwoven & Hygiene
- Electronics & Electrical
- Footwear
- Aerospace
- Others
- Market Attractiveness Analysis: End-Use Industry
- Global Hot Melt Adhesive Market Outlook: Distribution Channel
- Introduction/Key Findings
- Historical Market Size (US$ Bn) and Volume (Tons) Analysis by Distribution Channel, 2020-2025
- Current Market Size (US$ Bn) and Volume (Tons) Forecast, by Distribution Channel, 2026-2033
- Offline Retail
- Online Retail
- OEM
- Market Attractiveness Analysis: Distribution Channel
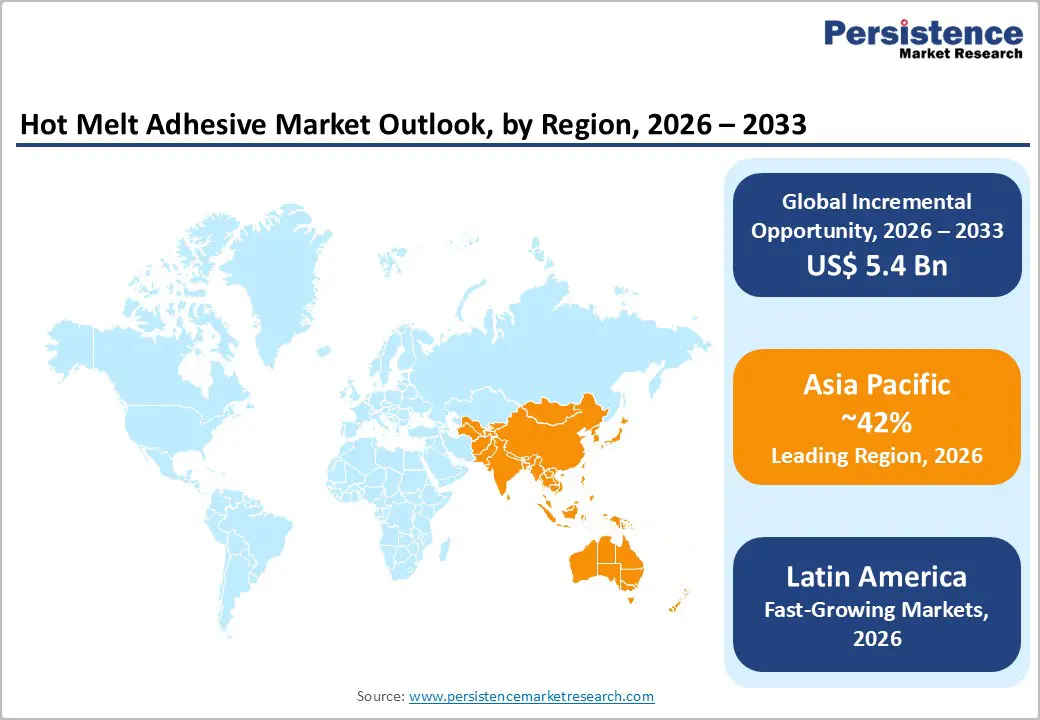
- Global Hot Melt Adhesive Market Outlook: Region
- Key Highlights
- Historical Market Size (US$ Bn) and Volume (Tons) Analysis by Region, 2020-2025
- Current Market Size (US$ Bn) and Volume (Tons) Forecast, by Region, 2026-2033
- North America
- Europe
- East Asia
- South Asia & Oceania
- Latin America
- Middle East & Africa
- Market Attractiveness Analysis: Region
- North America Hot Melt Adhesive Market Outlook: Historical (2020 – 2025) and Forecast (2026 – 2033)
- Key Highlights
- Pricing Analysis
- North America Market Size (US$ Bn) and Volume (Tons) Forecast, by Country, 2026-2033
- U.S.
- Canada
- North America Market Size (US$ Bn) and Volume (Tons) Forecast, by Product Type, 2026-2033
- Ethylene Vinyl Acetate (EVA)
- Polyamide
- Polyolefin
- Polyurethane
- Styrene Block Copolymers (SBC)
- Silane Modified Polymers
- Other
- North America Market Size (US$ Bn) and Volume (Tons) Forecast, by Technology, 2026-2033
- Thermoplastic Hot Melts
- Hot Melt Pressure Sensitive Adhesives (HMPSA)
- Reactive Hot Melts (RHMs)
- Others
- North America Market Size (US$ Bn) and Volume (Tons) Forecast, by End-Use Industry, 2026-2033
- Packaging
- Woodworking
- Automotive
- Bookbinding & Graphic Arts
- Nonwoven & Hygiene
- Electronics & Electrical
- Footwear
- Aerospace
- Others
- North America Market Size (US$ Bn) and Volume (Tons) Forecast, by Distribution Channel, 2026-2033
- Offline Retail
- Online Retail
- OEM
- Europe Hot Melt Adhesive Market Outlook: Historical (2020 – 2025) and Forecast (2026 – 2033)
- Key Highlights
- Pricing Analysis
- Europe Market Size (US$ Bn) and Volume (Tons) Forecast, by Country, 2026-2033
- Germany
- Italy
- France
- U.K.
- Spain
- Russia
- Rest of Europe
- Europe Market Size (US$ Bn) and Volume (Tons) Forecast, by Product Type, 2026-2033
- Ethylene Vinyl Acetate (EVA)
- Polyamide
- Polyolefin
- Polyurethane
- Styrene Block Copolymers (SBC)
- Silane Modified Polymers
- Other
- Europe Market Size (US$ Bn) and Volume (Tons) Forecast, by Technology, 2026-2033
- Thermoplastic Hot Melts
- Hot Melt Pressure Sensitive Adhesives (HMPSA)
- Reactive Hot Melts (RHMs)
- Others
- Europe Market Size (US$ Bn) and Volume (Tons) Forecast, by End-Use Industry, 2026-2033
- Packaging
- Woodworking
- Automotive
- Bookbinding & Graphic Arts
- Nonwoven & Hygiene
- Electronics & Electrical
- Footwear
- Aerospace
- Others
- Europe Market Size (US$ Bn) and Volume (Tons) Forecast, by Distribution Channel, 2026-2033
- Offline Retail
- Online Retail
- OEM
- East Asia Hot Melt Adhesive Market Outlook: Historical (2020 – 2025) and Forecast (2026 – 2033)
- Key Highlights
- Pricing Analysis
- East Asia Market Size (US$ Bn) and Volume (Tons) Forecast, by Country, 2026-2033
- China
- Japan
- South Korea
- East Asia Market Size (US$ Bn) and Volume (Tons) Forecast, by Product Type, 2026-2033
- Ethylene Vinyl Acetate (EVA)
- Polyamide
- Polyolefin
- Polyurethane
- Styrene Block Copolymers (SBC)
- Silane Modified Polymers
- Other
- East Asia Market Size (US$ Bn) and Volume (Tons) Forecast, by Technology, 2026-2033
- Thermoplastic Hot Melts
- Hot Melt Pressure Sensitive Adhesives (HMPSA)
- Reactive Hot Melts (RHMs)
- Others
- East Asia Market Size (US$ Bn) and Volume (Tons) Forecast, by End-Use Industry, 2026-2033
- Packaging
- Woodworking
- Automotive
- Bookbinding & Graphic Arts
- Nonwoven & Hygiene
- Electronics & Electrical
- Footwear
- Aerospace
- Others
- East Asia Market Size (US$ Bn) and Volume (Tons) Forecast, by Distribution Channel, 2026-2033
- Offline Retail
- Online Retail
- OEM
- South Asia & Oceania Hot Melt Adhesive Market Outlook: Historical (2020 – 2025) and Forecast (2026 – 2033)
- Key Highlights
- Pricing Analysis
- South Asia & Oceania Market Size (US$ Bn) and Volume (Tons) Forecast, by Country, 2026-2033
- India
- Southeast Asia
- ANZ
- Rest of SAO
- South Asia & Oceania Market Size (US$ Bn) and Volume (Tons) Forecast, by Product Type, 2026-2033
- Ethylene Vinyl Acetate (EVA)
- Polyamide
- Polyolefin
- Polyurethane
- Styrene Block Copolymers (SBC)
- Silane Modified Polymers
- Other
- South Asia & Oceania Market Size (US$ Bn) and Volume (Tons) Forecast, by Technology, 2026-2033
- Thermoplastic Hot Melts
- Hot Melt Pressure Sensitive Adhesives (HMPSA)
- Reactive Hot Melts (RHMs)
- Others
- South Asia & Oceania Market Size (US$ Bn) and Volume (Tons) Forecast, by End-Use Industry, 2026-2033
- Packaging
- Woodworking
- Automotive
- Bookbinding & Graphic Arts
- Nonwoven & Hygiene
- Electronics & Electrical
- Footwear
- Aerospace
- Others
- South Asia & Oceania Market Size (US$ Bn) and Volume (Tons) Forecast, by Distribution Channel, 2026-2033
- Offline Retail
- Online Retail
- OEM
- Latin America Hot Melt Adhesive Market Outlook: Historical (2020 – 2025) and Forecast (2026 – 2033)
- Key Highlights
- Pricing Analysis
- Latin America Market Size (US$ Bn) and Volume (Tons) Forecast, by Country, 2026-2033
- Brazil
- Mexico
- Rest of LATAM
- Latin America Market Size (US$ Bn) and Volume (Tons) Forecast, by Product Type, 2026-2033
- Ethylene Vinyl Acetate (EVA)
- Polyamide
- Polyolefin
- Polyurethane
- Styrene Block Copolymers (SBC)
- Silane Modified Polymers
- Other
- Latin America Market Size (US$ Bn) and Volume (Tons) Forecast, by Technology, 2026-2033
- Thermoplastic Hot Melts
- Hot Melt Pressure Sensitive Adhesives (HMPSA)
- Reactive Hot Melts (RHMs)
- Others
- Latin America Market Size (US$ Bn) and Volume (Tons) Forecast, by End-Use Industry, 2026-2033
- Packaging
- Woodworking
- Automotive
- Bookbinding & Graphic Arts
- Nonwoven & Hygiene
- Electronics & Electrical
- Footwear
- Aerospace
- Others
- Latin America Market Size (US$ Bn) and Volume (Tons) Forecast, by Distribution Channel, 2026-2033
- Offline Retail
- Online Retail
- OEM
- Middle East & Africa Hot Melt Adhesive Market Outlook: Historical (2020 – 2025) and Forecast (2026 – 2033)
- Key Highlights
- Pricing Analysis
- Middle East & Africa Market Size (US$ Bn) and Volume (Tons) Forecast, by Country, 2026-2033
- GCC Countries
- South Africa
- Northern Africa
- Rest of MEA
- Middle East & Africa Market Size (US$ Bn) and Volume (Tons) Forecast, by Product Type, 2026-2033
- Ethylene Vinyl Acetate (EVA)
- Polyamide
- Polyolefin
- Polyurethane
- Styrene Block Copolymers (SBC)
- Silane Modified Polymers
- Other
- Middle East & Africa Market Size (US$ Bn) and Volume (Tons) Forecast, by Technology, 2026-2033
- Thermoplastic Hot Melts
- Hot Melt Pressure Sensitive Adhesives (HMPSA)
- Reactive Hot Melts (RHMs)
- Others
- Middle East & Africa Market Size (US$ Bn) and Volume (Tons) Forecast, by End-Use Industry, 2026-2033
- Packaging
- Woodworking
- Automotive
- Bookbinding & Graphic Arts
- Nonwoven & Hygiene
- Electronics & Electrical
- Footwear
- Aerospace
- Others
- Middle East & Africa Market Size (US$ Bn) and Volume (Tons) Forecast, by Distribution Channel, 2026-2033
- Offline Retail
- Online Retail
- OEM
- Competition Landscape
- Market Share Analysis, 2025
- Market Structure
- Competition Intensity Mapping
- Competition Dashboard
- Company Profiles
- DOW Inc.
- Company Overview
- Product Portfolio/Offerings
- Key Financials
- SWOT Analysis
- Company Strategy and Key Developments
- Arkema S.A.
- Avery Dennison Corporation
- 3M Company
- HB Fuller Company
- Henkel AG & Co. KGaA
- Jowat Se
- Sika AG
- ITW Performance Polymers
- Nanpow Resins Chemical Group
- Adtek Malaysia SDN BHD
- Buhnen GmbH & Co. Kg
- IFS Industries Inc.
- Evonik Industries AG
- Super Bond Adhesive Pvt. Ltd.
- Beardow Adams Ltd.
- Paramelt B.V.
- Tex Year Industries Inc.
- BioBond Adhesives
- DOW Inc.
- Appendix
- Research Methodology
- Research Assumptions
- Acronyms and Abbreviations

Loading page data
Please wait a moment


