


- Executive Summary
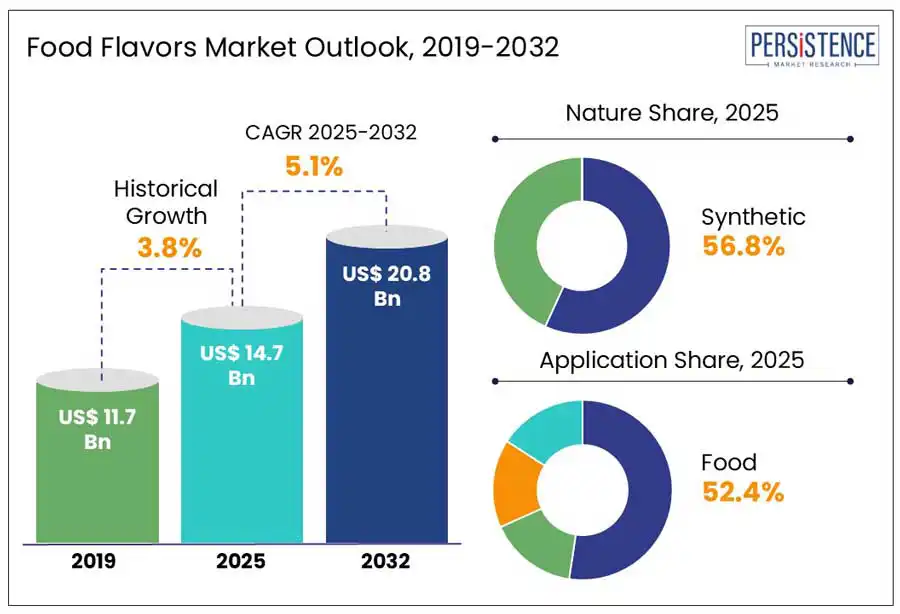
- Global Food Flavors Market Snapshot, 2025 and 2032
- Market Opportunity Assessment, 2025 - 2032, US$ Bn
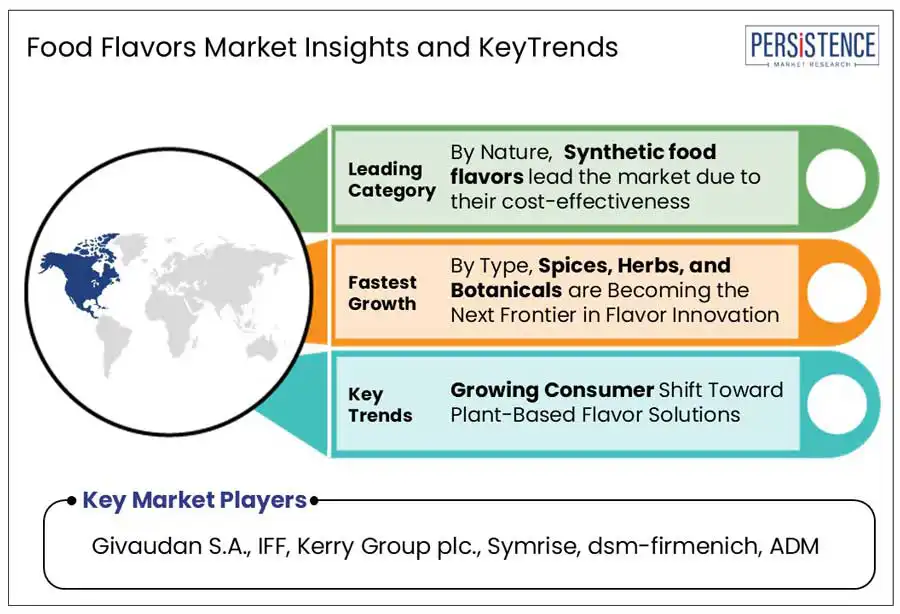
- Key Market Trends
- Future Market Projections
- Premium Market Insights
- Industry Developments and Key Market Events
- PMR Analysis and Recommendations
- Market Overview
- Market Scope and Definition
- Market Dynamics
- Drivers
- Restraints
- Opportunity
- Challenges
- Key Trends
- COVID-19 Impact Analysis
- Forecast Factors - Relevance and Impact
- Value Added Insights
- Value Chain Analysis
- Key Market Players
- Regulatory Landscape
- PESTLE Analysis
- Porter’s Five Force Analysis
- Price Trend Analysis, 2019 - 2032
- Pricing Analysis, By Type/Form/Nature
- Key Factors Impacting Product Prices
- Global Food Flavors Market Outlook
- Market Size (US$ Bn) Analysis and Forecast
- Historical Market Size (US$ Bn) Analysis, 2019-2024
- Market Size (US$ Bn) Analysis and Forecast, 2025-2032
- Global Food Flavors Market Outlook: Nature
- Historical Market Size (US$ Bn) Analysis, By Nature, 2019-2024
- Market Size (US$ Bn) Analysis and Forecast, By Nature, 2025-2032
- Natural
- Synthetic
- Market Attractiveness Analysis: Nature
- Global Food Flavors Market Outlook: Type
- Historical Market Size (US$ Bn) Analysis, By Type, 2019-2024
- Market Size (US$ Bn) Analysis and Forecast, By Type, 2025-2032
- Vanilla
- Cocoa
- Tea, Coffee
- Spices, Herbs & Botanicals
- Fruit and Vegetables
- Dairy
- Wine & Spirits
- Others
- Market Attractiveness Analysis: Type
- Global Food Flavors Market Outlook: Form
- Historical Market Size (US$ Bn) Analysis, By Form, 2019-2024
- Market Size (US$ Bn) Analysis and Forecast, By Form, 2025-2032
- Dry
- Liquid
- Gel
- Market Attractiveness Analysis: Form
- Global Food Flavors Market Outlook: Application
- Historical Market Size (US$ Bn) Analysis, By Application, 2019-2024
- Market Size (US$ Bn) Analysis and Forecast, By Application, 2025-2032
- Food
- Bakery & Confectionery
- Dairy Products
- Meat Products
- Snacks & Savory
- Sauces & Dressings
- Others
- Beverages
- Alcoholic Beverages
- Non-Alcoholic Beverages
- Animal Nutrition
- Others
- Food
- Market Attractiveness Analysis: Application
- Market Size (US$ Bn) Analysis and Forecast
- Global Food Flavors Market Outlook: Region
- Historical Market Size (US$ Bn) Analysis, By Region, 2019-2024
- Market Size (US$ Bn) Analysis and Forecast, By Region, 2025-2032
- North America
- Latin America
- Europe
- East Asia
- South Asia and Oceania
- Middle East & Africa
- Market Attractiveness Analysis: Region
- North America Food Flavors Market Outlook
- Historical Market Size (US$ Bn) Analysis, By Market, 2019-2024
- By Country
- By Nature
- By Type
- By Form
- By Application
- Market Size (US$ Bn) Analysis and Forecast, By Country, 2025-2032
- U.S.
- Canada
- Market Size (US$ Bn) Analysis and Forecast, By Nature, 2025-2032
- Natural
- Synthetic
- Market Size (US$ Bn) Analysis and Forecast, By Type, 2025-2032
- Vanilla
- Cocoa
- Tea, Coffee
- Spices, Herbs & Botanicals
- Fruit and Vegetables
- Dairy
- Wine & Spirits
- Others
- Market Size (US$ Bn) Analysis and Forecast, By Form, 2025-2032
- Dry
- Liquid
- Gel
- Market Size (US$ Bn) Analysis and Forecast, By Application, 2025-2032
- Food
- Bakery & Confectionery
- Dairy Products
- Meat Products
- Snacks & Savory
- Sauces & Dressings
- Others
- Beverages
- Alcoholic Beverages
- Non-Alcoholic Beverages
- Animal Nutrition
- Others
- Food
- Market Attractiveness Analysis
- Historical Market Size (US$ Bn) Analysis, By Market, 2019-2024
- Europe Food Flavors Market Outlook
- Historical Market Size (US$ Bn) Analysis, By Market, 2019-2024
- By Country
- By Nature
- By Type
- By Form
- By Application
- Market Size (US$ Bn) Analysis and Forecast, By Country, 2025-2032
- Germany
- France
- U.K.
- Italy
- Spain
- Russia
- Rest of Europe
- Market Size (US$ Bn) Analysis and Forecast, By Nature, 2025-2032
- Natural
- Synthetic
- Market Size (US$ Bn) Analysis and Forecast, By Type, 2025-2032
- Vanilla
- Cocoa
- Tea, Coffee
- Spices, Herbs & Botanicals
- Fruit and Vegetables
- Dairy
- Wine & Spirits
- Others
- Market Size (US$ Bn) Analysis and Forecast, By Form, 2025-2032
- Dry
- Liquid
- Gel
- Market Size (US$ Bn) Analysis and Forecast, By Application, 2025-2032
- Food
- Bakery & Confectionery
- Dairy Products
- Meat Products
- Snacks & Savory
- Sauces & Dressings
- Others
- Beverages
- Alcoholic Beverages
- Non-Alcoholic Beverages
- Animal Nutrition
- Others
- Food
- Market Attractiveness Analysis
- Historical Market Size (US$ Bn) Analysis, By Market, 2019-2024
- East Asia Food Flavors Market Outlook:
- Historical Market Size (US$ Bn) Analysis, By Market, 2019-2024
- By Country
- By Nature
- By Type
- By Form
- By Application
- Market Size (US$ Bn) Analysis and Forecast, By Country, 2025-2032
- China
- Japan
- South Korea
- Market Size (US$ Bn) Analysis and Forecast, By Nature, 2025-2032
- Natural
- Synthetic
- Market Size (US$ Bn) Analysis and Forecast, By Type, 2025-2032
- Vanilla
- Cocoa
- Tea, Coffee
- Spices, Herbs & Botanicals
- Fruit and Vegetables
- Dairy
- Wine & Spirits
- Others
- Market Size (US$ Bn) Analysis and Forecast, By Form, 2025-2032
- Dry
- Liquid
- Gel
- Market Size (US$ Bn) Analysis and Forecast, By Application, 2025-2032
- Food
- Bakery & Confectionery
- Dairy Products
- Meat Products
- Snacks & Savory
- Sauces & Dressings
- Others
- Beverages
- Alcoholic Beverages
- Non-Alcoholic Beverages
- Animal Nutrition
- Others
- Food
- Market Attractiveness Analysis
- Historical Market Size (US$ Bn) Analysis, By Market, 2019-2024
- South Asia & Oceania Food Flavors Market Outlook:
- Historical Market Size (US$ Bn) Analysis, By Market, 2019-2024
- By Country
- By Nature
- By Type
- By Form
- By Application
- Market Size (US$ Bn) Analysis and Forecast, By Country, 2025-2032
- India
- Indonesia
- Thailand
- Singapore
- ANZ
- Rest of South Asia & Oceania
- Market Size (US$ Bn) Analysis and Forecast, By Nature, 2025-2032
- Natural
- Synthetic
- Market Size (US$ Bn) Analysis and Forecast, By Type, 2025-2032
- Vanilla
- Cocoa
- Tea, Coffee
- Spices, Herbs & Botanicals
- Fruit and Vegetables
- Dairy
- Wine & Spirits
- Others
- Market Size (US$ Bn) Analysis and Forecast, By Form, 2025-2032
- Dry
- Liquid
- Gel
- Market Size (US$ Bn) Analysis and Forecast, By Application, 2025-2032
- Food
- Bakery & Confectionery
- Dairy Products
- Meat Products
- Snacks & Savory
- Sauces & Dressings
- Others
- Beverages
- Alcoholic Beverages
- Non-Alcoholic Beverages
- Animal Nutrition
- Others
- Food
- Market Attractiveness Analysis
- Historical Market Size (US$ Bn) Analysis, By Market, 2019-2024
- Latin America Food Flavors Market Outlook:
- Historical Market Size (US$ Bn) Analysis, By Market, 2019-2024
- By Country
- By Nature
- By Type
- By Form
- By Application
- Market Size (US$ Bn) Analysis and Forecast, By Country, 2025-2032
- Brazil
- Mexico
- Rest of Latin America
- Market Size (US$ Bn) Analysis and Forecast, By Nature, 2025-2032
- Natural
- Synthetic
- Market Size (US$ Bn) Analysis and Forecast, By Type, 2025-2032
- Vanilla
- Cocoa
- Tea, Coffee
- Spices, Herbs & Botanicals
- Fruit and Vegetables
- Dairy
- Wine & Spirits
- Others
- Market Size (US$ Bn) Analysis and Forecast, By Form, 2025-2032
- Dry
- Liquid
- Gel
- Market Size (US$ Bn) Analysis and Forecast, By Application, 2025-2032
- Food
- Bakery & Confectionery
- Dairy Products
- Meat Products
- Snacks & Savory
- Sauces & Dressings
- Others
- Beverages
- Alcoholic Beverages
- Non-Alcoholic Beverages
- Animal Nutrition
- Others
- Food
- Market Attractiveness Analysis
- Historical Market Size (US$ Bn) Analysis, By Market, 2019-2024
- Middle East & Africa Food Flavors Market Outlook:
- Historical Market Size (US$ Bn) Analysis, By Market, 2019-2024
- By Country
- By Nature
- By Type
- By Form
- By Application
- Market Size (US$ Bn) Analysis and Forecast, By Country, 2025-2032
- GCC Countries
- Egypt
- South Africa
- Northern Africa
- Rest of Middle East & Africa
- Market Size (US$ Bn) Analysis and Forecast, By Nature, 2025-2032
- Natural
- Synthetic
- Market Size (US$ Bn) Analysis and Forecast, By Type, 2025-2032
- Vanilla
- Cocoa
- Tea, Coffee
- Spices, Herbs & Botanicals
- Fruit and Vegetables
- Dairy
- Wine & Spirits
- Others
- Market Size (US$ Bn) Analysis and Forecast, By Form, 2025-2032
- Dry
- Liquid
- Gel
- Market Size (US$ Bn) Analysis and Forecast, By Application, 2025-2032
- Food
- Bakery & Confectionery
- Dairy Products
- Meat Products
- Snacks & Savory
- Sauces & Dressings
- Others
- Beverages
- Alcoholic Beverages
- Non-Alcoholic Beverages
- Animal Nutrition
- Others
- Food
- Market Attractiveness Analysis
- Historical Market Size (US$ Bn) Analysis, By Market, 2019-2024
- Competitive Landscape
- Market Share Analysis, 2025
- Market Structure
- Competition Intensity Mapping By Market
- Competition Dashboard
- Company Profiles (Details - Overview, Financials, Strategy, Recent Developments)
- Givaudan S.A.
- Overview
- Segments and Type
- Key Financials
- Market Developments
- Market Strategy
- IFF
- Kerry Group plc.
- Symrise
- Takasago International Corporation
- Sensient Technologies Corporation
- CP Ingredients
- McCormick & Company, Inc.
- dsm-firmenich
- Döhler GmbH
- Mane Group
- Corbion
- T. Hasegawa Co., Ltd.
- The Edlong Corporation
- Ingredion
- ADM
- Carbery Group
- Citromax Flavors
- Treatt Plc
- BASF
- Others
- Givaudan S.A.
- Appendix
- Research Methodology
- Research Assumptions
- Acronyms and Abbreviations

Loading page data
Please wait a moment


