


- Executive Summary
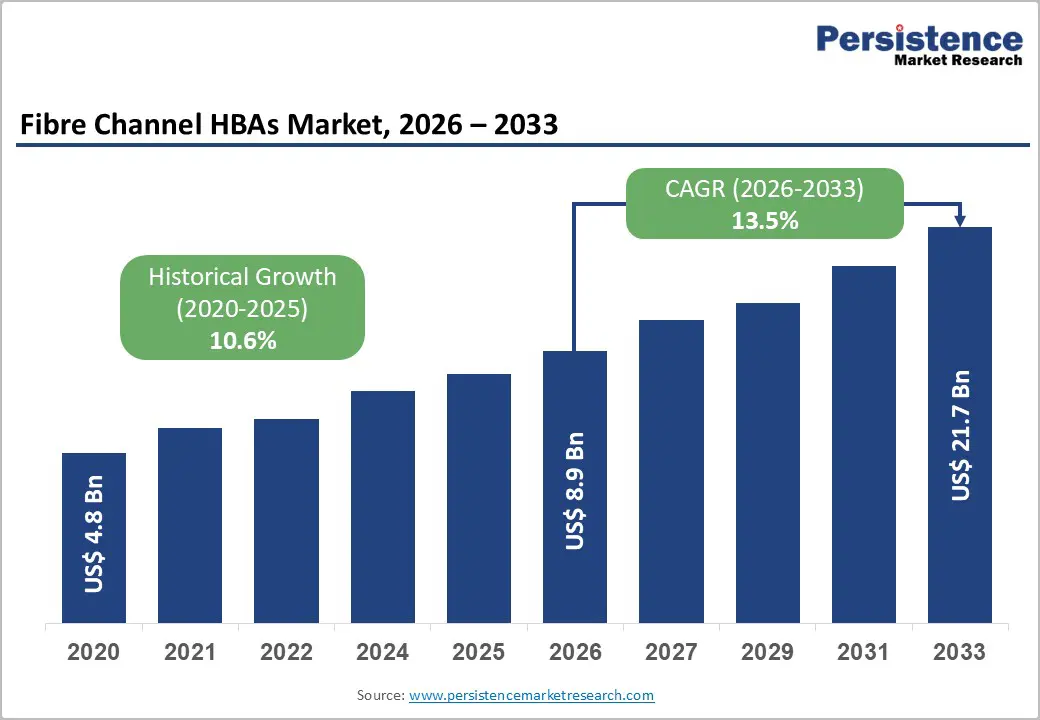
- Global Fibre Channel HBAs Market Snapshot 2026 and 2033
- Market Opportunity Assessment, 2026 - 2033, US$ Mn
- Key Market Trends
- Industry Developments and Key Market Events
- Demand Side and Supply Side Analysis
- PMR Analysis and Recommendations
- Market Overview
- Market Scope and Definitions
- Value Chain Analysis
- Macro - Economic Factors
- Global GDP Outlook
- Digital Transformation and ICT Penetration
- Infrastructure Development Outlook
- Data Consumption Growth
- Semiconductor Industry Outlook
- Cloud & Outsourcing Trends
- Forecast Factors - Relevance and Impact
- COVID-19 Impact Assessment
- PESTLE Analysis
- Porter's Five Forces Analysis
- Geopolitical Tensions: Market Impact
- Regulatory and Technology Landscape
- Market Dynamics
- Drivers
- Restraints
- Opportunities
- Trends
- Price Trend Analysis
- Price by Data Rate
- Price Impact Factors
- Global Fibre Channel HBAs Market Outlook: Historical (2020 - 2025) and Forecast (2026 - 2033)
- Key Highlights
- Global Fibre Channel HBAs Market Outlook: Port Configuration
- Introduction/Key Findings
- Historical Market Size (US$ Mn) Analysis by Port Configuration, 2020-2025
- Current Market Size (US$ Mn) Forecast, by Port Configuration, 2026-2033
- Single Port FC HBAs
- Dual Port FC HBAs
- Quad Port FC HBAs
- Market Attractiveness Analysis: Port Configuration
- Global Fibre Channel HBAs Market Outlook: Data Rate
- Introduction/Key Findings
- Historical Market Size (US$ Mn) Analysis by Data Rate, 2020-2025
- Current Market Size (US$ Mn) Forecast, by Data Rate, 2026-2033
- 8 GBPs
- 16 GBPs
- 32 GBPs
- 64 GBPs
- Others
- Market Attractiveness Analysis: Data Rate
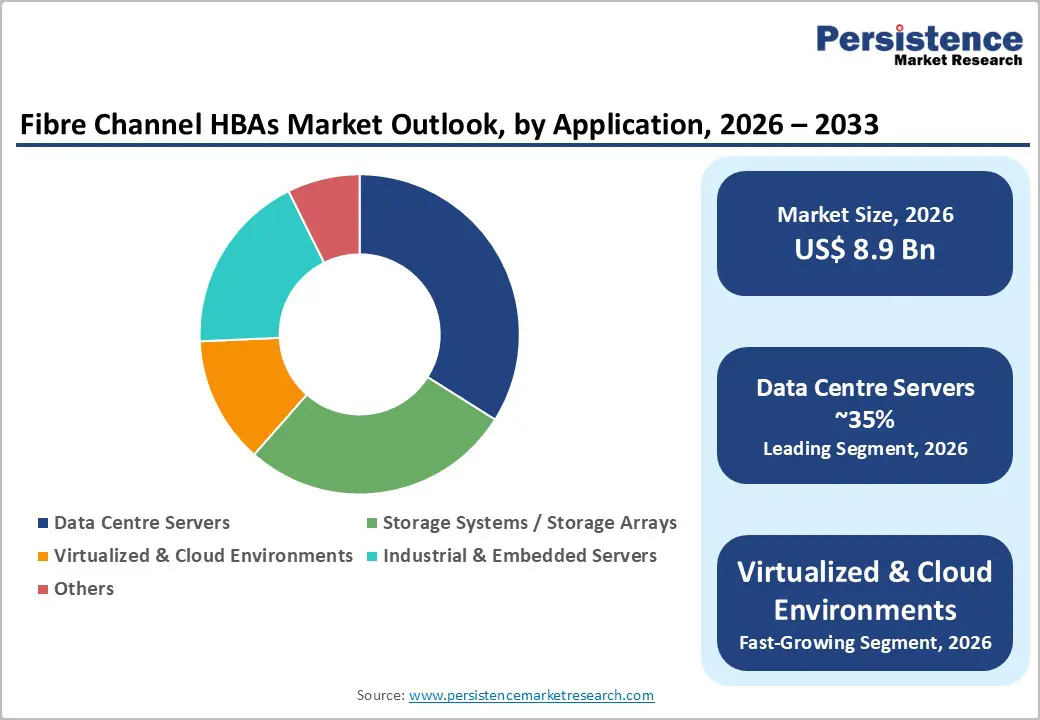
- Global Fibre Channel HBAs Market Outlook: Application
- Introduction/Key Findings
- Historical Market Size (US$ Mn) Analysis by Application, 2020-2025
- Current Market Size (US$ Mn) Forecast, by Application, 2026-2033
- Data Centre Servers
- Storage Systems / Storage Arrays
- Virtualized & Cloud Environments
- Industrial & Embedded Servers
- Others
- Market Attractiveness Analysis: Application
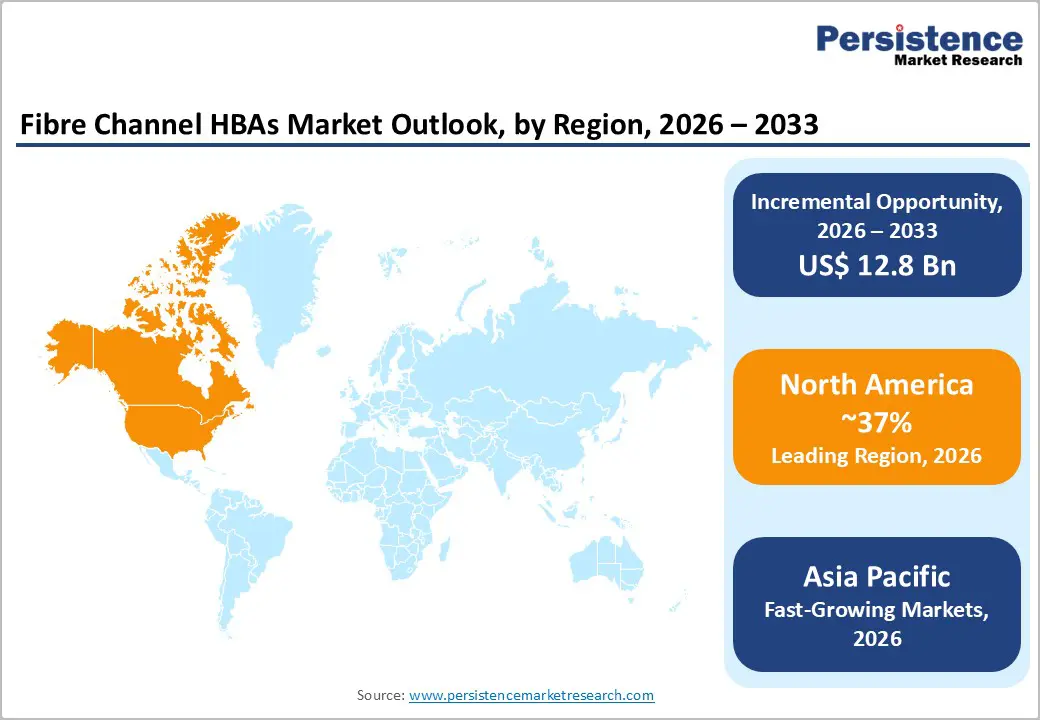
- Global Fibre Channel HBAs Market Outlook: Region
- Key Highlights
- Historical Market Size (US$ Mn) Analysis by Region, 2020-2025
- Current Market Size (US$ Mn) Forecast, by Region, 2026-2033
- North America
- Europe
- East Asia
- South Asia & Oceania
- Latin America
- Middle East & Africa
- Market Attractiveness Analysis: Region
- North America Fibre Channel HBAs Market Outlook: Historical (2020 - 2025) and Forecast (2026 - 2033)
- Key Highlights
- North America Market Size (US$ Mn) Forecast, by Country, 2026-2033
- U.S.
- Canada
- North America Market Size (US$ Mn) Forecast, by Port Configuration, 2026-2033
- Single Port FC HBAs
- Dual Port FC HBAs
- Quad Port FC HBAs
- North America Market Size (US$ Mn) Forecast, by Data Rate, 2026-2033
- 8 GBPs
- 16 GBPs
- 32 GBPs
- 64 GBPs
- Others
- North America Market Size (US$ Mn) Forecast, by Application, 2026-2033
- Data Centre Servers
- Storage Systems / Storage Arrays
- Virtualized & Cloud Environments
- Industrial & Embedded Servers
- Others
- Europe Fibre Channel HBAs Market Outlook: Historical (2020 - 2025) and Forecast (2026 - 2033)
- Key Highlights
- Europe Market Size (US$ Mn) Forecast, by Country, 2026-2033
- Germany
- Italy
- France
- U.K.
- Spain
- Russia
- Benelux
- Nordics
- Rest of Europe
- Europe Market Size (US$ Mn) Forecast, by Port Configuration, 2026-2033
- Single Port FC HBAs
- Dual Port FC HBAs
- Quad Port FC HBAs
- Europe Market Size (US$ Mn) Forecast, by Data Rate, 2026-2033
- 8 GBPs
- 16 GBPs
- 32 GBPs
- 64 GBPs
- Others
- Europe Market Size (US$ Mn) Forecast, by Application, 2026-2033
- Data Centre Servers
- Storage Systems / Storage Arrays
- Virtualized & Cloud Environments
- Industrial & Embedded Servers
- Others
- East Asia Fibre Channel HBAs Market Outlook: Historical (2020 - 2025) and Forecast (2026 - 2033)
- Key Highlights
- East Asia Market Size (US$ Mn) Forecast, by Country, 2026-2033
- China
- Japan
- South Korea
- East Asia Market Size (US$ Mn) Forecast, by Port Configuration, 2026-2033
- Single Port FC HBAs
- Dual Port FC HBAs
- Quad Port FC HBAs
- East Asia Market Size (US$ Mn) Forecast, by Data Rate, 2026-2033
- 8 GBPs
- 16 GBPs
- 32 GBPs
- 64 GBPs
- Others
- East Asia Market Size (US$ Mn) Forecast, by Application, 2026-2033
- Data Centre Servers
- Storage Systems / Storage Arrays
- Virtualized & Cloud Environments
- Industrial & Embedded Servers
- Others
- South Asia & Oceania Fibre Channel HBAs Market Outlook: Historical (2020 - 2025) and Forecast (2026 - 2033)
- Key Highlights
- South Asia & Oceania Market Size (US$ Mn) Forecast, by Country, 2026-2033
- India
- Southeast Asia
- ANZ
- Rest of SAO
- South Asia & Oceania Market Size (US$ Mn) Forecast, by Port Configuration, 2026-2033
- Single Port FC HBAs
- Dual Port FC HBAs
- Quad Port FC HBAs
- South Asia & Oceania Market Size (US$ Mn) Forecast, by Data Rate, 2026-2033
- 8 GBPs
- 16 GBPs
- 32 GBPs
- 64 GBPs
- Others
- South Asia & Oceania Market Size (US$ Mn) Forecast, by Application, 2026-2033
- Data Centre Servers
- Storage Systems / Storage Arrays
- Virtualized & Cloud Environments
- Industrial & Embedded Servers
- Others
- Latin America Fibre Channel HBAs Market Outlook: Historical (2020 - 2025) and Forecast (2026 - 2033)
- Key Highlights
- Latin America Market Size (US$ Mn) Forecast, by Country, 2026-2033
- Brazil
- Mexico
- Rest of LATAM
- Latin America Market Size (US$ Mn) Forecast, by Port Configuration, 2026-2033
- Single Port FC HBAs
- Dual Port FC HBAs
- Quad Port FC HBAs
- Latin America Market Size (US$ Mn) Forecast, by Data Rate, 2026-2033
- 8 GBPs
- 16 GBPs
- 32 GBPs
- 64 GBPs
- Others
- Latin America Market Size (US$ Mn) Forecast, by Application, 2026-2033
- Data Centre Servers
- Storage Systems / Storage Arrays
- Virtualized & Cloud Environments
- Industrial & Embedded Servers
- Others
- Middle East & Africa Fibre Channel HBAs Market Outlook: Historical (2020 - 2025) and Forecast (2026 - 2033)
- Key Highlights
- Middle East & Africa Market Size (US$ Mn) Forecast, by Country, 2026-2033
- GCC Countries
- South Africa
- Northern Africa
- Rest of MEA
- Middle East & Africa Market Size (US$ Mn) Forecast, by Port Configuration, 2026-2033
- Single Port FC HBAs
- Dual Port FC HBAs
- Quad Port FC HBAs
- Middle East & Africa Market Size (US$ Mn) Forecast, by Data Rate, 2026-2033
- 8 GBPs
- 16 GBPs
- 32 GBPs
- 64 GBPs
- Others
- Middle East & Africa Market Size (US$ Mn) Forecast, by Application, 2026-2033
- Data Centre Servers
- Storage Systems / Storage Arrays
- Virtualized & Cloud Environments
- Industrial & Embedded Servers
- Others
- Competition Landscape
- Market Share Analysis, 2025
- Market Structure
- Competition Intensity Mapping
- Competition Dashboard
- Company Profiles
- Broadcom
- Company Overview
- Product Portfolio/Offerings
- Key Financials
- SWOT Analysis
- Company Strategy and Key Developments
- IBM
- Dell Inc.
- Hewlett Packard Enterprise Development LP
- Marvell
- Lenovo
- ATTO Technology, Inc.
- Microchip Technology Inc.
- Fujitsu
- NVIDIA
- Huawei Technologies
- Abaco Systems Inc.
- Others
- Broadcom
- Appendix
- Research Methodology
- Research Assumptions
- Acronyms and Abbreviations

Loading page data
Please wait a moment


