


- Executive Summary
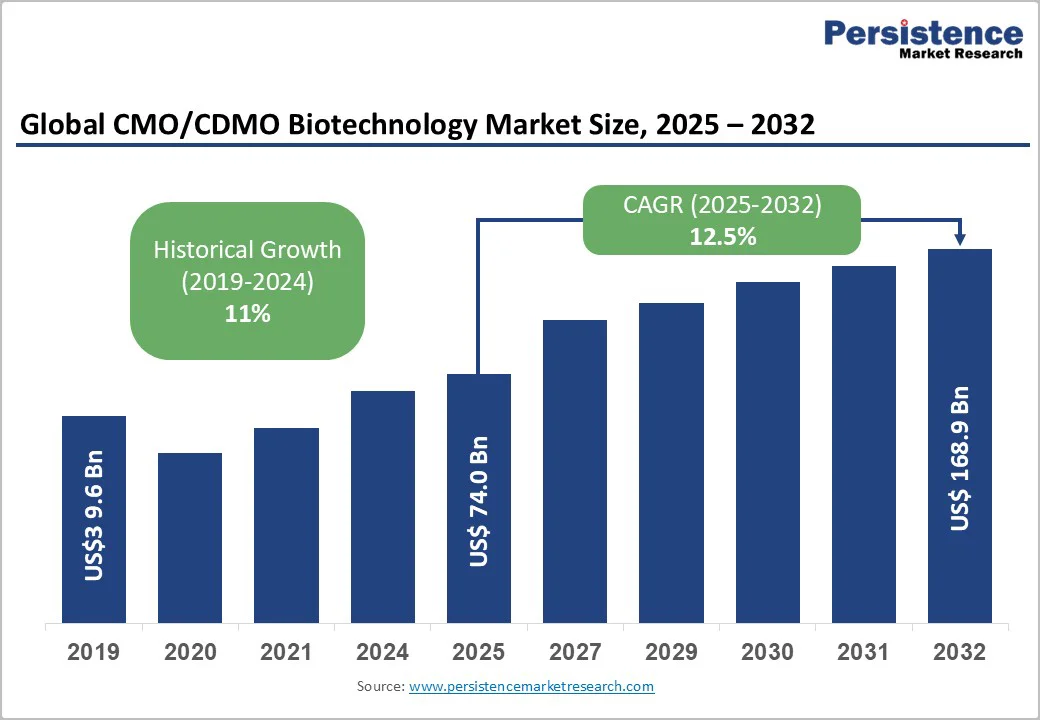
- Global CMO/CDMO Biotechnology Market Snapshot, 2025 and 2032
- Market Opportunity Assessment, 2025 - 2032, US$ Bn
- Key Market Trends
- Future Market Projections
- Premium Market Insights
- Product Type Developments and Key Market Events
- PMR Analysis and Recommendations
- Market Overview
- Market Scope and Definition
- Market Dynamics
- Drivers
- Restraints
- Opportunity
- Key Trends
- Macro-economic Factors
- Global Sectoral Outlook
- Global GDP Growth Outlook
- COVID-19 Impact Analysis
- Forecast Factors - Relevance and Impact
- Value Added Insights
- Tool Adoption Analysis
- Regulatory Landscape
- Value Chain Analysis
- PESTLE Analysis
- Porter’s Five Force Analysis
- Price Analysis, 2024A
- Key Highlights
- Key Factors Impacting Deployment Costs
- Pricing Analysis, By Product Type
- Global CMO/CDMO Biotechnology Market Outlook
- Key Highlights
- Market Volume (Units) Projections
- Market Size (US$ Bn) and Y-o-Y Growth
- Absolute $ Opportunity
- Market Size (US$ Bn) and Volume (Units) Analysis and Forecast
- Historical Market Size (US$ Bn) Analysis, 2019-2024
- Current Market Size (US$ Bn) Analysis and Forecast, 2025 - 2032
- Global CMO/CDMO Biotechnology Market Outlook: Service Type
- Introduction / Key Findings
- Historical Market Size (US$ Bn) and Volume (Units) Analysis, By Service Type, 2019 - 2024
- Current Market Size (US$ Bn) and Volume (Units) Analysis and Forecast, By Service Type, 2025 - 2032
- Standalone Services
- Integrated Contract Development & Manufacturing Services
- Contract Manufacturing Services
- Market Attractiveness Analysis: Service Type
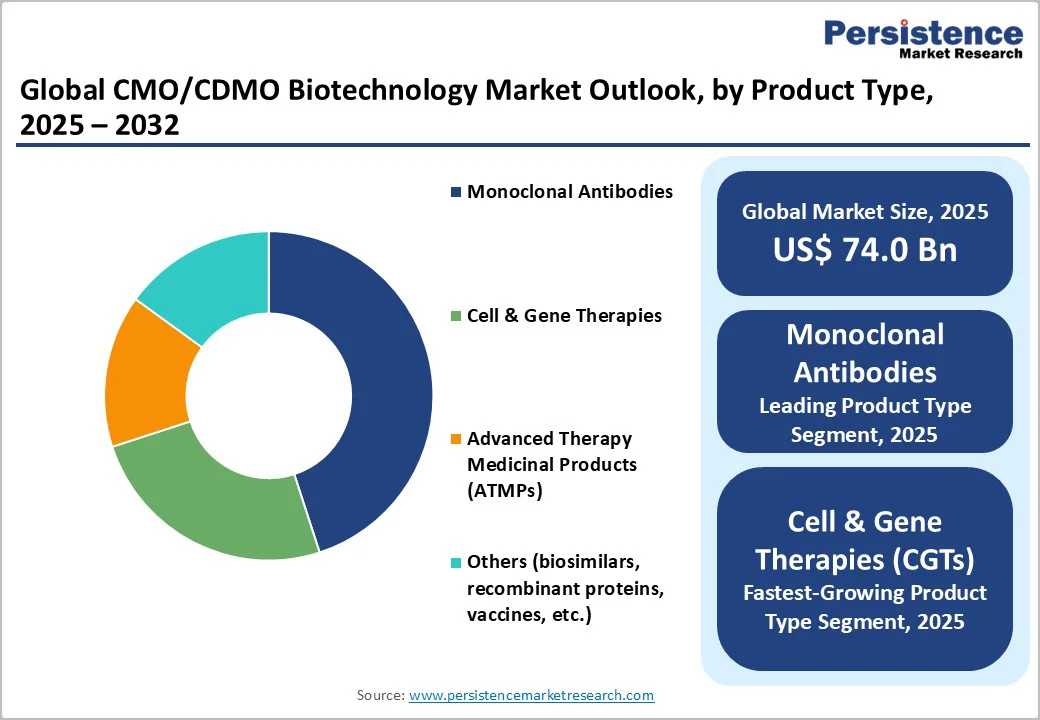
- Global CMO/CDMO Biotechnology Market Outlook: Product Type
- Introduction / Key Findings
- Historical Market Size (US$ Bn) Analysis, By Product Type, 2019 - 2024
- Current Market Size (US$ Bn) Analysis and Forecast, By Product Type, 2025 - 2032
- Monoclonal Antibodies
- Cell & Gene Therapies (CGTs)
- Advanced Therapy Medicinal Products (ATMPs)
- Others
- Market Attractiveness Analysis: Product Type
- Global CMO/CDMO Biotechnology Market Outlook: Scale of Operation
- Introduction / Key Findings
- Historical Market Size (US$ Bn) Analysis, By Scale of Operation, 2019 - 2024
- Current Market Size (US$ Bn) Analysis and Forecast, By Scale of Operation, 2025 - 2032
- Small Scale/Pilot Production
- Large Scale/Commercial Manufacturing
- Market Attractiveness Analysis: Scale of Operation
- Key Highlights
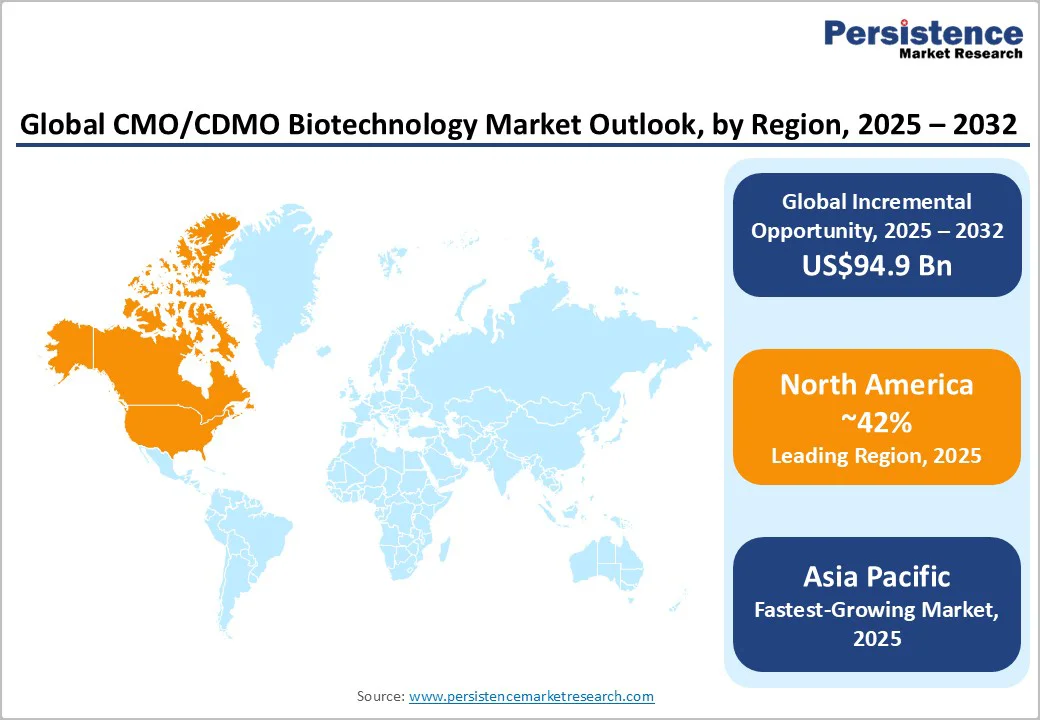
- Global CMO/CDMO Biotechnology Market Outlook: Region
- Key Highlights
- Historical Market Size (US$ Bn) and Volume (Units) Analysis, By Region, 2019 - 2024
- Current Market Size (US$ Bn) and Volume (Units) Analysis and Forecast, By Region, 2025 - 2032
- North America
- Europe
- East Asia
- South Asia and Oceania
- Latin America
- Middle East & Africa
- Market Attractiveness Analysis: Region
- North America CMO/CDMO Biotechnology Market Outlook
- Key Highlights
- Historical Market Size (US$ Bn) Analysis, By Market, 2019 - 2024
- By Country
- By Service Type
- By Product Type
- By Scale of Operation
- Current Market Size (US$ Bn) Analysis and Forecast, By Country, 2025 - 2032
- U.S.
- Canada
- Current Market Size (US$ Bn) and Volume (Units) Analysis and Forecast, By Service Type, 2025 - 2032
- Standalone Services
- Integrated Contract Development & Manufacturing Services
- Contract Manufacturing Services
- Current Market Size (US$ Bn) Analysis and Forecast, By Product Type, 2025 - 2032
- Monoclonal Antibodies
- Cell & Gene Therapies (CGTs)
- Advanced Therapy Medicinal Products (ATMPs)
- Others
- Current Market Size (US$ Bn) Analysis and Forecast, By Scale of Operation, 2025-2032
- Small Scale/Pilot Production
- Large Scale/Commercial Manufacturing
- Market Attractiveness Analysis
- Europe CMO/CDMO Biotechnology Market Outlook
- Key Highlights
- Historical Market Size (US$ Bn) Analysis, By Market, 2019 - 2024
- By Country
- By Service Type
- By Product Type
- Scale of Operation
- Current Market Size (US$ Bn) Analysis and Forecast, By Country, 2025 - 2032
- Germany
- France
- U.K.
- Italy
- Spain
- Russia
- Türkiye
- Rest of Europe
- Current Market Size (US$ Bn) and Volume (Units) Analysis and Forecast, By Service Type, 2025 - 2032
- Standalone Services
- Integrated Contract Development & Manufacturing Services
- Contract Manufacturing Services
- Current Market Size (US$ Bn) Analysis and Forecast, By Product Type, 2025 - 2032
- Monoclonal Antibodies
- Cell & Gene Therapies (CGTs)
- Advanced Therapy Medicinal Products (ATMPs)
- Others
- Current Market Size (US$ Bn) Analysis and Forecast, By Scale of Operation, 2025-2032
- Small Scale/Pilot Production
- Large Scale/Commercial Manufacturing
- Market Attractiveness Analysis
- East Asia CMO/CDMO Biotechnology Market Outlook
- Key Highlights
- Historical Market Size (US$ Bn) Analysis, By Market, 2019 - 2024
- By Country
- By Service Type
- By Product Type
- By Scale of Operation
- Current Market Size (US$ Bn) Analysis and Forecast, By Country, 2025 - 2032
- China
- Japan
- South Korea
- Current Market Size (US$ Bn) and Volume (Units) Analysis and Forecast, By Service Type, 2025 - 2032
- Standalone Services
- Integrated Contract Development & Manufacturing Services
- Contract Manufacturing Services
- Current Market Size (US$ Bn) Analysis and Forecast, By Product Type, 2025 - 2032
- Monoclonal Antibodies
- Cell & Gene Therapies (CGTs)
- Advanced Therapy Medicinal Products (ATMPs)
- Others
- Current Market Size (US$ Bn) Analysis and Forecast, By Scale of Operation, 2025-2032
- Small Scale/Pilot Production
- Large Scale/Commercial Manufacturing
- Market Attractiveness Analysis
- South Asia & Oceania CMO/CDMO Biotechnology Market Outlook
- Key Highlights
- Historical Market Size (US$ Bn) Analysis, By Market, 2019 - 2024
- By Country
- By Service Type
- By Product Type
- By Scale of Operation
- Current Market Size (US$ Bn) Analysis and Forecast, By Country, 2025 - 2032
- India
- Southeast Asia
- ANZ
- Rest of South Asia & Oceania
- Current Market Size (US$ Bn) and Volume (Units) Analysis and Forecast, By Service Type, 2025 - 2032
- Standalone Services
- Integrated Contract Development & Manufacturing Services
- Contract Manufacturing Services
- ICurrent Market Size (US$ Bn) Analysis and Forecast, By Product Type, 2025 - 2032
- Monoclonal Antibodies
- Cell & Gene Therapies (CGTs)
- Advanced Therapy Medicinal Products (ATMPs)
- Others
- Current Market Size (US$ Bn) Analysis and Forecast, By Scale of Operation, 2025-2032
- Small Scale/Pilot Production
- Large Scale/Commercial Manufacturing
- Market Attractiveness Analysis
- Latin America CMO/CDMO Biotechnology Market Outlook
- Key Highlights
- Historical Market Size (US$ Bn) Analysis, By Market, 2019 - 2024
- By Country
- By Service Type
- By Product Type
- By Scale of Operation
- Current Market Size (US$ Bn) Analysis and Forecast, By Country, 2025 - 2032
- Brazil
- Mexico
- Rest of Latin America
- Current Market Size (US$ Bn) and Volume (Units) Analysis and Forecast, By Service Type, 2025 - 2032
- Standalone Services
- Integrated Contract Development & Manufacturing Services
- Contract Manufacturing Services
- Current Market Size (US$ Bn) Analysis and Forecast, By Product Type, 2025 - 2032
- Monoclonal Antibodies
- Cell & Gene Therapies (CGTs)
- Advanced Therapy Medicinal Products (ATMPs)
- Others
- Current Market Size (US$ Bn) Analysis and Forecast, By Scale of Operation, 2025-2032
- Small Scale/Pilot Production
- Large Scale/Commercial Manufacturing
- Market Attractiveness Analysis
- Middle East & Africa CMO/CDMO Biotechnology Market Outlook
- Key Highlights
- Historical Market Size (US$ Bn) Analysis, By Market, 2019 - 2024
- By Country
- By Service Type
- By Product Type
- By Scale of Operation
- Current Market Size (US$ Bn) Analysis and Forecast, By Country, 2025 - 2032
- GCC Countries
- Egypt
- South Africa
- Northern Africa
- Rest of Middle East & Africa
- Current Market Size (US$ Bn) and Volume (Units) Analysis and Forecast, By Service Type, 2025 - 2032
- Standalone Services
- Integrated Contract Development & Manufacturing Services
- Contract Manufacturing Services
- Current Market Size (US$ Bn) Analysis and Forecast, By Product Type, 2025 - 2032
- Monoclonal Antibodies
- Cell & Gene Therapies (CGTs)
- Advanced Therapy Medicinal Products (ATMPs)
- Others
- Current Market Size (US$ Bn) Analysis and Forecast, By Scale of Operation, 2025-2032
- Small Scale/Pilot Production
- Large Scale/Commercial Manufacturing
- Market Attractiveness Analysis
- Competition Landscape
- Market Share Analysis, 2024
- Market Structure
- Competition Intensity Mapping By Market
- Competition Dashboard
- Company Profiles (Details - Overview, Financials, Strategy, Recent Developments)
- Lonza Group AG
- Overview
- Segments and Deployments
- Key Financials
- Market Developments
- Market Strategy
- Thermo Fisher Scientific Inc.
- Samsung Biologics Co., Ltd.
- Boehringer Ingelheim International GmbH
- AGC Biologics, Inc.
- WuXi Biologics
- Patheon N.V.
- Catalent, Inc.
- AbbVie Inc.
- Avid Bioservices, Inc.
- Fujifilm Diosynth Biotechnologies
- Rentschler Biopharma SE
- KBI Biopharma (JSR Corporation)
- Cytovance Biologics
- Xpress Biologic
- Lonza Group AG
- Appendix
- Research Methodology
- Research Assumptions
- Acronyms and Abbreviations

Loading page data
Please wait a moment


