

- Executive Summary
- Global Chromatographic Silica Resins Market Snapshot 2026 and 2033
- Market Opportunity Assessment, 2026 - 2033, US$ Bn
- Key Market Trends
- Industry Developments and Key Market Events
- Demand Side and Supply Side Analysis
- PMR Analysis and Recommendations
- Market Overview
- Market Scope and Definitions
- Value Chain Analysis
- Macro-Economic Factors
- Global GDP Outlook
- Global Pharmaceutical Industry Overview
- Global Biotechnology Industry Overview
- Forecast Factors - Relevance and Impact
- COVID-19 Impact Assessment
- PESTLE Analysis
- Porter's Five Forces Analysis
- Geopolitical Tensions: Market Impact
- Regulatory and Technology Landscape
- Market Dynamics
- Drivers
- Restraints
- Opportunities
- Trends
- Price Trend Analysis, 2020 - 2033
- Region-wise Price Analysis
- Price by Segments
- Price Impact Factors
- Global Chromatographic Silica Resins Market Outlook: Historical (2020 - 2025) and Forecast (2026 - 2033)
- Key Highlights
- Global Chromatographic Silica Resins Market Outlook: Mesh Size
- Introduction/Key Findings
- Historical Market Size (US$ Bn) and Volume (Tons) Analysis by Mesh Size, 2020-2025
- Current Market Size (US$ Bn) and Volume (Tons) Forecast, by Mesh Size, 2026-2033
- 30-60
- 60-100
- 100-200
- Above 200
- Market Attractiveness Analysis: Mesh Size
- Global Chromatographic Silica Resins Market Outlook: Purity
- Introduction/Key Findings
- Historical Market Size (US$ Bn) and Volume (Tons) Analysis by Purity, 2020-2025
- Current Market Size (US$ Bn) and Volume (Tons) Forecast, by Purity, 2026-2033
- Pure Silica (up to 97%)
- Ultrapure Silica (up to 99%)
- Market Attractiveness Analysis: Purity
- Global Chromatographic Silica Resins Market Outlook: Application
- Introduction/Key Findings
- Historical Market Size (US$ Bn) and Volume (Tons) Analysis by Application, 2020-2025
- Current Market Size (US$ Bn) and Volume (Tons) Forecast, by Application, 2026-2033
- Analytical Chromatography
- Process Chromatography
- Preparative Chromatography
- Gravity Chromatography
- Market Attractiveness Analysis: Application
- Global Chromatographic Silica Resins Market Outlook: End Use
- Introduction/Key Findings
- Historical Market Size (US$ Bn) and Volume (Tons) Analysis by End Use, 2020-2025
- Current Market Size (US$ Bn) and Volume (Tons) Forecast, by End Use, 2026-2033
- Laboratories
- Research Institutions
- Pharmaceutical Companies
- Food Industry
- Environmental Agencies
- Market Attractiveness Analysis: End Use
- Global Chromatographic Silica Resins Market Outlook: Industry
- Introduction/Key Findings
- Historical Market Size (US$ Bn) and Volume (Tons) Analysis by Industry, 2020-2025
- Current Market Size (US$ Bn) and Volume (Tons) Forecast, by Industry, 2026-2033
- I1
- I2
- Market Attractiveness Analysis: Industry
- Global Chromatographic Silica Resins Market Outlook: Region
- Key Highlights
- Historical Market Size (US$ Bn) and Volume (Tons) Analysis by Region, 2020-2025
- Current Market Size (US$ Bn) and Volume (Tons) Forecast, by Region, 2026-2033
- North America
- Europe
- East Asia
- South Asia & Oceania
- Latin America
- Middle East & Africa
- Market Attractiveness Analysis: Region
- North America Chromatographic Silica Resins Market Outlook: Historical (2020 - 2025) and Forecast (2026 - 2033)
- Key Highlights
- Pricing Analysis
- North America Market Size (US$ Bn) and Volume (Tons) Forecast, by Country, 2026-2033
- U.S.
- Canada
- North America Market Size (US$ Bn) and Volume (Tons) Forecast, by Mesh Size, 2026-2033
- 30-60
- 60-100
- 100-200
- Above 200
- North America Market Size (US$ Bn) and Volume (Tons) Forecast, by Purity, 2026-2033
- Pure Silica (up to 97%)
- Ultrapure Silica (up to 99%)
- North America Market Size (US$ Bn) and Volume (Tons) Forecast, by Application, 2026-2033
- Analytical Chromatography
- Process Chromatography
- Preparative Chromatography
- Gravity Chromatography
- North America Market Size (US$ Bn) and Volume (Tons) Forecast, by End Use, 2026-2033
- Laboratories
- Research Institutions
- Pharmaceutical Companies
- Food Industry
- Environmental Agencies
- North America Market Size (US$ Bn) and Volume (Tons) Forecast, by Industry, 2026-2033
- I1
- I2
- Europe Chromatographic Silica Resins Market Outlook: Historical (2020 - 2025) and Forecast (2026 - 2033)
- Key Highlights
- Pricing Analysis
- Europe Market Size (US$ Bn) and Volume (Tons) Forecast, by Country, 2026-2033
- Germany
- Italy
- France
- U.K.
- Spain
- Russia
- Rest of Europe
- Europe Market Size (US$ Bn) and Volume (Tons) Forecast, by Mesh Size, 2026-2033
- 30-60
- 60-100
- 100-200
- Above 200
- Europe Market Size (US$ Bn) and Volume (Tons) Forecast, by Purity, 2026-2033
- Pure Silica (up to 97%)
- Ultrapure Silica (up to 99%)
- Europe Market Size (US$ Bn) and Volume (Tons) Forecast, by Application, 2026-2033
- Analytical Chromatography
- Process Chromatography
- Preparative Chromatography
- Gravity Chromatography
- Europe Market Size (US$ Bn) and Volume (Tons) Forecast, by End Use, 2026-2033
- Laboratories
- Research Institutions
- Pharmaceutical Companies
- Food Industry
- Environmental Agencies
- Europe Market Size (US$ Bn) and Volume (Tons) Forecast, by Industry, 2026-2033
- I1
- I2
- East Asia Chromatographic Silica Resins Market Outlook: Historical (2020 - 2025) and Forecast (2026 - 2033)
- Key Highlights
- Pricing Analysis
- East Asia Market Size (US$ Bn) and Volume (Tons) Forecast, by Country, 2026-2033
- China
- Japan
- South Korea
- East Asia Market Size (US$ Bn) and Volume (Tons) Forecast, by Mesh Size, 2026-2033
- 30-60
- 60-100
- 100-200
- Above 200
- East Asia Market Size (US$ Bn) and Volume (Tons) Forecast, by Purity, 2026-2033
- Pure Silica (up to 97%)
- Ultrapure Silica (up to 99%)
- East Asia Market Size (US$ Bn) and Volume (Tons) Forecast, by Application, 2026-2033
- Analytical Chromatography
- Process Chromatography
- Preparative Chromatography
- Gravity Chromatography
- East Asia Market Size (US$ Bn) and Volume (Tons) Forecast, by End Use, 2026-2033
- Laboratories
- Research Institutions
- Pharmaceutical Companies
- Food Industry
- Environmental Agencies
- East Asia Market Size (US$ Bn) and Volume (Tons) Forecast, by Industry, 2026-2033
- I1
- I2
- South Asia & Oceania Chromatographic Silica Resins Market Outlook: Historical (2020 - 2025) and Forecast (2026 - 2033)
- Key Highlights
- Pricing Analysis
- South Asia & Oceania Market Size (US$ Bn) and Volume (Tons) Forecast, by Country, 2026-2033
- India
- Southeast Asia
- ANZ
- Rest of SAO
- South Asia & Oceania Market Size (US$ Bn) and Volume (Tons) Forecast, by Mesh Size, 2026-2033
- 30-60
- 60-100
- 100-200
- Above 200
- South Asia & Oceania Market Size (US$ Bn) and Volume (Tons) Forecast, by Purity, 2026-2033
- Pure Silica (up to 97%)
- Ultrapure Silica (up to 99%)
- South Asia & Oceania Market Size (US$ Bn) and Volume (Tons) Forecast, by Application, 2026-2033
- Analytical Chromatography
- Process Chromatography
- Preparative Chromatography
- Gravity Chromatography
- South Asia & Oceania Market Size (US$ Bn) and Volume (Tons) Forecast, by End Use, 2026-2033
- Laboratories
- Research Institutions
- Pharmaceutical Companies
- Food Industry
- Environmental Agencies
- South Asia & Oceania Market Size (US$ Bn) and Volume (Tons) Forecast, by Industry, 2026-2033
- I1
- I2
- Latin America Chromatographic Silica Resins Market Outlook: Historical (2020 - 2025) and Forecast (2026 - 2033)
- Key Highlights
- Pricing Analysis
- Latin America Market Size (US$ Bn) and Volume (Tons) Forecast, by Country, 2026-2033
- Brazil
- Mexico
- Rest of LATAM
- Latin America Market Size (US$ Bn) and Volume (Tons) Forecast, by Mesh Size, 2026-2033
- 30-60
- 60-100
- 100-200
- Above 200
- Latin America Market Size (US$ Bn) and Volume (Tons) Forecast, by Purity, 2026-2033
- Pure Silica (up to 97%)
- Ultrapure Silica (up to 99%)
- Latin America Market Size (US$ Bn) and Volume (Tons) Forecast, by Application, 2026-2033
- Analytical Chromatography
- Process Chromatography
- Preparative Chromatography
- Gravity Chromatography
- Latin America Market Size (US$ Bn) and Volume (Tons) Forecast, by End Use, 2026-2033
- Laboratories
- Research Institutions
- Pharmaceutical Companies
- Food Industry
- Environmental Agencies
- Latin America Market Size (US$ Bn) and Volume (Tons) Forecast, by Industry, 2026-2033
- I1
- I2
- Middle East & Africa Chromatographic Silica Resins Market Outlook: Historical (2020 - 2025) and Forecast (2026 - 2033)
- Key Highlights
- Pricing Analysis
- Middle East & Africa Market Size (US$ Bn) and Volume (Tons) Forecast, by Country, 2026-2033
- GCC Countries
- South Africa
- Northern Africa
- Rest of MEA
- Middle East & Africa Market Size (US$ Bn) and Volume (Tons) Forecast, by Mesh Size, 2026-2033
- 30-60
- 60-100
- 100-200
- Above 200
- Middle East & Africa Market Size (US$ Bn) and Volume (Tons) Forecast, by Purity, 2026-2033
- Pure Silica (up to 97%)
- Ultrapure Silica (up to 99%)
- Middle East & Africa Market Size (US$ Bn) and Volume (Tons) Forecast, by Application, 2026-2033
- Analytical Chromatography
- Process Chromatography
- Preparative Chromatography
- Gravity Chromatography
- Middle East & Africa Market Size (US$ Bn) and Volume (Tons) Forecast, by End Use, 2026-2033
- Laboratories
- Research Institutions
- Pharmaceutical Companies
- Food Industry
- Environmental Agencies
- Middle East & Africa Market Size (US$ Bn) and Volume (Tons) Forecast, by Industry, 2026-2033
- I1
- I2
- Competition Landscape
- Market Share Analysis, 2025
- Market Structure
- Competition Intensity Mapping
- Competition Dashboard
- Company Profiles
- W.R. Grace and Company
- Company Overview
- Product Portfolio/Offerings
- Key Financials
- SWOT Analysis
- Company Strategy and Key Developments
- Osaka Soda Co. Limited
- Alfa Aesar
- Merck KGaA
- AGC Group
- SiliCycle Inc.
- Sorbead India
- Sepax Technologies Inc.
- Tosoh Corporation
- Repligen Corporation
- Bio-Rad Laboratories Inc.
- W.R. Grace and Company
- Appendix
- Research Methodology
- Research Assumptions
- Acronyms and Abbreviations


- Specialty & Fine Chemicals
- Chromatographic Silica Resins Market
Chromatographic Silica Resins Market Size, Share, and Growth Forecast 2026 - 2033
Chromatographic Silica Resins Market by Mesh Size (30-60, 60-100, 100-200, and Above 200), Purity (Pure Silica (up to 97%) and Ultrapure Silica (up to 99%)), Application (Analytical Chromatography, Process Chromatography, Preparative Chromatography, and Gravity Chromatography), End-user (Laboratories, Research Institutions, Pharmaceutical Companies, and Others), and Regional Analysis, 2026 - 2033
Key Market Highlights
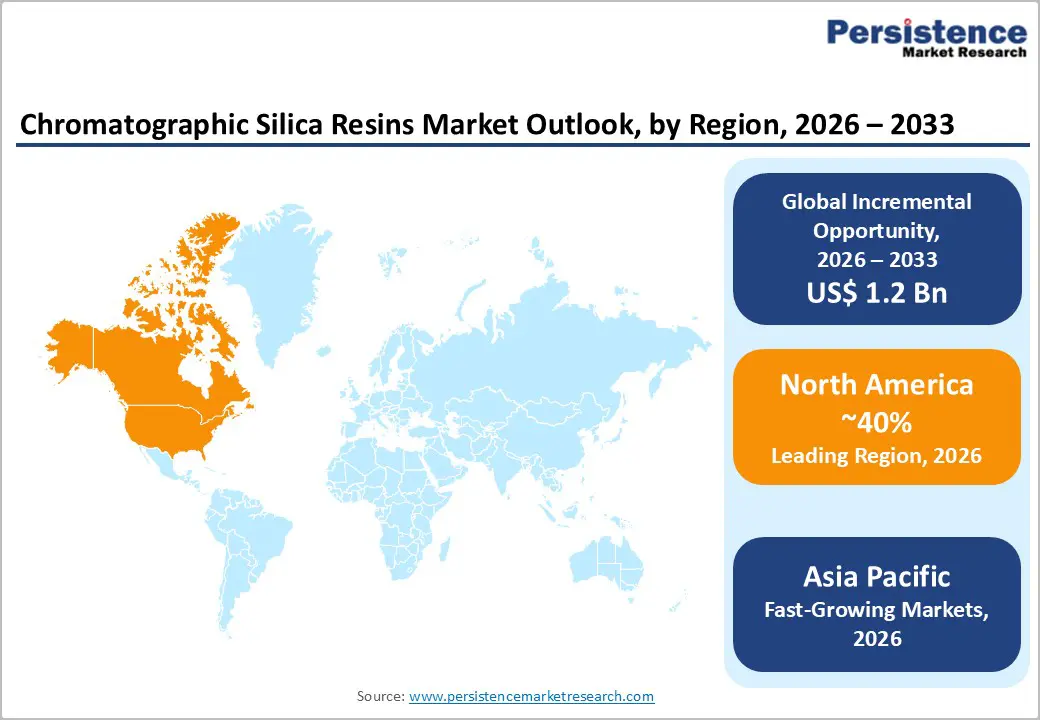
- Leading Region: North America dominates the global chromatographic silica resins market with 40% market share (2026), supported by robust pharmaceutical and biotechnology infrastructure, substantial R&D investments, and advanced laboratory capabilities concentrated in the United States.
- Fastest-Growing Region: Asia Pacific exhibits the highest growth trajectory, expanding at an 8.5% CAGR through 2033, driven by China's expansion of pharmaceutical production and India's growth in the pharmaceutical sector, which together support emerging pharmaceutical supply chains.
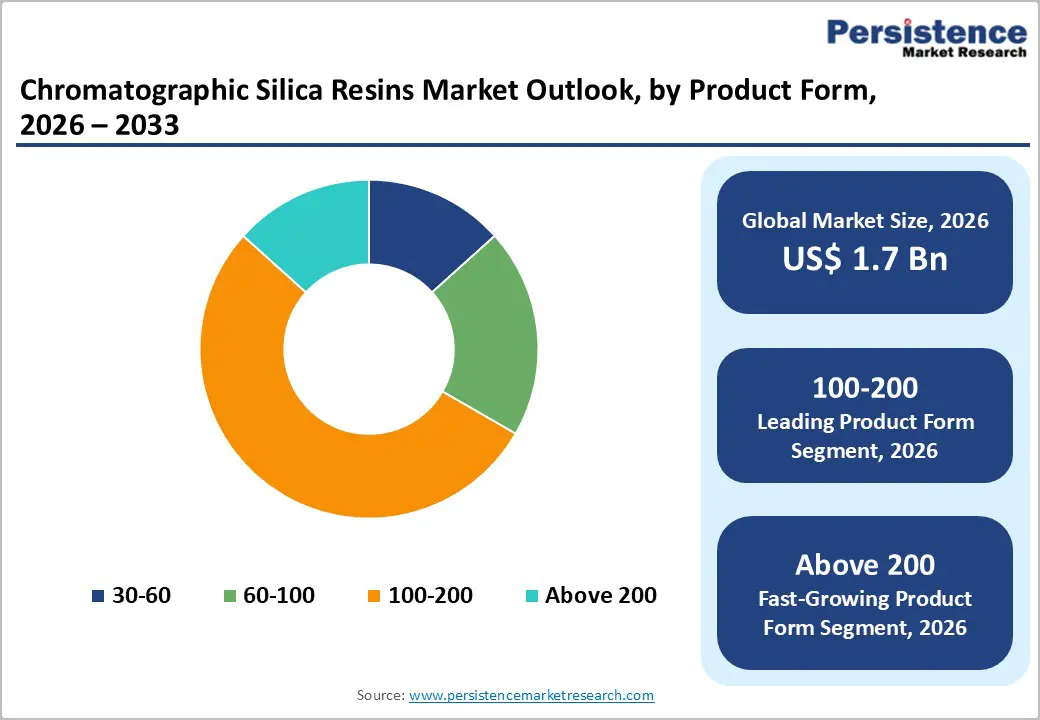
- Dominant Mesh Size: 100-200 mesh chromatographic silica resins capture a 35% market share in this mesh size category, owing to their universal applicability in analytical and preparative chromatography and their optimal balance of particle size, surface area, and chromatographic efficiency.
- Growing Segment: The analytical chromatography application segment expands at 7.8% CAGR, supported by pharmaceutical development activities, quality control requirements, and regulatory testing protocols, driving consistent demand for high-performance chromatographic resins.
- Key Market Opportunity: Lipid Nanoparticle (LNP) Purification for mRNA Vaccine Manufacturing represents the highest-growth opportunity, driven by biopharmaceutical manufacturing demand for ultrapure silica resins and the creation of premium-margin applications.
| Key Insights | Details |
|---|---|
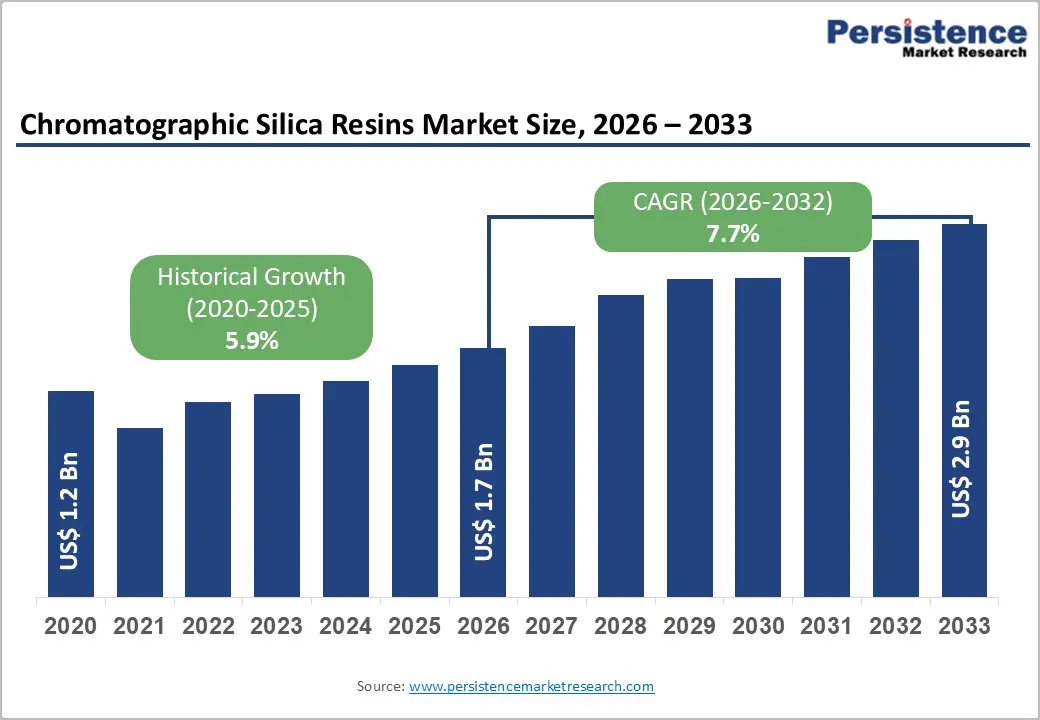
| Chromatographic Silica Resins Market Size (2026E) | US$ 1.7 Bn |
| Market Value Forecast (2033F) | US$ 2.9 Bn |
| Projected Growth CAGR (2026 - 2033) | 7.7% |
| Historical Market Growth (2020 - 2025) | 5.9% |
Market Dynamics
Drivers - Expanding Pharmaceutical and Biopharmaceutical Industry Demand for Drug Development and Purification
The continued expansion of the pharmaceutical and biopharmaceutical industries, particularly their intensified focus on innovative drug development and rigorous purification requirements, is one of the key growth drivers for the global chromatographic silica resins market. As pharmaceutical companies globally increase their investment in research and development, driven by the need to discover and commercialize new small-molecule drugs, biologics, biosimilars, and advanced therapeutics, there is a parallel increase in demand for high-performance separation and purification technologies. Chromatography remains a core analytical and process tool throughout drug development, from early compound screening to final quality control and regulatory compliance.
High-purity chromatographic silica resins enable accurate separation of complex mixtures, removal of impurities, and isolation of active pharmaceutical ingredients (APIs) with high reproducibility and efficiency. The rigorous quality standards enforced by regulatory agencies in major markets such as the U.S., Europe, and Japan require extensive purification and characterization of drug substances, further underpinning the reliance on advanced chromatographic media. The rapid growth of biologics, including monoclonal antibodies, recombinant proteins, peptides, and other complex molecules, necessitates multiple chromatography stages in downstream processing, during which silica resins are often selected for their robustness and high resolution.
As the number of biologics in clinical pipelines rises and personalized medicines gain traction, pharmaceutical and biopharmaceutical manufacturers are increasingly integrating silica-based chromatographic solutions into their workflows to meet purity, safety, and scalability targets. This systemic reliance on chromatographic silica resins across the drug development lifecycle solidifies their role as indispensable materials, driving steady market growth in both established and emerging regions.
Emerging Lipid Nanoparticle Purification Applications in mRNA Vaccine Manufacturing
LNPs have become the delivery platform of choice for messenger RNA (mRNA) vaccines and other nucleic acid-based treatments due to their ability to protect the fragile mRNA and facilitate efficient cellular uptake. Each LNP formulation typically contains multiple lipid components, such as ionizable lipids, PEGylated lipids, structural phospholipids, and cholesterol, all of which must be synthesized and purified with high quality before assembly and final formulation. Robust chromatographic purification is essential to remove synthesis by-products, structural isomers, unreacted reagents, and trace contaminants that could compromise formulation stability, efficacy, or safety.
High-purity silica chromatography resins play a crucial role in this process by enabling efficient and reproducible separation of individual lipid species based on their physicochemical properties. Their uniform particle-size distribution, large surface area, chemical stability, and tight lot-to-lot reproducibility enable manufacturers to achieve consistent impurity clearance, optimize throughput, and scale processes from development through commercial production. As global demand for mRNA vaccines and therapeutics grows, not only for COVID-19 boosters but also for emerging infectious diseases and personalized cancer vaccines, the need for sophisticated LNP purification strategies has become increasingly prominent. This has created a new and expanding application segment for chromatographic silica resins, where their performance directly affects product quality, process efficiency, and regulatory compliance.
Restraints - High Production Costs and Stringent Regulatory Requirements Limiting Market Penetration
High production costs, combined with stringent regulatory requirements, constitute a significant restraint on the global chromatographic silica resins market, particularly limiting market penetration in cost-sensitive and emerging regions. The manufacturing of high-performance chromatographic silica resins involves complex and capital-intensive processes, including precise control of pore size distribution, surface modification, particle uniformity, and rigorous quality testing. These steps require advanced equipment, skilled technical expertise, and high-purity raw materials, all of which substantially increase production expenses. As a result, silica resins often command higher prices than conventional separation media, limiting their adoption among smaller pharmaceutical manufacturers, academic research institutions, and contract development organizations operating under constrained budgets.
Stringent regulatory frameworks governing pharmaceutical and biopharmaceutical manufacturing further increase compliance costs. Chromatographic media used in drug development and commercial production must meet strict standards for extractables and leachables, lot-to-lot consistency, and documentation, necessitating extensive validation and quality assurance processes. Regulatory approvals can be time-consuming and costly, discouraging new entrants and slowing the introduction of innovative resin products.
Competition from Alternative Separation Technologies and Polymeric Resins
Intensifying competition from alternative separation technologies and polymeric resins poses another notable restraint on the growth of the chromatographic silica resins market. While silica-based resins are valued for their high resolution, mechanical strength, and well-defined surface chemistry, they are increasingly challenged by polymer-based chromatographic media that offer greater chemical stability across a wider range and enhanced durability under harsh processing conditions. Polymeric resins are often preferred in large-scale bioprocessing applications due to their longer operational lifetimes, lower risk of particle degradation, and reduced replacement frequency, which can translate into lower total cost of ownership.
Alternative separation techniques such as membrane chromatography, continuous chromatography systems, and advanced filtration technologies are gaining traction as manufacturers seek higher throughput, reduced buffer consumption, and faster processing times. These technologies can sometimes achieve comparable purification performance with simpler system designs and improved scalability. As biopharmaceutical manufacturers increasingly prioritize process efficiency and cost optimization, especially in high-volume production environments, the relative advantages of silica resins may be overshadowed by these competing solutions.
Opportunity - Development of Functionalized and Spheroidal Silica Resins for Enhanced Selectivity and Performance
The development of advanced functionalized and spheroidal silica resins that offer enhanced selectivity, efficiency, and performance for complex separations is one key opportunity in the global chromatographic silica resins market. Traditional silica resins often face limitations in selectivity and mass transfer, especially when dealing with structurally similar compounds or high-throughput industrial processes. Functionalization, the chemical modification of silica surfaces with tailored ligands, ion-exchange groups, or affinity moieties, significantly expands the range of interactions between the stationary phase and analytes. This enables more precise control over separation mechanisms such as hydrophobic, ionic, or affinity interactions, improving resolution and reducing processing times.
Spheroidal (or spherical) silica resins further enhance chromatographic performance by providing uniform particle size distribution and optimized pore structures, which together improve flow dynamics and reduce backpressure. These physical characteristics lead to higher reproducibility, better resolution, and greater column lifetimes compared to irregular silica particles. As pharmaceutical and biopharmaceutical manufacturers pursue more challenging separations, including enantiomeric resolution, complex biologics purification, and advanced analytics, the demand for specialized, high-performance resins rises.
Expansion of Bioprocessing and Single-Use Technologies Opening New Growth Avenues
The rapid expansion of bioprocessing operations and the adoption of single-use technologies in biopharmaceutical manufacturing is another significant opportunity for the chromatographic silica resins market. Bioprocessing demand has surged with the growth of monoclonal antibodies, recombinant proteins, cell and gene therapies, and mRNA-based products, all of which require robust downstream purification strategies. Single-use chromatography systems, designed to eliminate cleaning validation, reduce the risk of cross-contamination, and shorten turnaround times, are increasingly attractive, particularly for small- to mid-scale producers and contract manufacturing organizations. Chromatographic silica resins optimized for these disposable platforms can unlock new revenue streams by addressing specific performance challenges such as rapid equilibration, low pressure drop, and compatibility with modular systems.
Developing resins that are tailored for single-use formats, including pre-packed disposable columns or cartridges, enables manufacturers to offer high-performance solutions that align with flexible and cost-effective production paradigms. This trend is particularly pronounced in emerging markets where bioprocessing infrastructure is being modernized, and where agility and scalability are paramount. Capitalizing on this shift not only diversifies application segments but also strengthens long-term growth prospects in a market increasingly oriented toward adaptable, high-efficiency biomanufacturing solutions.
Category-wise Analysis
Mesh Size Insights
The 100-200 mesh segment dominates the global chromatographic silica resins market, accounting for an estimated 35% share in 2026, primarily due to its optimal balance between particle size, surface area, and chromatographic performance. Silica resins within this mesh range offer sufficient surface area to achieve high separation efficiency while maintaining manageable backpressure, making them highly suitable for routine analytical, semi-preparative, and preparative chromatography applications. These characteristics enable reliable separation of a wide range of compounds, including pharmaceutical intermediates, active pharmaceutical ingredients, natural extracts, and specialty chemicals.
Product Form Insights
Pure silica (up to 97%) grades command approximately 58% of total market consumption globally, reflecting cost considerations and adequate purity specifications for diverse analytical chromatography, preparative purification, and research applications where extreme purity requirements are non-existent. Pure silica grades, manufactured to ISO 9001:2015 standards with consistent surface characteristics and minimal organic contaminants, deliver reliable chromatographic performance at economical price points, making them the default specification for academic institutions, small research facilities, and industrial laboratories operating under cost constraints.
Ultrapure silica (up to 99%) resins are expanding at an 8.5% CAGR through 2033, driven by pharmaceutical industry demand for validated, ultra-low-contamination products certified for clinical-grade drug manufacturing. Ultrapure grades, characterized by trace-metal content below 50 parts per billion (ppb) and residual impurity profiles validated through rigorous analytical testing, command premium pricing yet are indispensable for biopharmaceutical companies pursuing regulatory approvals and clinical manufacturing certifications.
Application Insights
Analytical chromatography emerges as the leading application segment in the global chromatographic silica resins market, accounting for approximately 38% of total resin consumption worldwide. This dominant share reflects the extensive and routine use of analytical-scale chromatography across pharmaceutical and biopharmaceutical development, quality control operations, academic and industrial research laboratories, and regulatory testing environments. Analytical chromatography plays a critical role in the separation, identification, and quantification of chemical compounds, impurities, and degradation products, making it indispensable throughout the drug development lifecycle, from early-stage discovery and formulation optimization to final batch release and post-market surveillance.
Chromatographic silica resins are particularly well suited for analytical applications due to their high surface area, consistent pore structure, and well-defined surface chemistry, which together ensure reproducible retention behavior and high-resolution separations. In pharmaceutical quality control and regulatory compliance workflows, analytical chromatography supports method validation, stability testing, and impurity profiling in accordance with stringent global regulatory standards. The increasing complexity of modern drug molecules, including chiral compounds, peptides, and synthetic intermediates, has heightened reliance on precise analytical separations, thereby strengthening demand for high-performance silica resins.
End-user Insights
Laboratories represent the dominant end-use sector in the global chromatographic silica resins market, accounting for approximately 35% of total demand. This leadership position reflects the extensive use of chromatographic silica resins across analytical testing facilities, pharmaceutical quality control units, and research chemistry laboratories. Within pharmaceutical companies, laboratories rely heavily on silica-based chromatography for routine analytical testing, impurity profiling, stability studies, and method development to ensure compliance with stringent regulatory standards. The growing complexity of drug formulations and the increasing emphasis on quality-by-design approaches have further intensified the need for reliable and reproducible chromatographic materials in laboratory environments.
Regional Insights
North America Chromatographic Silica Resins Market Trends
North America maintains the dominant regional market position, commanding approximately 40% of global chromatographic silica resin market share in 2026, supported by a well-developed pharmaceutical and biotechnology infrastructure, substantial research and development investments, and advanced laboratory capabilities concentrated in the United States. The region's pharmaceutical market, valued at over US$ 600 billion annually, drives sustained demand for high-purity chromatographic resins through drug development pipelines, regulatory quality assurance protocols, and manufacturing quality control systems.
Regional market growth, projected at approximately 5.5% CAGR through 2033, reflects market maturity tempered by incremental expansion opportunities in emerging applications, including LNP purification for vaccine manufacturing, advanced biopharmaceutical manufacturing, and environmental testing. Innovation in functionalized and spheroidal resin formulations, coupled with investments in sustainable manufacturing practices and supply chain resilience, is driving competitive differentiation among North American producers and supporting market expansion in premium product segments.
Europe Chromatographic Silica Resins Trends
Europe commands approximately 31% of global chromatographic silica resin market share in 2026, characterized by stringent regulatory standards, advanced pharmaceutical manufacturing infrastructure, and well-established chromatography research and development centers concentrated in Germany, United Kingdom, and France. European pharmaceutical companies, subject to rigorous European Medicines Agency (EMA) quality standards and Good Manufacturing Practice (GMP) protocols, consistently demand ultra-high-purity chromatographic resins with validated regulatory documentation. Merck KGaA (headquartered in Darmstadt, Germany) operates as a major market participant, offering a comprehensive portfolio of chromatographic resins and supporting pharmaceutical purification applications across the region.
Regional market growth at approximately 6.2% CAGR through 2033 is supported by regulatory harmonization initiatives under European Union frameworks, increased research funding for pharmaceutical innovation, and the region's prominence in biopharmaceutical manufacturing. Environmental analysis applications and food safety testing regulations are generating supplementary demand streams, with European environmental agencies and food regulatory bodies mandating rigorous analytical testing protocols driving adoption of specialized chromatographic silica resins.
Asia Pacific Chromatographic Silica Resins Market Trends
Asia-Pacific emerges as the fastest-growing regional market, with the pharmaceutical and biotechnology sectors experiencing robust growth across China, India, and Japan. China's pharmaceutical production is expanding at 7% CAGR through 2033, driven by government initiatives supporting pharmaceutical self-sufficiency and export competitiveness, thereby generating substantial incremental demand for chromatographic silica resins. India's pharmaceutical sector, which accounts for approximately 35%-40% of global generic pharmaceutical manufacturing, is expanding at an 8% CAGR, creating opportunities for chromatographic resin suppliers to support API production and quality assurance operations. Sorbead India and regional manufacturers are expanding capacity to serve emerging pharmaceutical supply chains and cost-competitive production hubs.
Japan maintains a mature, technology-driven market characterized by demand for high-performance chromatographic resins with advanced functionalization and specialized applications. Tosoh Corporation (headquartered in Tokyo) operates as the regional technology leader, manufacturing Toyopearl® and TSKgel® chromatographic resins serving biopharmaceutical manufacturers across the Asia Pacific. Regional market growth at approximately 7.5% CAGR through 2032 reflects pharmaceutical expansion, environmental testing mandate implementation, and rising R&D investments across emerging ASEAN nations, establishing pharmaceutical manufacturing hubs.
Competitive Landscape
The global chromatographic silica resins market demonstrates a moderately consolidated competitive structure characterized by 8 - 10 major multinational manufacturers controlling approximately 70% - 75% of global supply volume, alongside specialized regional producers competing through product differentiation, technical expertise, and customer service. W.R. Grace and Company (operating for over 55 years in silica gel manufacturing) exercises dominant market influence through its DAVISIL® and VYDAC® brands, leveraging proprietary manufacturing processes and comprehensive product customization capabilities.
Market leaders pursue expansion through capacity investments, geographic diversification into emerging markets, development of functionalized and spheroidal resin formulations, and vertical integration into resin coating and surface modification technologies. Key differentiation strategies emphasize batch-to-batch reproducibility, regulatory compliance documentation, technical support capabilities, and sustainability initiatives. Emerging regional competitors in Asia Pacific are progressively upgrading manufacturing capabilities and pursuing competitive positioning through cost advantages and localized customer service models.
Key Developments:
- In December 2024, W.R. Grace and Company announced a 35% expansion of VYVID's superparamagnetic silica production capacity, targeting emerging lipid nanoparticle purification applications for mRNA vaccine manufacturing and supporting anticipated growth in biopharmaceutical manufacturing demand.
- In September 2024, Tosoh Corporation established a research collaboration with leading biopharmaceutical companies focusing on the development of specialized Toyopearl® resin formulations optimized for monoclonal antibody purification, supporting the expanding biopharmaceutical sector demand.
- In May 2024, SiliCycle Inc. introduced ultra-high-purity chromatographic silica resins achieving 99.99% chemical purity for specialized pharmaceutical research applications, targeting premium market segment positioning among research institutions and contract research organizations.
Companies Covered in Chromatographic Silica Resins Market
- W.R. Grace and Company
- Osaka Soda Co. Limited
- Alfa Aesar
- Merck KGaA
- AGC Group
- SiliCycle Inc.
- Sorbead India
- Sepax Technologies Inc.
- Tosoh Corporation
- Repligen Corporation
- Bio-Rad Laboratories Inc.
- Avantor, Inc.
- Nuvia Chromatography
- Phenomenex
- Cytiva
Frequently Asked Questions
The global chromatographic silica resins market was valued at US$ 1.7 Bn in 2026 and is projected to reach US$ 2.9 Bn by 2033, representing a CAGR of 7.7% driven by escalating pharmaceutical industry demand, biopharmaceutical manufacturing expansion, and emerging lipid nanoparticle purification applications.
Primary demand drivers include pharmaceutical industry requiring high-purity separation media for drug development and quality assurance, biopharmaceutical sector growth demanding specialized resins for protein and antibody purification, emerging lipid nanoparticle (LNP) purification applications for mRNA vaccine manufacturing, and environmental testing applications driving adoption across regulatory and analytical laboratories.
100 - 200 mesh chromatographic silica resins dominate market with 35% market share, delivering optimal balance of particle size (74 - 149 micrometers), surface area, and chromatographic efficiency essential for standard analytical and preparative separation applications across diverse end-use industries.
North America commands the largest market share at 40% in 2026, supported by well-developed pharmaceutical and biotechnology infrastructure, substantial research and development investments, and advanced laboratory capabilities concentrated in the United States served by major manufacturers including W.R. Grace and Company.
Lipid Nanoparticle (LNP) Purification for mRNA Vaccine Manufacturing represents the highest-growth emerging opportunity, with biopharmaceutical manufacturing demand for ultrapure silica resins generating premium-margin applications supporting therapeutic vaccine and drug delivery development.
Major market leaders include W.R. Grace and Company (USA, DAVISIL® and VYDAC® brands), Tosoh Corporation (Japan, Toyopearl® and TSKgel®), Merck KGaA (Germany), Repligen Corporation (USA), Bio-Rad Laboratories Inc. (USA), SiliCycle Inc. (Canada), and Osaka Soda Co. Limited (Japan), collectively controlling approximately 70 - 75% of global supply.


