


- Executive Summary
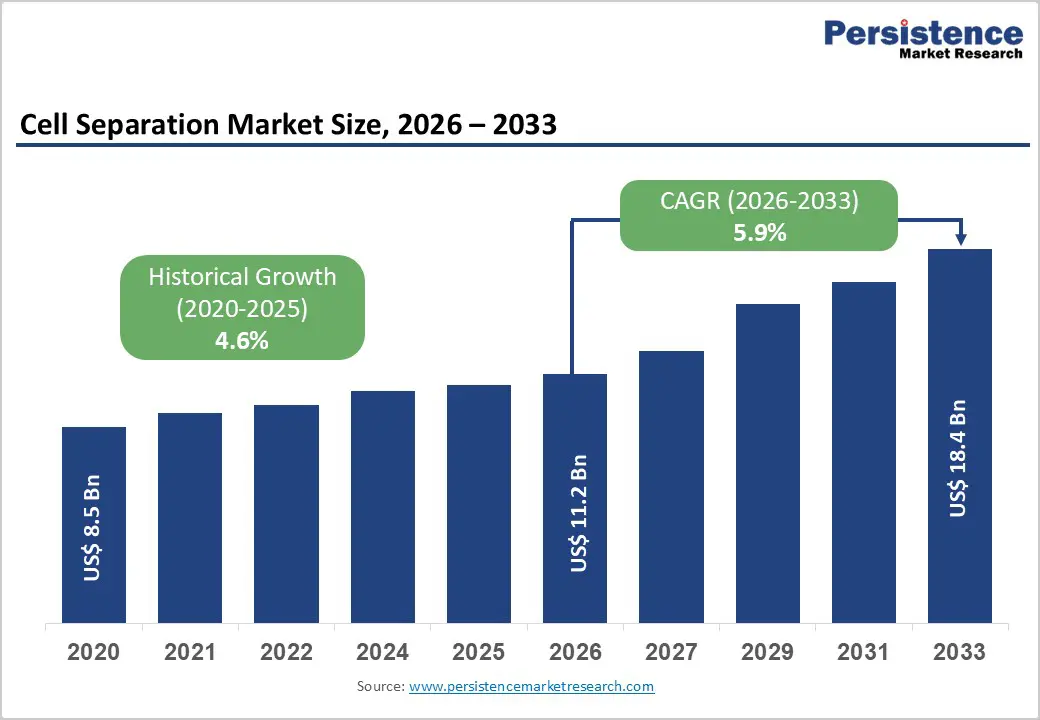
- Global Cell Separation Market Snapshot, 2026 and 2033
- Market Opportunity Assessment, 2026 - 2033, US$ Bn
- Key Market Trends
- Future Market Projections
- Premium Market Insights
- Industry Developments and Key Market Events
- PMR Analysis and Recommendations
- Market Overview
- Market Scope and Definition
- Market Dynamics
- Drivers
- Restraints
- Opportunity
- Key Trends
- Macro-Economic Factors
- Global Sectorial Outlook
- Global GDP Growth Outlook
- COVID-19 Impact Analysis
- Forecast Factors - Relevance and Impact
- Value Added Insights
- Product Adoption Analysis
- Recent Product Launches
- Regulatory Landscape
- Value Chain Analysis
- Key Deals and Mergers
- PESTLE Analysis
- Porter’s Five Force Analysis
- Price Trend Analysis, 2020 - 2033
- Key Highlights
- Key Factors Impacting Product Prices
- Pricing Analysis, By Product Cell Type
- Regional Prices and Product Preferences
- Global Cell Separation Market Outlook:
- Key Highlights
- Market Size (US$ Bn) and Y-o-Y Growth
- Absolute $ Opportunity
- Market Size (US$ Bn) Analysis and Forecast
- Historical Market Size (US$ Bn) Analysis, 2020-2025
- Market Size (US$ Bn) Analysis and Forecast, 2026-2033
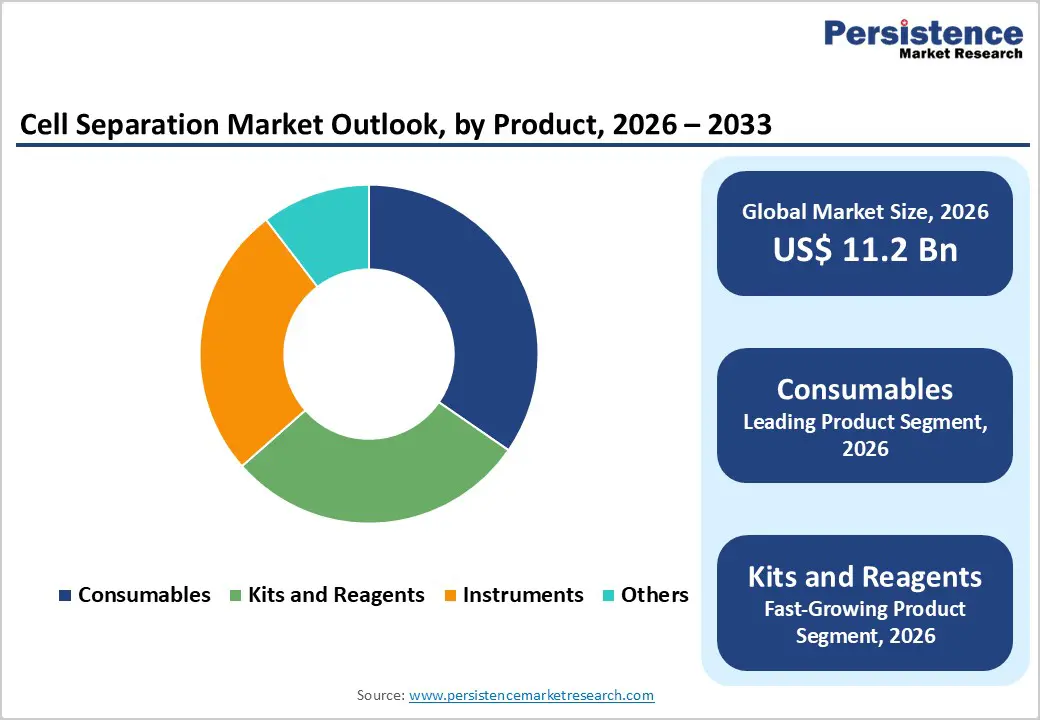
- Global Cell Separation Market Outlook: Product
- Introduction / Key Findings
- Historical Market Size (US$ Bn) Analysis and Volume (Units) Analysis, By Product, 2020 - 2025
- Market Size (US$ Bn) Analysis and Volume (Units) Analysis and Forecast, By Product, 2026 - 2033
- Consumables
- Kits and Reagents
- Instruments
- Others
- Market Attractiveness Analysis: Product
- Global Cell Separation Market Outlook: Cell Type
- Introduction / Key Findings
- Historical Market Size (US$ Bn) Analysis, By Cell Type, 2020 - 2025
- Market Size (US$ Bn) Analysis and Forecast, By Cell Type, 2026 - 2033
- Human Cells
- Animal Cells
- Market Attractiveness Analysis: Cell Type
- Global Cell Separation Market Outlook: Method
- Introduction / Key Findings
- Historical Market Size (US$ Bn) Analysis, By Method, 2020 - 2025
- Market Size (US$ Bn) Analysis and Forecast, By Method, 2026 - 2033
- Centrifugation
- Surface Marker
- Filtration
- Market Attractiveness Analysis: Method
- Global Cell Separation Market Outlook: Application
- Introduction / Key Findings
- Historical Market Size (US$ Bn) Analysis, By Application, 2020 - 2025
- Market Size (US$ Bn) Analysis and Forecast, By Application, 2026 - 2033
- Biomolecule Isolation
- Cancer Research
- Stem Cell Research
- Tissue Regeneration
- In Vitro Diagnostics
- Others
- Global Cell Separation Market Outlook: End User
- Introduction / Key Findings
- Historical Market Size (US$ Bn) Analysis, By End User, 2020 - 2025
- Market Size (US$ Bn) Analysis and Forecast, By End User, 2026 - 2033
- Hospitals
- Diagnostic Laboratories
- Academic and Research Institutes
- Cell Banks
- Biotechnology and Biopharmaceutical Companies
- Others
- Market Attractiveness Analysis: End User
- Key Highlights
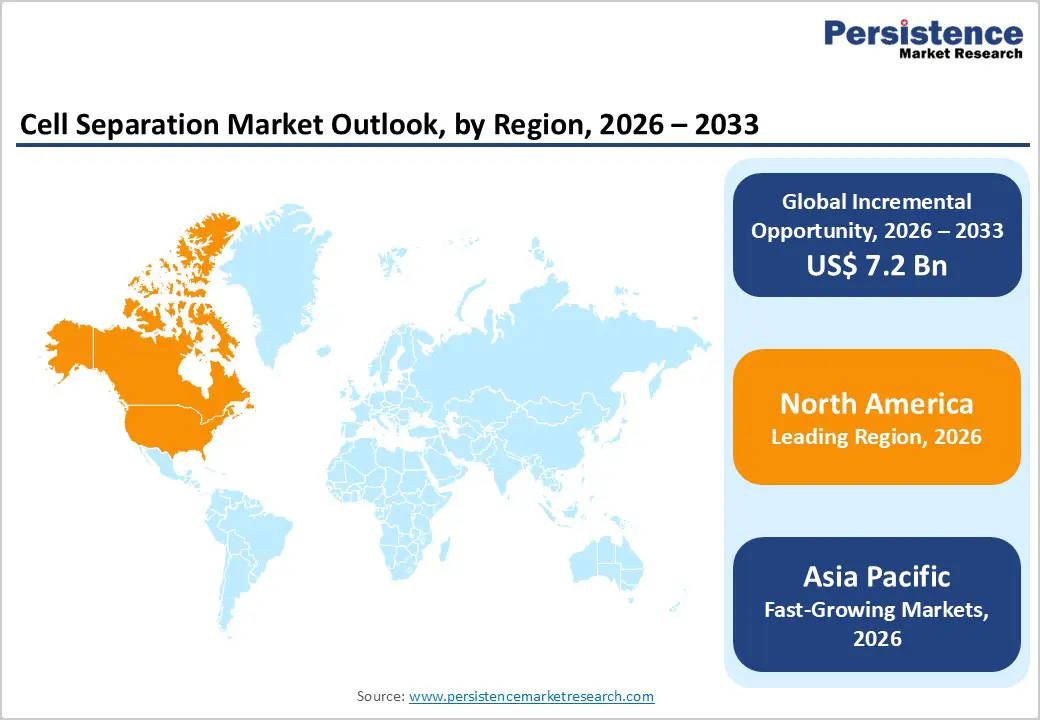
- Global Cell Separation Market Outlook: Region
- Key Highlights
- Historical Market Size (US$ Bn) Analysis, By Region, 2020 - 2025
- Market Size (US$ Bn) Analysis and Forecast, By Region, 2026 - 2033
- North America
- Europe
- East Asia
- South Asia and Oceania
- Latin America
- Middle East & Africa
- Market Attractiveness Analysis: Region
- North America Cell Separation Market Outlook:
- Key Highlights
- Historical Market Size (US$ Bn) Analysis, By Market, 2020 - 2025
- By Country
- By Product
- By Cell Type
- By Method
- By Application
- By End User
- Market Size (US$ Bn) Analysis and Forecast, By Country, 2026 - 2033
- U.S.
- Canada
- Market Size (US$ Bn) Analysis and Volume (Units) Analysis and Forecast, By Product, 2026 - 2033
- Consumables
- Kits and Reagents
- Instruments
- Others
- Market Size (US$ Bn) Analysis and Forecast, By Cell Type, 2026 - 2033
- Human Cells
- Animal Cells
- Market Size (US$ Bn) Analysis and Forecast, By Method, 2026 - 2033
- Centrifugation
- Surface Marker
- Filtration
- Market Size (US$ Bn) Analysis and Forecast, By Application, 2026 - 2033
- Biomolecule Isolation
- Cancer Research
- Stem Cell Research
- Tissue Regeneration
- In Vitro Diagnostics
- Others
- Market Size (US$ Bn) Analysis and Forecast, By End User, 2026 - 2033
- Hospitals
- Diagnostic Laboratories
- Academic and Research Institutes
- Cell Banks
- Biotechnology and Biopharmaceutical Companies
- Others
- Market Attractiveness Analysis
- Europe Cell Separation Market Outlook:
- Key Highlights
- Historical Market Size (US$ Bn) Analysis, By Market, 2020 - 2025
- By Country
- By Product
- By Cell Type
- By Method
- By Application
- By End User
- Market Size (US$ Bn) Analysis and Forecast, By Country, 2026 - 2033
- Germany
- France
- U.K.
- Italy
- Spain
- Russia
- Rest of Europe
- Market Size (US$ Bn) Analysis and Volume (Units) Analysis and Forecast, By Product, 2026 - 2033
- Consumables
- Kits and Reagents
- Instruments
- Others
- Market Size (US$ Bn) Analysis and Forecast, By Cell Type, 2026 - 2033
- Human Cells
- Animal Cells
- Market Size (US$ Bn) Analysis and Forecast, By Method, 2026 - 2033
- Centrifugation
- Surface Marker
- Filtration
- Market Size (US$ Bn) Analysis and Forecast, By Application, 2026 - 2033
- Biomolecule Isolation
- Cancer Research
- Stem Cell Research
- Tissue Regeneration
- In Vitro Diagnostics
- Others
- Market Size (US$ Bn) Analysis and Forecast, By End User, 2026 - 2033
- Hospitals
- Diagnostic Laboratories
- Academic and Research Institutes
- Cell Banks
- Biotechnology and Biopharmaceutical Companies
- Others
- Market Attractiveness Analysis
- East Asia Cell Separation Market Outlook:
- Key Highlights
- Historical Market Size (US$ Bn) Analysis, By Market, 2020 - 2025
- By Country
- By Product
- By Cell Type
- By Method
- By Application
- By End User
- Market Size (US$ Bn) Analysis and Forecast, By Country, 2026 - 2033
- China
- Japan
- South Korea
- Market Size (US$ Bn) Analysis and Volume (Units) Analysis and Forecast, By Product, 2026 - 2033
- Consumables
- Kits and Reagents
- Instruments
- Others
- Market Size (US$ Bn) Analysis and Forecast, By Cell Type, 2026 - 2033
- Human Cells
- Animal Cells
- Market Size (US$ Bn) Analysis and Forecast, By Method, 2026 - 2033
- Centrifugation
- Surface Marker
- Filtration
- Market Size (US$ Bn) Analysis and Forecast, By Application, 2026 - 2033
- Biomolecule Isolation
- Cancer Research
- Stem Cell Research
- Tissue Regeneration
- In Vitro Diagnostics
- Others
- Market Size (US$ Bn) Analysis and Forecast, By End User, 2026 - 2033
- Hospitals
- Diagnostic Laboratories
- Academic and Research Institutes
- Cell Banks
- Biotechnology and Biopharmaceutical Companies
- Others
- Market Attractiveness Analysis
- South Asia & Oceania Cell Separation Market Outlook:
- Key Highlights
- Historical Market Size (US$ Bn) Analysis, By Market, 2020 - 2025
- By Country
- By Product
- By Cell Type
- By Method
- By Application
- By End User
- Market Size (US$ Bn) Analysis and Forecast, By Country, 2026 - 2033
- India
- Southeast Asia
- ANZ
- Rest of South Asia & Oceania
- Market Size (US$ Bn) Analysis and Volume (Units) Analysis and Forecast, By Product, 2026 - 2033
- Consumables
- Kits and Reagents
- Instruments
- Others
- Market Size (US$ Bn) Analysis and Forecast, By Cell Type, 2026 - 2033
- Human Cells
- Animal Cells
- Market Size (US$ Bn) Analysis and Forecast, By Method, 2026 - 2033
- Centrifugation
- Surface Marker
- Filtration
- Market Size (US$ Bn) Analysis and Forecast, By Application, 2026 - 2033
- Biomolecule Isolation
- Cancer Research
- Stem Cell Research
- Tissue Regeneration
- In Vitro Diagnostics
- Others
- Market Size (US$ Bn) Analysis and Forecast, By End User, 2026 - 2033
- Hospitals
- Diagnostic Laboratories
- Academic and Research Institutes
- Cell Banks
- Biotechnology and Biopharmaceutical Companies
- Others
- Market Attractiveness Analysis
- Latin America Cell Separation Market Outlook:
- Key Highlights
- Historical Market Size (US$ Bn) Analysis, By Market, 2020 - 2025
- By Country
- By Product
- By Cell Type
- By Method
- By Application
- By End User
- Market Size (US$ Bn) Analysis and Forecast, By Country, 2026 - 2033
- Brazil
- Mexico
- Rest of Latin America
- Market Size (US$ Bn) Analysis and Volume (Units) Analysis and Forecast, By Product, 2026 - 2033
- Consumables
- Kits and Reagents
- Instruments
- Others
- Market Size (US$ Bn) Analysis and Forecast, By Cell Type, 2026 - 2033
- Human Cells
- Animal Cells
- Market Size (US$ Bn) Analysis and Forecast, By Method, 2026 - 2033
- Centrifugation
- Surface Marker
- Filtration
- Market Size (US$ Bn) Analysis and Forecast, By Application, 2026 - 2033
- Biomolecule Isolation
- Cancer Research
- Stem Cell Research
- Tissue Regeneration
- In Vitro Diagnostics
- Others
- Market Size (US$ Bn) Analysis and Forecast, By End User, 2026 - 2033
- Hospitals
- Diagnostic Laboratories
- Academic and Research Institutes
- Cell Banks
- Biotechnology and Biopharmaceutical Companies
- Others
- Market Attractiveness Analysis
- Middle East & Africa Cell Separation Market Outlook:
- Key Highlights
- Historical Market Size (US$ Bn) Analysis, By Market, 2020 - 2025
- By Country
- By Product
- By Cell Type
- By Method
- By Application
- By End User
- Market Size (US$ Bn) Analysis and Forecast, By Country, 2026 - 2033
- GCC Countries
- Egypt
- South Africa
- Northern Africa
- Rest of Middle East & Africa
- Market Size (US$ Bn) Analysis and Volume (Units) Analysis and Forecast, By Product, 2026 - 2033
- Consumables
- Kits and Reagents
- Instruments
- Others
- Market Size (US$ Bn) Analysis and Forecast, By Cell Type, 2026 - 2033
- Human Cells
- Animal Cells
- Market Size (US$ Bn) Analysis and Forecast, By Method, 2026 - 2033
- Centrifugation
- Surface Marker
- Filtration
- Market Size (US$ Bn) Analysis and Forecast, By Application, 2026 - 2033
- Biomolecule Isolation
- Cancer Research
- Stem Cell Research
- Tissue Regeneration
- In Vitro Diagnostics
- Others
- Market Size (US$ Bn) Analysis and Forecast, By End User, 2026 - 2033
- Hospitals
- Diagnostic Laboratories
- Academic and Research Institutes
- Cell Banks
- Biotechnology and Biopharmaceutical Companies
- Others
- Market Attractiveness Analysis
- Competition Landscape
- Market Structure
- Competition Intensity Mapping By Market
- Competition Dashboard
- Company Profiles (Details - Overview, Recent Developments)
- Thermo Fisher Scientific, Inc.
- Overview
- Segments and Product & End User
- Key Financials
- Market Developments
- Market Strategy
- BD
- Danaher
- Terumo Corp.
- STEMCELL Technologies Inc.
- Bio-Rad Laboratories, Inc.
- Merck KGaA
- Agilent Technologies, Inc.
- Corning Inc.
- Akadeum Life Sciences
- Miltenyi Biotec
- Others
- Thermo Fisher Scientific, Inc.
- Market Structure
- Appendix
- Research Methodology
- Research Assumptions
- Acronyms and Abbreviations

Loading page data
Please wait a moment


