Captive Power Plant Market Size, Share, and Growth Forecast 2026 - 2033

Captive Power Plant Market by Fuel Source (Coal, Natural Gas, Diesel / Heavy Fuel Oil (HFO), Renewable, Others), Capacity Range (Up to 10 MW, 10 to 50 MW, 51 to 150 MW, Above 150 MW), Technology (Gas Turbine, Reciprocating Engine, Combined Heat & Power (CHP), Renewable Microgrid, Others), Industry (Cement, Metals & Minerals, Petrochemicals, Data Centers, Pulp & Paper, Others), and Regional Analysis, 2026 - 2033

ID: PMRREP36468
Calendar

March 2026

220 Pages

Author : Likhit Meshram

Captive Power Plant Market Size and Trend Analysis

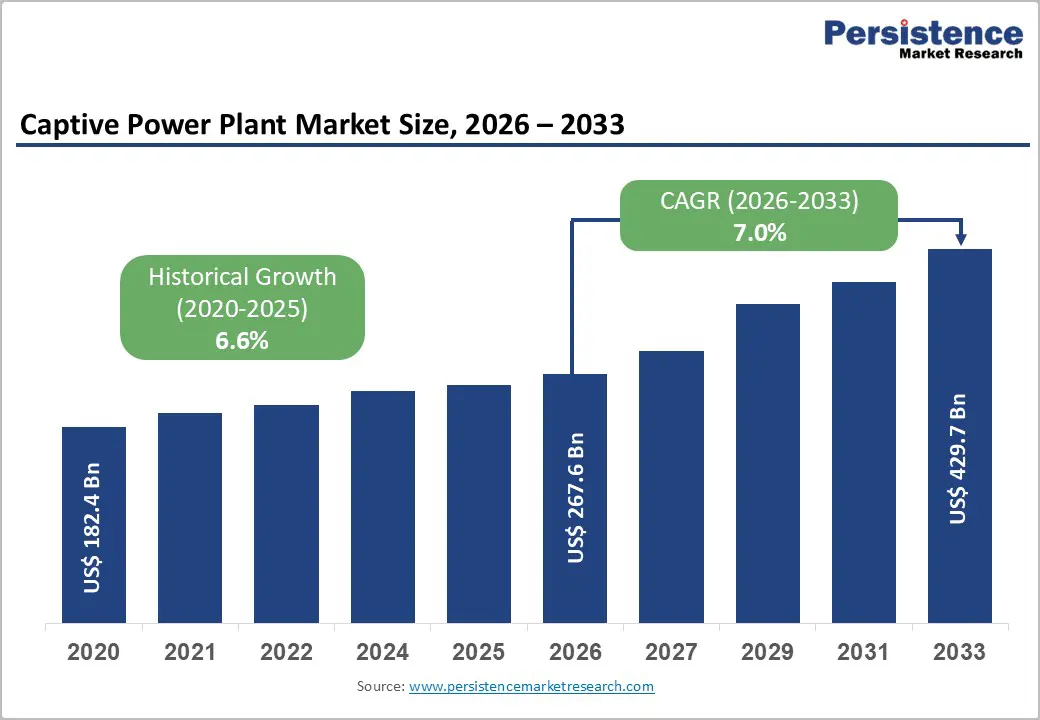
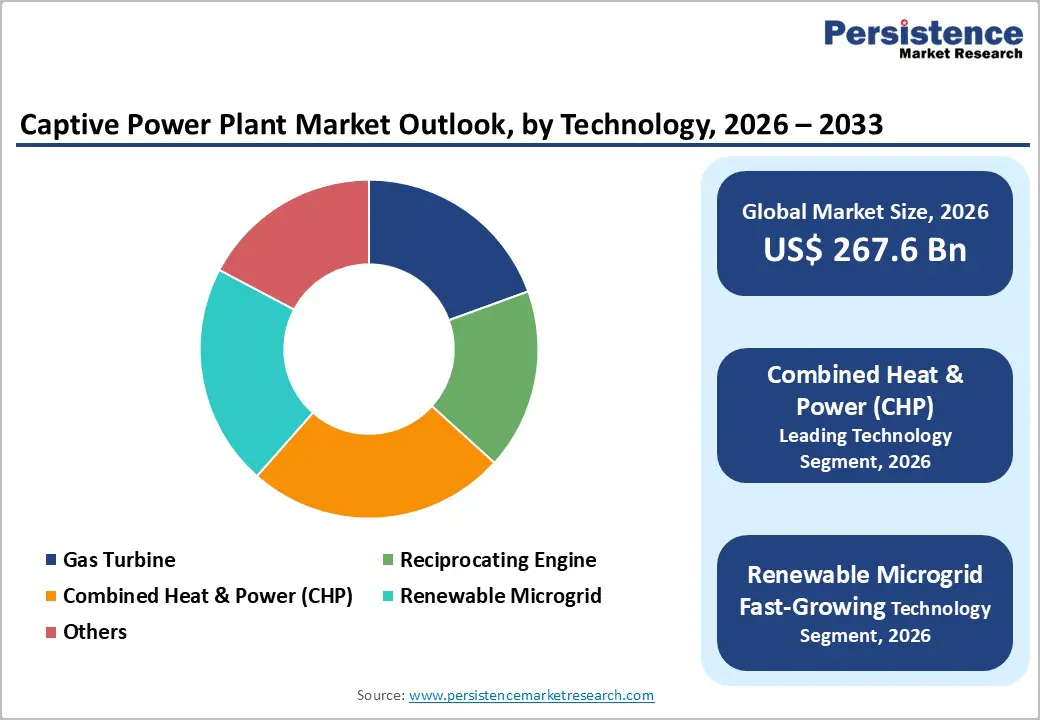
The global captive power plant market size is expected to be valued at US$ 267.6 billion in 2026 and projected to reach US$ 429.7 billion by 2033, growing at a CAGR of 7.0% between 2026 and 2033.

The market continues to expand due to sustained industrialization and increasing demand for reliable, uninterrupted power across energy-intensive sectors. Rising grid electricity costs and the need for energy security are encouraging industries to adopt captive and group captive models. Additionally, supportive policies and open access frameworks are accelerating adoption. Technological advancements in turbine efficiency, emissions control, and renewable microgrid integration are further enhancing operational efficiency while reducing carbon intensity and long-term energy costs.

Key Industry Highlights:

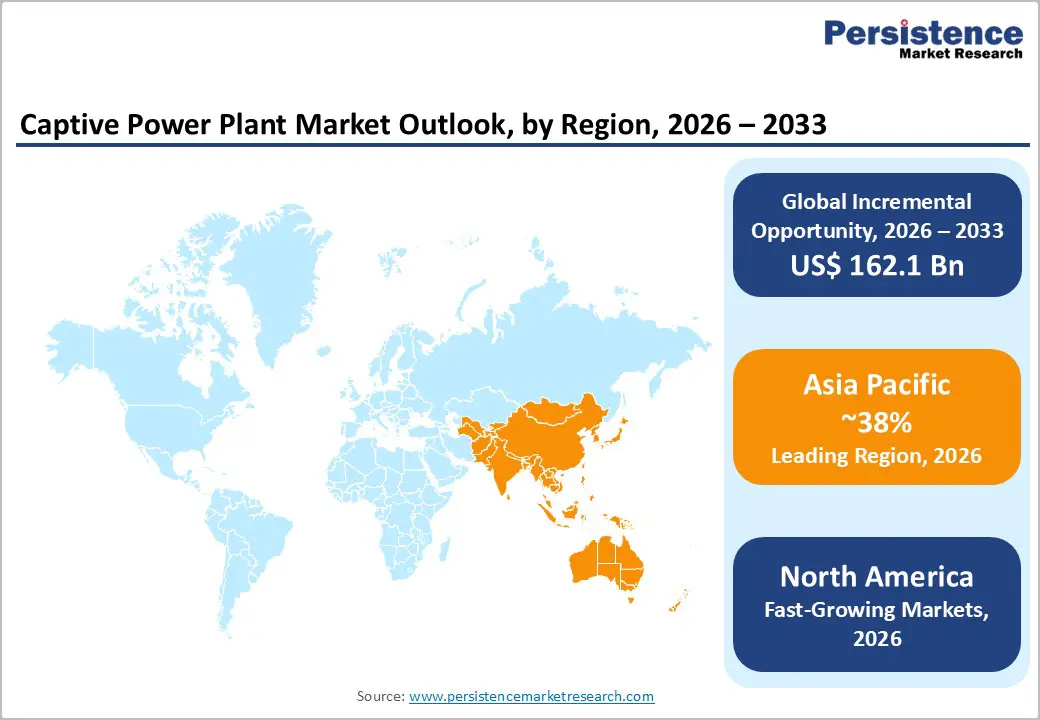
  • Leading Region: Asia Pacific dominates the captive power plant market with ~38% share, driven by strong industrialization across China, India, and Southeast Asia.
  • Fastest Growing Region: North America is emerging as the fastest-growing region, supported by increasing adoption of gas-based and CHP systems amid rising demand for reliable power.
  • Leading Fuel Source: Coal leads the market with ~57% share, owing to low fuel costs and strong availability across major industrial economies.
  • Leading Technology: Combined Heat & Power (CHP) holds a leading position with 40%+ share, driven by high efficiency and dual output capability for industrial applications.
  • Key Market Opportunity: Integration of renewable microgrids with gas-based and CHP systems is creating strong growth potential, especially across data centers, industrial parks, and mining operations.
Key Insights Details
Captive Power Plant Size (2026E) US$ 267.6 billion
Market Value Forecast (2033F) US$ 429.7 billion
Projected Growth CAGR (2026 - 2033) 7.0%
Historical Market Growth (2020 - 2025) 6.6%

DRO Analysis

Drivers - Increasing industrial reliance on reliable and cost-efficient captive power generation

Energy-intensive industries such as cement, metals & minerals, petrochemicals, and pulp & paper increasingly depend on captive power plants to overcome grid instability, outages, and high tariffs. In emerging regions like India, Africa, and Southeast Asia, industrial demand is rising faster than grid expansion, resulting in unreliable supply and voltage fluctuations for large users.

To address this, industries are investing in captive capacity to ensure uninterrupted operations and cost control. Captive plants can reduce outage exposure and lower energy costs by 20-30% through optimized fuel use. The growth of industrial parks and special economic zones further accelerates adoption by integrating captive power solutions as a core infrastructure component.

Supportive regulatory frameworks and open access market policies

Favorable government policies and regulatory reforms are significantly driving captive power plant adoption across global markets. Frameworks such as open access regulations, reduced cross-subsidy surcharges, and incentives for efficient and renewable-based generation are enabling industries to establish their own power sources with greater flexibility and economic viability.

In countries like India, group captive and third-party sale models allow multiple users to share generation assets efficiently. Similar mechanisms in Latin America and Africa permit surplus power injection into grids under wheeling and banking systems. These evolving policies encourage investment in multi-fuel and high-capacity captive plants while improving energy security and cost optimization.

Restraints - High capital requirements and limited access to project financing

Establishing captive power plants requires significant upfront investment across land, equipment, fuel handling, emissions control, and grid connectivity. For large-scale coal or gas plants, costs can exceed US$ 1 million per MW, creating a major barrier for small and medium industries, particularly in emerging markets with limited access to affordable long-term financing.

Investment decisions are often dependent on achieving payback within 5-7 years, which becomes difficult under volatile fuel prices or subsidized grid tariffs. Additionally, uncertainty around open access charges and regulatory policies delays project approvals, restricting adoption among smaller industrial players and limiting broader market penetration.

Stringent environmental norms increasing compliance and operating costs

Tightening environmental regulations and carbon control measures are impacting the viability of traditional captive power plants, especially coal and diesel-based systems. Compliance with emission standards requires additional investment in technologies such as flue gas desulfurization systems, electrostatic precipitators, and low-NOx burners, significantly increasing overall project costs.

Global carbon pricing mechanisms and strict air quality norms further add operational and financial pressure. Non-compliant plants risk penalties or shutdowns, extending return periods. While this encourages a shift toward cleaner fuels and hybrid systems, it acts as a short-term restraint on the expansion of conventional captive power capacity.

Opportunity - Rising adoption of renewable microgrids and hybrid captive systems

A key opportunity in the captive power plant market is the integration of renewable energy sources such as solar, wind, and biomass into hybrid microgrid systems. Declining solar PV costs have made renewable-based captive solutions economically viable, enabling industries to reduce dependence on conventional fuels while improving cost efficiency and sustainability.

Industries are increasingly adopting hybrid configurations combining solar with gas or diesel backup to ensure reliability and continuous power supply. This approach is gaining traction in energy-intensive sectors and industrial clusters, offering improved power quality, reduced emissions, and alignment with corporate decarbonization and net-zero commitments.

Expanding data center infrastructure driving captive power demand

The rapid growth of data centers, cloud computing, and AI-driven infrastructure is creating strong demand for reliable and uninterrupted power solutions. Operators increasingly prefer captive or semi-captive power setups to achieve high uptime and mitigate risks associated with grid instability and fluctuating electricity tariffs.

In high-growth regions, captive plants integrated with renewable microgrids are becoming standard in hyperscale developments. Additionally, the adoption of combined heat & power systems enhances energy efficiency by utilizing waste heat, making captive power a strategic solution for supporting the expanding global digital infrastructure ecosystem.

Category-wise Analysis

Fuel Source Insights

Coal remains the leading fuel source in the captive power plant market, accounting for approximately 57% of tracked capacity in key markets such as India. Its dominance is driven by low domestic fuel costs, long-term supply agreements, and suitability for baseload industrial operations. Industries like cement, steel, and metals & minerals rely heavily on coal-based systems, particularly in resource-rich regions with established transportation and supply infrastructure.

Renewable energy sources are emerging as the fastest-growing segment due to increasing environmental concerns and policy support. Solar, wind, and biomass-based captive systems are gaining traction as industries seek to reduce carbon emissions and fuel dependency. The integration of renewables with conventional backup systems is further accelerating adoption across industrial and commercial applications.

Capacity Range Insights

Plants above 150 MW dominate the capacity range segment, accounting for around 40-45% of installed captive power capacity in major industrial markets. These large-scale plants are widely deployed in metals, petrochemicals, and integrated industrial complexes, benefiting from economies of scale and the ability to support continuous high-volume energy demand along with steam generation for industrial processes.

Mid- and small-capacity plants are witnessing faster growth due to increasing adoption among commercial users and smaller industrial clusters. Flexible configurations such as modular gas turbines and reciprocating engines are enabling easier deployment, lower initial investment, and improved scalability, making them attractive for decentralized and distributed power generation needs.

Technology Insights

Combined Heat & Power (CHP) is the leading technology segment, contributing over 40% of the installed base in integrated industrial facilities. Its ability to achieve energy efficiencies of 70-85% by producing both electricity and thermal energy makes it highly suitable for sectors like chemicals, pulp & paper, and food processing, where heat demand is substantial alongside power consumption.

Renewable microgrids and hybrid technologies are the fastest-growing segment as industries shift toward cleaner and more efficient energy systems. These solutions combine renewable generation with storage and backup systems, enabling improved reliability, reduced emissions, and alignment with sustainability targets, particularly in new industrial developments and modernization projects.

Industry Insights

Metals & minerals leads the industry segment, accounting for around 40% of captive power capacity in regions like India. This dominance is due to the sector’s continuous operations and high energy intensity, particularly in steel, aluminum, and mining processes that require stable and uninterrupted electricity and thermal energy supply.

Data centers and digital infrastructure are emerging as the fastest-growing end-use segment. Increasing demand for high uptime, power quality, and energy efficiency is driving the adoption of captive and hybrid power systems, especially in regions where grid reliability is limited and digital infrastructure expansion is accelerating.

Regional Insights

North America Captive Power Plant Market Trends and Insights

North America holds a significant share of the captive power plant market, accounting for approximately 25% of the global market. The region is characterized by widespread deployment of gas turbine and combined heat & power systems, particularly across U.S. industrial hubs and Canadian resource sectors. Abundant natural gas availability and competitive pricing support the dominance of gas-based captive generation, while industrial users increasingly adopt on-site systems to mitigate grid volatility and outage risks.

The market is witnessing a transition toward cleaner and more efficient systems, including CHP and renewable-integrated solutions. Favorable regulatory frameworks, open access policies, and government-supported programs are encouraging industries to modernize captive infrastructure. Growing demand from data centers and energy-intensive industries continues to drive adoption of flexible and high-efficiency captive power systems across the region.

Europe Captive Power Plant Market Trends and Insights

Europe represents a technologically advanced captive power market, driven by stringent environmental regulations and decarbonization goals. The region is expected to grow at a CAGR of around 6.5% during the forecast period, supported by strong adoption of CHP systems and renewable-linked captive solutions. Policies such as the EU Emissions Trading System and energy efficiency directives have accelerated the shift away from coal-based captive plants toward cleaner alternatives.

Renewable microgrids and hybrid systems are gaining traction across industrial clusters, particularly in Germany and Nordic countries. Industrial users increasingly combine on-site CHP with off-site renewable procurement to balance reliability and sustainability. Participation in demand response and ancillary service markets further enhances operational flexibility, positioning Europe as a leader in low-carbon captive power solutions.

Asia Pacific Captive Power Plant Market Trends and Insights

Asia Pacific dominates the global captive power plant market, accounting for over 38% of total installed capacity. Rapid industrialization in countries such as China, India, and Southeast Asia drives extensive deployment of captive plants across sectors like metals, cement, and petrochemicals. High dependence on coal and gas-based systems reflects the region’s energy mix and the need for reliable power amid growing industrial demand and grid constraints.

The region is also the fastest-growing market due to supportive government policies and increasing renewable integration. Open access frameworks, renewable incentives, and LNG infrastructure development are encouraging hybrid captive systems combining thermal and renewable sources. As industries prioritize cost efficiency and sustainability, Asia Pacific continues to lead both in scale and future growth potential.

Competitive Landscape

The captive power plant market is moderately consolidated, with a limited number of global technology providers dominating high-capacity gas turbine, CHP, and renewable-integrated system segments. These players compete primarily on efficiency, emissions performance, and lifecycle cost optimization, often offering bundled operation and maintenance services to enhance long-term value and reliability for industrial customers.

On the project development side, the market remains fragmented, with participation from industrial groups, independent producers, and utility-backed entities. Companies are increasingly focusing on integrated energy solutions, combining generation, fuel management, and distribution. Emerging models such as energy-as-a-service and on-site leasing are gaining traction, supported by digitalization and predictive maintenance capabilities.

Key Developments:

  • In June 2025, GE Vernova deployed advanced H-class gas turbines for a 150 MW captive-power plant at a major petrochemical complex in the Middle East, achieving over 60% combined-cycle efficiency and reducing CO2 emissions by approximately 15% compared with legacy units.
  • In March 2024, Siemens Energy secured a multi-year contract to upgrade CHP and gas-turbine equipment at several large cement and metals plants across Europe, aligning the projects with the EU’s emissions-reduction targets and supporting the plants’ transition to higher-efficiency, lower-carbon configurations.
  • In October 2024, Mitsubishi Power delivered a 100 MW gas-turbine-based captive power solution for a hyperscale data-center campus in India, integrating advanced control systems and grid-synchronization technology to ensure high-reliability power supply in a region with frequent grid-congestion events.

Companies Covered in Captive Power Plant Market

  • General Electric Company (GE)
  • Wärtsilä Oyj Abp
  • Siemens AG
  • Caterpillar Inc.
  • Mitsubishi Heavy Industries Ltd.
  • Bharat Heavy Electricals Limited (BHEL)
  • Cummins Inc.
  • ABB Ltd.
  • Schneider Electric SE
  • MAN Energy Solutions SE
  • Doosan Heavy Industries & Construction
  • Rolls‑Royce Holdings plc (MTU Onsite Energy)
  • Kawasaki Heavy Industries Ltd.
  • Capstone Green Energy Corp.
  • Tata Power Renewable Energy
Frequently Asked Questions

The global Captive Power Plant market is expected to reach US$ 267.6 billion in 2026, driven by sustained industrial demand and expansion of self-generation capacity.

Key drivers include rising demand from energy-intensive industries such as metals & minerals (40% share), along with increasing grid tariffs and need for reliable power supply.

Asia Pacific leads with around 38% share, supported by strong industrial growth in China, India, and Southeast Asia.

A major opportunity lies in renewable-integrated captive systems and CHP adoption (40%+ share) to improve efficiency and reduce emissions.

The market includes General Electric Company (GE), Wärtsilä Oyj Abp, Siemens AG, Caterpillar Inc., and Mitsubishi Heavy Industries Ltd.

Global Captive Power Plant Market Report Scope
Report Attribute Details
Historical Data/Actuals 2020 - 2025
Forecast Period 2026 - 2033
Market Analysis Units Value: US$ Bn, Volume: As Applicable
Geographical Coverage
  • North America
  • Europe
  • East Asia
  • South Asia & Oceania
  • Latin America
  • Middle East & Africa
Segmental Coverage
  • Fuel Source
  • Capacity Range
  • Technology
  • End Use Industry
  • Region
Competitive Analysis
  • General Electric Company (GE)
  • Wärtsilä Oyj Abp
  • Siemens AG
  • Caterpillar Inc.
  • Mitsubishi Heavy Industries Ltd.
  • Bharat Heavy Electricals Limited (BHEL)
  • Cummins Inc.
  • ABB Ltd.
  • Schneider Electric SE
  • MAN Energy Solutions SE
  • Doosan Heavy Industries & Construction
  • Rolls-Royce Holdings plc (MTU Onsite Energy)
  • Kawasaki Heavy Industries Ltd.
  • Capstone Green Energy Corp.
  • Tata Power Renewable Energy
Report Highlights
  • Market Forecast and Trends
  • Competitive Intelligence and Share Analysis
  • Growth Factors and Challenges
  • Strategic Growth Initiatives
  • Pricing Analysis
  • Future Opportunities and Revenue Pockets
  • Market Analysis Tools
Market Segmentation

By Fuel Source

  • Coal
  • Natural Gas
  • Diesel / Heavy Fuel Oil (HFO)
  • Renewable
  • Others

By Capacity Range

  • Up to 10 MW
  • 10 to 50 MW
  • 51 to 150 MW
  • Above 150 MW

By Technology

  • Gas Turbine
  • Reciprocating Engine
  • Combined Heat & Power (CHP)
  • Renewable Microgrid
  • Others

By Industry

  • Cement
  • Metals & Minerals
  • Petrochemicals
  • Data Centers
  • Pulp & Paper
  • Others

By Region

  • North America
  • Europe
  • Asia Pacific
  • Latin America
  • Middle East & Africa

Related Reports

  1. Executive Summary
    1. Global Captive Power Plant Market Snapshot 2026 and 2033
    2. Market Opportunity Assessment, 2026-2033, US$ Bn
    3. Key Market Trends
    4. Industry Developments and Key Market Events
    5. Demand Side and Supply Side Analysis
    6. PMR Analysis and Recommendations
  2. Market Overview
    1. Market Scope and Definitions
    2. Market Dynamics
      1. Driver
      2. Restraint
      3. Opportunities
      4. Trends
    3. Macro-Economic Factors
      1. Global GDP Outlook
      2. Global Prison Growth Outlook
      3. Global Crime Rates by Country
      4. Global Prison Population by Country
      5. Global Private Prison Market Growth Outlook
      6. Other Macro-economic Factors
    4. Forecast Factors - Relevance and Impact
    5. COVID-19 Impact Assessment
  3. Value Added Insights
    1. Value Chain analysis
    2. Key Market Players
    3. Product Adoption Analysis
    4. Key Promotional Strategies by key players
    5. PESTLE Analysis
    6. Porter's Five Forces Analysis
    7. Regulatory and Technology Landscape
  4. Price Trend Analysis, 2025
    1. Region-wise Price Analysis
    2. Price by Segments
    3. Price Impact Factors
  5. Global Captive Power Plant Market Outlook: Historical (2020 - 2025) and Forecast (2026 - 2033)
    1. Key Highlights
    2. Global Captive Power Plant Market Outlook: Fuel Source
      1. Introduction/Key Findings
      2. Historical Market Size (US$ Bn) and Volume (Units) Analysis by Fuel Source, 2020-2025
      3. Current Market Size (US$ Bn) and Volume (Units) Forecast, by Fuel Source, 2026-2033
        1. Coal
        2. Natural Gas
        3. Diesel / Heavy Fuel Oil (HFO)
        4. Renewable
        5. Others
      4. Market Attractiveness Analysis: Fuel Source
    3. Global Captive Power Plant Market Outlook: Capacity Range
      1. Introduction/Key Findings
      2. Historical Market Size (US$ Bn) and Volume (Units) Analysis by Capacity Range, 2020-2025
      3. Current Market Size (US$ Bn) and Volume (Units) Forecast, by Capacity Range, 2026-2033
        1. Up to 10 MW
        2. 10 to 50 MW
        3. 51 to 150 MW
        4. Above 150 MW
      4. Market Attractiveness Analysis: Capacity Range
    4. Global Captive Power Plant Market Outlook: Technology
      1. Introduction/Key Findings
      2. Historical Market Size (US$ Bn) and Volume (Units) Analysis by Technology, 2020-2025
      3. Current Market Size (US$ Bn) and Volume (Units) Forecast, by Technology, 2026-2033
        1. Gas Turbine
        2. Reciprocating Engine
        3. Combined Heat & Power (CHP)
        4. Renewable Microgrid
        5. Others
      4. Market Attractiveness Analysis: Technology
    5. Global Captive Power Plant Market Outlook: End Use Industry
      1. Introduction/Key Findings
      2. Historical Market Size (US$ Bn) and Volume (Units) Analysis by End Use Industry, 2020-2025
      3. Current Market Size (US$ Bn) and Volume (Units) Forecast, by End Use Industry, 2026-2033
        1. Cement
        2. Metals & Minerals
        3. Petrochemicals
        4. Data Centers
        5. Pulp & Paper
        6. Others
      4. Market Attractiveness Analysis: End Use Industry
  6. Global Captive Power Plant Market Outlook: Region
    1. Key Highlights
    2. Historical Market Size (US$ Bn) and Volume (Units) Analysis by Region, 2020-2025
    3. Current Market Size (US$ Bn) and Volume (Units) Forecast, by Region, 2026-2033
      1. North America
      2. Europe
      3. East Asia
      4. South Asia & Oceania
      5. Latin America
      6. Middle East & Africa
    4. Market Attractiveness Analysis: Region
  7. North America Captive Power Plant Market Outlook: Historical (2020 - 2025) and Forecast (2026 - 2033)
    1. Key Highlights
    2. Pricing Analysis
    3. North America Market Size (US$ Bn) and Volume (Units) Forecast, by Country, 2026-2033
      1. U.S.
      2. Canada
    4. North America Market Size (US$ Bn) and Volume (Units) Forecast, by Fuel Source, 2026-2033
      1. Coal
      2. Natural Gas
      3. Diesel / Heavy Fuel Oil (HFO)
      4. Renewable
      5. Others
    5. North America Market Size (US$ Bn) and Volume (Units) Forecast, by Capacity Range, 2026-2033
      1. Up to 10 MW
      2. 10 to 50 MW
      3. 51 to 150 MW
      4. Above 150 MW
    6. North America Market Size (US$ Bn) and Volume (Units) Forecast, by Technology, 2026-2033
      1. Gas Turbine
      2. Reciprocating Engine
      3. Combined Heat & Power (CHP)
      4. Renewable Microgrid
      5. Others
    7. North America Market Size (US$ Bn) and Volume (Units) Forecast, by End Use Industry, 2026-2033
      1. Cement
      2. Metals & Minerals
      3. Petrochemicals
      4. Data Centers
      5. Pulp & Paper
      6. Others
  8. Europe Captive Power Plant Market Outlook: Historical (2020 - 2025) and Forecast (2026 - 2033)
    1. Key Highlights
    2. Pricing Analysis
    3. Europe Market Size (US$ Bn) and Volume (Units) Forecast, by Country, 2026-2033
      1. Germany
      2. Italy
      3. France
      4. U.K.
      5. Spain
      6. Russia
      7. Rest of Europe
    4. Europe Market Size (US$ Bn) and Volume (Units) Forecast, by Fuel Source, 2026-2033
      1. Coal
      2. Natural Gas
      3. Diesel / Heavy Fuel Oil (HFO)
      4. Renewable
      5. Others
    5. Europe Market Size (US$ Bn) and Volume (Units) Forecast, by Capacity Range, 2026-2033
      1. Up to 10 MW
      2. 10 to 50 MW
      3. 51 to 150 MW
      4. Above 150 MW
    6. Europe Market Size (US$ Bn) and Volume (Units) Forecast, by Technology, 2026-2033
      1. Gas Turbine
      2. Reciprocating Engine
      3. Combined Heat & Power (CHP)
      4. Renewable Microgrid
      5. Others
    7. Europe Market Size (US$ Bn) and Volume (Units) Forecast, by End Use Industry, 2026-2033
      1. Cement
      2. Metals & Minerals
      3. Petrochemicals
      4. Data Centers
      5. Pulp & Paper
      6. Others
  9. East Asia Captive Power Plant Market Outlook: Historical (2020 - 2025) and Forecast (2026 - 2033)
    1. Key Highlights
    2. Pricing Analysis
    3. East Asia Market Size (US$ Bn) and Volume (Units) Forecast, by Country, 2026-2033
      1. China
      2. Japan
      3. South Korea
    4. East Asia Market Size (US$ Bn) and Volume (Units) Forecast, by Fuel Source, 2026-2033
      1. Coal
      2. Natural Gas
      3. Diesel / Heavy Fuel Oil (HFO)
      4. Renewable
      5. Others
    5. East Asia Market Size (US$ Bn) and Volume (Units) Forecast, by Capacity Range, 2026-2033
      1. Up to 10 MW
      2. 10 to 50 MW
      3. 51 to 150 MW
      4. Above 150 MW
    6. East Asia Market Size (US$ Bn) and Volume (Units) Forecast, by Technology, 2026-2033
      1. Gas Turbine
      2. Reciprocating Engine
      3. Combined Heat & Power (CHP)
      4. Renewable Microgrid
      5. Others
    7. East Asia Market Size (US$ Bn) and Volume (Units) Forecast, by End Use Industry, 2026-2033
      1. Cement
      2. Metals & Minerals
      3. Petrochemicals
      4. Data Centers
      5. Pulp & Paper
      6. Others
  10. South Asia & Oceania Captive Power Plant Market Outlook: Historical (2020 - 2025) and Forecast (2026 - 2033)
    1. Key Highlights
    2. Pricing Analysis
    3. South Asia & Oceania Market Size (US$ Bn) and Volume (Units) Forecast, by Country, 2026-2033
      1. India
      2. Southeast Asia
      3. ANZ
      4. Rest of SAO
    4. South Asia & Oceania Market Size (US$ Bn) and Volume (Units) Forecast, by Fuel Source, 2026-2033
      1. Coal
      2. Natural Gas
      3. Diesel / Heavy Fuel Oil (HFO)
      4. Renewable
      5. Others
    5. South Asia & Oceania Market Size (US$ Bn) and Volume (Units) Forecast, by Capacity Range, 2026-2033
      1. Up to 10 MW
      2. 10 to 50 MW
      3. 51 to 150 MW
      4. Above 150 MW
    6. South Asia & Oceania Market Size (US$ Bn) and Volume (Units) Forecast, by Technology, 2026-2033
      1. Gas Turbine
      2. Reciprocating Engine
      3. Combined Heat & Power (CHP)
      4. Renewable Microgrid
      5. Others
    7. South Asia & Oceania Market Size (US$ Bn) and Volume (Units) Forecast, by End Use Industry, 2026-2033
      1. Cement
      2. Metals & Minerals
      3. Petrochemicals
      4. Data Centers
      5. Pulp & Paper
      6. Others
  11. Latin America Captive Power Plant Market Outlook: Historical (2020 - 2025) and Forecast (2026 - 2033)
    1. Key Highlights
    2. Pricing Analysis
    3. Latin America Market Size (US$ Bn) and Volume (Units) Forecast, by Country, 2026-2033
      1. Brazil
      2. Mexico
      3. Rest of LATAM
    4. Latin America Market Size (US$ Bn) and Volume (Units) Forecast, by Fuel Source, 2026-2033
      1. Coal
      2. Natural Gas
      3. Diesel / Heavy Fuel Oil (HFO)
      4. Renewable
      5. Others
    5. Latin America Market Size (US$ Bn) and Volume (Units) Forecast, by Capacity Range, 2026-2033
      1. Up to 10 MW
      2. 10 to 50 MW
      3. 51 to 150 MW
      4. Above 150 MW
    6. Latin America Market Size (US$ Bn) and Volume (Units) Forecast, by Technology, 2026-2033
      1. Gas Turbine
      2. Reciprocating Engine
      3. Combined Heat & Power (CHP)
      4. Renewable Microgrid
      5. Others
    7. Latin America Market Size (US$ Bn) and Volume (Units) Forecast, by End Use Industry, 2026-2033
      1. Cement
      2. Metals & Minerals
      3. Petrochemicals
      4. Data Centers
      5. Pulp & Paper
      6. Others
  12. Middle East & Africa Captive Power Plant Market Outlook: Historical (2020 - 2025) and Forecast (2026 - 2033)
    1. Key Highlights
    2. Pricing Analysis
    3. Middle East & Africa Market Size (US$ Bn) and Volume (Units) Forecast, by Country, 2026-2033
      1. GCC Countries
      2. South Africa
      3. Northern Africa
      4. Rest of MEA
    4. Middle East & Africa Market Size (US$ Bn) and Volume (Units) Forecast, by Fuel Source, 2026-2033
      1. Coal
      2. Natural Gas
      3. Diesel / Heavy Fuel Oil (HFO)
      4. Renewable
      5. Others
    5. Middle East & Africa Market Size (US$ Bn) and Volume (Units) Forecast, by Capacity Range, 2026-2033
      1. Up to 10 MW
      2. 10 to 50 MW
      3. 51 to 150 MW
      4. Above 150 MW
    6. Middle East & Africa Market Size (US$ Bn) and Volume (Units) Forecast, by Technology, 2026-2033
      1. Gas Turbine
      2. Reciprocating Engine
      3. Combined Heat & Power (CHP)
      4. Renewable Microgrid
      5. Others
    7. Middle East & Africa Market Size (US$ Bn) and Volume (Units) Forecast, by End Use Industry, 2026-2033
      1. Cement
      2. Metals & Minerals
      3. Petrochemicals
      4. Data Centers
      5. Pulp & Paper
      6. Others
  13. Competition Landscape
    1. Market Share Analysis, 2025
    2. Market Structure
      1. Competition Intensity Mapping
      2. Competition Dashboard
    3. Company Profiles
      1. General Electric Company (GE)
        1. Company Overview
        2. Product Portfolio/Offerings
        3. Key Financials
        4. SWOT Analysis
        5. Company Strategy and Key Developments
      2. Wärtsilä Oyj Abp
      3. Siemens AG
      4. Caterpillar Inc.
      5. Mitsubishi Heavy Industries Ltd.
      6. Bharat Heavy Electricals Limited (BHEL)
      7. Cummins Inc.
      8. ABB Ltd.
      9. Schneider Electric SE
      10. MAN Energy Solutions SE
      11. Doosan Heavy Industries & Construction
      12. Rolls‑Royce Holdings plc (MTU Onsite Energy)
      13. Kawasaki Heavy Industries Ltd.
      14. Capstone Green Energy Corp.
      15. Tata Power Renewable Energy
  14. Appendix
    1. Research Methodology
    2. Research Assumptions
    3. Acronyms and Abbreviations

Research Methodology Framework for Market Research Excellence

At Persistence Market Research, we implement a comprehensive, validated, and multi-dimensional approachto market analysis that delivers actionable insights across complex market landscapes. Our methodology combines the analytical rigor of leading consulting firms with innovative research techniques, ensuring robust market assessments that guide strategic decision-making with confidence.

Core Research Philosophy

Our methodology is built on four foundational pillars:

Research Philosophy Image

At Persistence Market Research, our methodology is designed to transcend conventional market studies by combining analytical rigor, multi-source validation, and future-focused insights.

We integrate advanced research frameworks, robust data collection strategies, cutting-edge analytics, and innovative technologies to deliver a 360-degree view of complex markets.

We integrate advanced research frameworks, robust data collection strategies, cutting-edge analytics, and innovative technologies to deliver a 360-degree view of complex markets.

Each stage spanning from strategic scoping and hypothesis-building to competitive intelligence, quality validation, and actionable recommendations is engineered to provide clients with unmatched clarity, precision, and confidence in decision-making.

By embedding innovation and technology at the core, our approach ensures that insights are not only comprehensive but also predictive, empowering businesses to seize opportunities, mitigate risks, and achieve sustainable growth

Research Philosophy Image

Capturing Key Information and Events

During this phase, key research objectives focus on essential information and data points for assessing the market, including:

Research Philosophy Image

TAM-SAM-SOM Framework Implementation

We employ both top-down and bottom-up approaches to ensure accurate market sizing.

Top-Down Market SizingBottom-Up Market Sizing
Universe Definition: Total global/regional market identificationUnit Economics: Average transaction values, purchase frequencies, customer lifecycle
Segmentation Filters: Geographic, demographic, and behavioral constraintsCustomer Segmentation: Detailed buyer persona development and sizing
Market Share Analysis: Competitive landscape assessment and share allocationPenetration Analysis: Market penetration rates by segment and geography
Growth Rate Application: Historical trends and forward-looking growth assumptionsScaling Methodology: Extrapolation techniques with confidence intervals

Validation & Cross-Verification

  • Triangulation: Comparing top-down and bottom-up results for consistency
  • Sensitivity Analysis: Testing key assumptions and parameter variations
  • Peer Benchmarking: Comparison with analogous markets and industry benchmarks
  • Expert Review: External validation through industry specialist consultation

Research Philosophy Image

Forecasting & Projection Modeling

Our proprietary forecasting models incorporate multiple variables and scenarios.

Forecasting Components

  • Historical Trend Analysis: 10-year historical growth patterns and cyclical variations
  • Driver-Based Modeling: Economic indicators, demographic shifts, technology adoption
  • Scenario Planning: Base case, optimistic, and conservative projections
  • Monte Carlo Simulations: Probability-weighted outcomes and risk assessments

Model Validation

  • Back-Testing: Historical accuracy assessment over 3–5-year periods
  • Cross-Validation: Multiple modeling approaches for result comparison
  • External Benchmarking: Comparison with established market forecasts
  • Continuous Calibration: Quarterly model updates based on new data

Comprehensive Data Collection Strategy

Our secondary research phase establishes a robust knowledge base utilizing diverse, credible sources.

Secondary Data Sourcess

  • Industry Publications & Reports
  • Government & Regulatory Data
  • Financial Intelligence (filings & reports)
  • Academic Research & Digital Intelligence

Quality Assurance Protocol

  • Source credibility assessment and publication date validation
  • Data consistency checks across multiple sources
  • Bias identification and neutralization techniques
  • Information gap tracking for primary research prioritization

Research Philosophy Image

Primary Research Excellence

Our primary research methodology employs best-in-class techniques to capture unique market insights.

Quantitative Research Methods

  • Large-Scale Surveys: Statistically representative samples with 95% confidence intervals
  • Survey Methodology: Multi-channel deployment (online, telephone, in-person)
  • Question Architecture and Response Optimization

Qualitative Research Methods

  • Executive Interviews
  • Focus Groups
  • Expert Consultations

Quality Assurance & Validation Framework

Multi-Stage Validation Process

  • Source Verification and Consistency Testing
  • Outlier Detection and Bias Assessment
  • Peer Review Process and External Validation
  • Sensitivity Analysis and Confidence Intervals

Research Philosophy Image

Methodology Validation & Credibility

Our research methodology has been extensively validated through:

  • Academic Partnerships: Collaborations with top-tier business schools and research institutions
  • Client Success Stories: Documented case studies demonstrating research impact and ROI
  • Continuous Benchmarking: Performance comparison with leading global research firms

This comprehensive methodology framework positions Persistence Market Research at the forefront of market intelligence, combining the analytical sophistication of top-tier consulting firms with innovative research techniques. Our approach ensures that every market assessment delivers precise, actionable, and strategically valuable insights that drive business success in competitive market environments.

Ready to unlock your market potential? Contact our research experts to discuss how our validated methodology can transform your strategic decision-making with data-driven market intelligence.

Copyright © 2026 Persistence Market Research. All Rights Reserved

Connect With Us -