


- Renewable Energy
- Base Oil Market
Base Oil Market Size, Share, and Growth Forecast 2026 - 2033
Base Oil Market by Base Oil Group (Group I, Group II, Group III, Group IV, Group V), by Source Type (Mineral Base Oil, Synthetic Base Oil, Bio-based Base Oil), Distribution Channel (Direct Sales, Distributors/Traders, Online Sales), Viscosity Grade (Light Grade, Medium Grade, Heavy Grade, Bright Stock), End-user, and Regional Analysis, 2026 - 2033
Base Oil Market Size and Trend Analysis
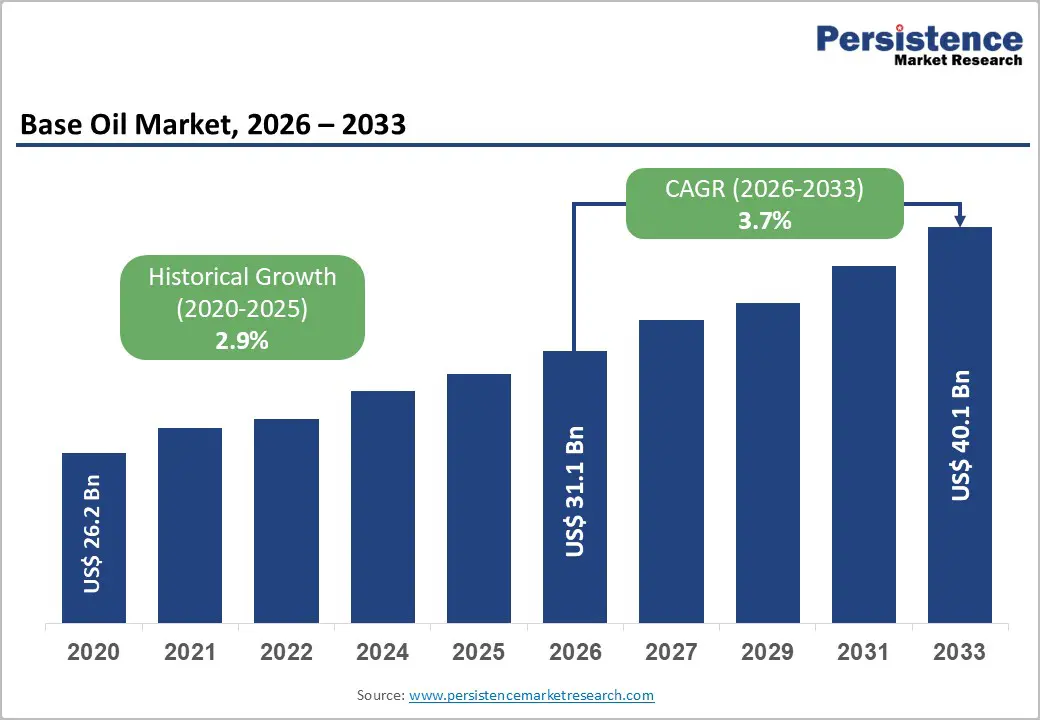
The global base oil market size is likely to be valued at US$ 31.1 billion in 2026 and is expected to reach US$ 40.1 billion by 2033, growing at a CAGR of 3.7% during the forecast period from 2026 to 2033.
The market's steady upward trajectory is anchored in accelerating automotive fleet growth across emerging economies, stringent global emission and fuel economy regulations compelling a transition from Group I to higher-performance Group II and Group III base oils, and expanding industrial lubricant demand in manufacturing and energy sectors.
Key Market Highlights
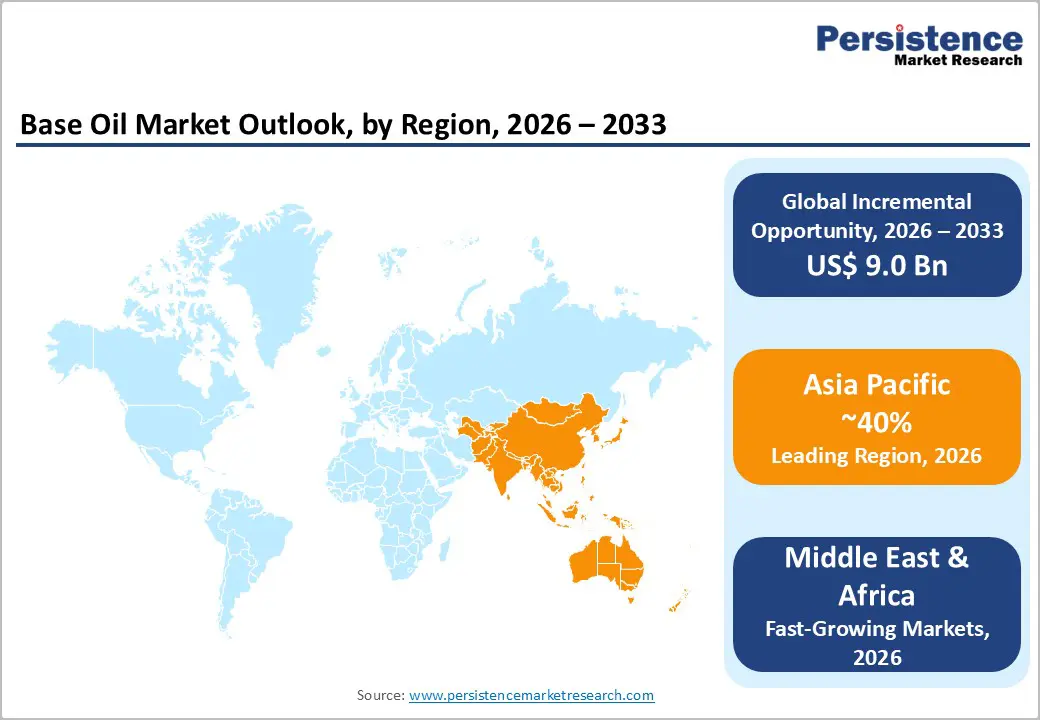
- Leading Region: Asia Pacific leads the global Base Oil market with over 40% consumption share, anchored by China's refinery upgrade programs from Group I to Group II, India's rapidly expanding vehicle fleet, and the region's projected 3.2 mb/d of new refining capacity additions through 2030.
- Fastest-Growing Region: The Middle East & Africa region is the fastest-growing base oil geography, driven by strategic refinery capacity expansions totaling 618,000 b/d by 2029 through investments by ADNOC, Saudi Aramco, and Bapco Refining, positioning the region as a net premium base oil exporter.
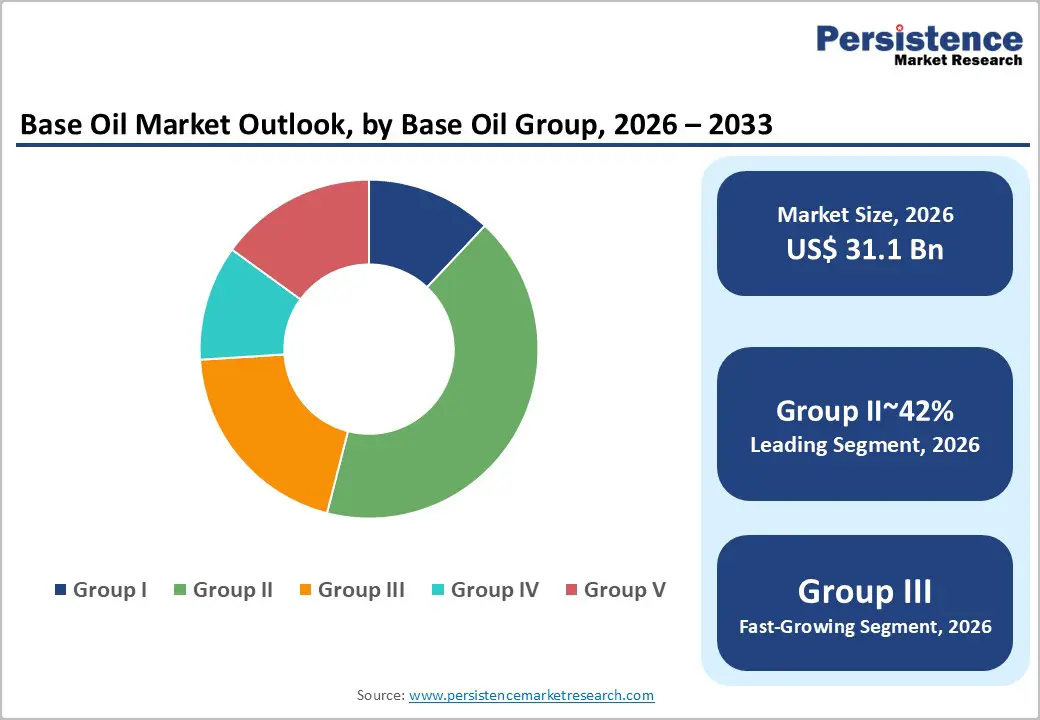
- Leading Segment: Group II base oils dominate the By Base Oil Group category with approximately 42% market share, driven by OEM specification mandates from Toyota, Volkswagen, and General Motors requiring Group II minimum quality in API and ACEA-compliant automotive lubricants across global vehicle markets.
- Fastest-Growing Segment: Group III base oils represent the fastest-growing segment within the Base Oil market, with Kline Group confirming that Group III production capacity additions are accelerating globally in direct response to demand from low-viscosity automotive oil grades and emerging EV-compatible fluid formulations.
- Key Opportunity: Synthetic Group IV PAO base oil for electric vehicle thermal management represents the highest-value commercial opportunity in the Base Oil market, with ExxonMobil's SpectraSyn™ MaX 3.5 PAO and the global EV fleet exceeding 40 million vehicles establishing concrete demand foundations for premium synthetic base stock providers.
| Key Insights | Details |
|---|---|
| Base Oil Market Size (2026E) | US$ 31.1 Billion |
| Market Value Forecast (2033F) | US$ 40.1 Billion |
| Projected Growth CAGR (2026 - 2033) | 3.7% |
| Historical Market Growth (2020 - 2025) | 2.9% |
Market Dynamics and Market Growth Drivers
Tightening Emission Regulations and the Transition to High-Performance Base Oils
Global regulatory tightening on vehicle emissions and fuel economy standards is one of the most powerful forces reshaping the Base Oil market. These regulations are pushing lubricant formulators to replace traditional Group I mineral oils with higher-quality Group II and Group III alternatives. The European Union’s Euro 7 emission standards and the U.S. EPA’s CAFE fuel economy regulations require engine oils that reduce friction losses and support longer drain intervals. Such performance characteristics can be effectively achieved using Group II and Group III base oil formulations.
The International Organization of Motor Vehicle Manufacturers (OICA) reported global vehicle production of approximately 91 million units, highlighting the massive scale of automotive lubricant demand. Kline Group analysis indicates that global Group III production capacity is increasing steadily in response to rising demand for low-viscosity automotive oil grades. Leading automotive manufacturers including Volkswagen, Toyota, and General Motors now require specific base oil group standards in their lubricant specifications, firmly embedding Group II and Group III adoption across the automotive and transportation sectors.
Expanding Automotive Fleet and Industrial Lubricant Demand in Emerging Economies
Rapid motorization and accelerating industrial development across Asia Pacific, the Middle East, and Africa are creating sustained demand for base oils across various viscosity grades and application segments. China and India have emerged as the world’s largest and third-largest automotive markets, respectively, and the growing number of vehicles on the road is directly increasing lubricant consumption.
According to the Asia Pacific Energy Research Centre (APERC), refining capacity additions in the Asia Pacific region are expected to reach about 3.2 mb/d by 2030, representing the largest contribution globally and strengthening domestic base oil production capabilities. At the same time, the global industrial lubricants market was valued at approximately US$ 64.4 billion in 2020 and is projected to expand at a CAGR of 4.4% through 2028. This growth is supported by modernization of manufacturing infrastructure and the installation of advanced automated production systems across South and Southeast Asia. These combined trends in transportation and industrial activity position base oil as a critical input material with structurally stable demand over the forecast period.
Restraints - Crude Oil Price Volatility and Feedstock Cost Unpredictability
Base oil production depends heavily on crude oil as the primary feedstock, which makes manufacturers highly sensitive to fluctuations in global oil prices. According to the International Energy Agency (IEA), global oil production capacity is expected to increase significantly, with non-OPEC+ producers projected to add around 4.6 mb/d of new capacity by 2030. While this expansion could create downward pressure on prices, it may also introduce inconsistencies in crude quality, affecting refining processes.
Sudden increases in crude oil prices caused by geopolitical tensions or supply disruptions, such as those experienced during the 2022 global energy crisis, can significantly raise base oil production costs. When feedstock prices increase, refinery margins become compressed, making it more difficult for producers to invest in upgrading facilities from traditional Group I refining technologies to advanced Group II and Group III production processes. As a result, price volatility and feedstock uncertainty continue to pose major operational and financial challenges for base oil manufacturers worldwide.
Electric Vehicle Adoption and Long-Term Demand Displacement Risk
The rapid global shift toward electric vehicles (EVs) presents a long-term structural challenge for the Base Oil market, particularly in the automotive segment. Unlike conventional internal combustion engine vehicles, EVs require significantly smaller volumes of lubricants. Fully battery-electric vehicles do not require engine oil, and they also use fewer thermal and mechanical fluids compared with traditional vehicles.
According to the International Energy Agency (IEA), the global EV fleet exceeded 40 million vehicles in operation, with annual EV sales surpassing 14 million units in 2023. This growing adoption of EVs gradually reduces lubricant demand from passenger vehicles, which has historically been one of the largest consumers of base oils. Although new opportunities are emerging for specialized synthetic base oils in EV thermal management systems, these applications are still developing. Overall, the long-term expansion of electric mobility is expected to reduce traditional base oil demand, creating a measurable headwind that manufacturers and investors must consider when planning future production and investment strategies.
Market Opportunities
Synthetic and Group IV PAO Base Oils for Electric Vehicle Thermal Management
The global transition toward electric vehicles is not only a challenge for the Base Oil market but also a significant opportunity for companies specializing in synthetic base oil technologies. Electric vehicles require advanced thermal management fluids for battery cooling, electric motor lubrication, and inverter protection. These systems demand low-viscosity and thermally stable synthetic formulations that perform far beyond the capabilities of conventional mineral base oils.
At F+L Week 2024, ExxonMobil introduced SpectraSyn MaX 3.5 PAO, a next-generation Group IV polyalphaolefin base stock designed specifically for EV applications. The product was developed through extensive research involving the synthesis and evaluation of more than 200 individual molecular structures. Synthetic base stocks offer superior low-temperature performance, reduced volatility, and improved shear stability compared with mineral oils. As global EV sales exceeded 14 million units in 2023, the demand for advanced Group IV and Group V synthetic base oils in next-generation mobility applications is expected to grow rapidly, creating a high-value opportunity for industry participants.
Middle East Refinery Capacity Expansion and Group II/III Production Opportunity
The Middle East is currently undertaking one of the most significant refinery expansion programs in the global energy industry, creating strong opportunities for increased base oil production capacity and export growth. According to S&P Global, refineries across the Middle East are expected to add approximately 618,000 barrels per day of additional production capacity by 2029. This expansion is likely to position the region as a major exporter of refined petroleum products, potentially approaching 7 million barrels per day by 2040.
Bahrain’s Bapco Refining facility is scheduled to increase its capacity by about 113,000 barrels per day in 2025, while Iraq and Iran are developing multiple new refinery projects that together could add more than 1.2 million barrels per day of capacity by 2027. In addition, companies such as ADNOC and Saudi Aramco are investing heavily in upgrading refining units to produce higher-quality Group II and Group III base oils. These developments are expected to expand global supply, reshape trade flows, and increase competitive pressure on established producers in Europe and North America.
Category-wise Analysis
Base Oil Group Insights
Group II base oils represent the leading segment within the base oil category, accounting for approximately 42% of the total base oil market share. These oils are produced using hydroprocessing technology, which removes sulfur, nitrogen, and aromatic compounds more effectively than the solvent refining process used for Group I oils. As a result, Group II oils offer better oxidation stability, lower volatility, and a higher viscosity index. These performance advantages make them the preferred choice for engine oils, transmission fluids, and industrial gear lubricants that must comply with international standards such as API SN Plus, ILSAC GF-6, and ACEA A3/B4. The gradual phase-out of Group I oils has been largely driven by OEM specification upgrades from manufacturers such as Toyota, General Motors, and Ford, which increasingly require Group II quality for factory-fill and service-fill lubricants worldwide. This shift toward Group II oils represents a major global trend that is reshaping base oil supply chains, refinery investments, and lubricant formulation strategies across key markets.
Source Type Insights
Mineral base oil is the dominant segment within the source category, accounting nearly for 62% of global base oil consumption by volume. These oils are derived directly from crude oil refining and remain widely used due to their strong availability, well-established supply chains, and significantly lower production costs compared with synthetic alternatives. Group I and Group II mineral base oils together support a large portion of automotive engine oil, industrial lubricant, and process oil applications across Asia, Latin America, and the Middle East. In these regions, price sensitivity and high-volume procurement needs make mineral-based products more commercially attractive.
Although developed markets are gradually shifting toward premium synthetic formulations, the large and growing lubricant demand in developing economies continues to sustain mineral base oil dominance. Expanding vehicle fleets and industrial machinery installations in these regions contribute to strong consumption volumes. According to the OPEC World Oil Outlook, additional refining capacity expected by 2030 will continue to support feedstock availability and maintain mineral base oil’s leading position in the global market.
Distribution Channel Insights
Direct Sales represent the leading distribution channel in the Base Oil market, accounting for approximately 55% of total channel revenue. Because base oil is primarily traded as a bulk industrial commodity, transactions usually involve large-volume shipments between refiners and lubricant blenders, additive manufacturers, and industrial end-users. This makes direct procurement the most efficient and preferred approach for large buyers. Major oil companies such as Shell, ExxonMobil, Chevron, and BP operate well-established direct sales networks supported by dedicated technical sales teams, long-term supply contracts, and integrated logistics infrastructure.
These capabilities enable suppliers to provide reliable product quality, stable supply, and cost advantages compared with distributor-based channels. In lubricant formulation, consistency in base oil properties, such as sulfur levels, viscosity index, and saturates content, is extremely important because it directly affects finished product performance. As a result, lubricant manufacturers often prefer long-term partnerships with certified refinery suppliers rather than relying on intermediary distribution channels.
Viscosity Grade Insights
Medium Grade base oils dominate the viscosity grade category, accounting for approximately 45% of the global market share. This viscosity range generally covers Society of Automotive Engineers (SAE) grades from about SAE 20 to SAE 40, along with corresponding ISO viscosity grades. These grades are widely used across both automotive and industrial lubricant applications. Medium-grade base oils serve as the primary formulation base for multi-grade engine oils, automatic transmission fluids, gear oils, hydraulic oils, and industrial circulating oils.
The viscosity classification system developed by ASTM International is widely accepted across lubricant standards organizations and positions medium-grade base oils as a core component in formulations that meet API, ACEA, and ILSAC performance requirements. These oils provide an ideal balance of performance characteristics, including stable viscosity at operating temperatures, reliable cold-start flow properties, and strong lubrication film thickness under mechanical stress. Because of this balanced performance profile, medium-grade base oils remain the preferred choice across global automotive and industrial manufacturing sectors.
End-User Insights
The automotive & transportation segment is the largest end-use sector in the base oil market, accounting for approximately 38% of total global consumption. Internal combustion engine vehicles require regular engine oil changes, with average oil drain intervals ranging from 5,000 to 15,000 kilometers depending on vehicle type and lubricant quality. This creates a consistent and recurring demand for base oils from the global vehicle fleet, which the International Organization of Motor Vehicle Manufacturers (OICA) estimates at more than 1.4 billion registered vehicles worldwide.
Automotive lubricants directly determine base oil requirements in terms of group type, viscosity grade, and additive compatibility through OEM approvals and international lubrication standards. As a result, the automotive industry plays a key role in shaping base oil demand trends and quality requirements. Regulatory pressure and improved engine technology are gradually shifting lubricant formulations toward higher-quality Group II and Group III base oils, increasing the value of base oil used in automotive applications despite the gradual adoption of electric vehicles.
Regional Insights
North America Base Oil Market Trends
The United States is the largest base oil consumer and a major refining hub in North America, supported by strong domestic Group II production capacity at facilities operated by ExxonMobil, Chevron, and Calumet Specialty Products. Regulatory policies and fuel efficiency standards play an important role in shaping lubricant specifications in the region. For example, the U.S. Environmental Protection Agency’s Corporate Average Fuel Economy (CAFE) standards encourage the development of higher-efficiency engines, which require advanced lubricant formulations.
The American Petroleum Institute continues to introduce updated service categories, including API SN-Plus and the upcoming transition pathway toward API SP 2.0. These evolving standards consistently promote the use of higher-quality base oils, particularly Group II and Group III grades. In January 2024, Chevron announced the transition of its Delo® Heavy Duty Engine Oil range from conventional formulations to synthetic blend and full synthetic variants, reflecting the growing demand for premium base oils in commercial vehicle applications across North America.
Europe Base Oil Market Trends
Europe is widely recognized as a premium base oil demand market, primarily due to its strict environmental regulations and advanced automotive manufacturing sector. The European Union’s Euro 7 emission standards and increasingly stringent ACEA lubrication sequences require high-performance lubricants with improved efficiency and lower emissions. As a result, Group II base oils have become the minimum commercial standard across much of the region, while Group III consumption continues to grow among lubricant manufacturers seeking OEM approvals.
Germany plays a central role in this demand, as it hosts major automotive manufacturers such as Volkswagen Group, BMW, Mercedes-Benz, and Bosch, all of which require highly specialized lubricant formulations. Other countries including France, Spain, and the United Kingdom also contribute significantly to regional lubricant consumption through strong industrial and automotive sectors. However, Europe remains heavily dependent on base oil imports from the Middle East and Asia, particularly from suppliers such as SK Enmove and Bahrain’s BAPCO, due to limited domestic premium refining capacity.
Asia Pacific Base Oil Market Trends
Asia Pacific is the largest regional market for base oils, accounting for around 40% of global demand. China and India serve as the primary growth engines driving this regional expansion. China is both the world’s largest base oil consumer and a rapidly growing producer, with major refinery investments led by companies such as SINOPEC, PetroChina, and CNOOC. These companies are upgrading older Group I refining capacity toward more advanced Group II production to meet the rising quality requirements of the domestic automotive lubricant market.
According to the Asia Pacific Energy Research Centre, the region is expected to account for a significant portion of global refining capacity additions through 2030, strengthening its role in global base oil supply. India also contributes strong demand growth due to its rapidly expanding vehicle fleet and large two- and three-wheeler market. Domestic refiners such as Indian Oil Corporation and BPCL continue to expand capacity to support growing lubricant consumption across the country.
Competitive Landscape
The global Base Oil market has a moderately consolidated competitive structure, with a limited number of large, vertically integrated oil companies controlling a significant share of premium Group II and Group III refining capacity. Major players such as ExxonMobil, Shell plc, Chevron, BP, SINOPEC, and Saudi Aramco dominate the market through their strong upstream crude oil supply, integrated refining infrastructure, and extensive downstream lubricant distribution networks.
These companies benefit from economies of scale and advanced hydroprocessing technologies that allow them to produce high-quality base oils meeting global industry standards. Key competitive factors include refining technology capabilities, certification across major lubricant standards such as API, ACEA, and ILSAC, and strong technical support for lubricant manufacturers. At the same time, several emerging trends are shaping competition in the industry, including investments in synthetic polyalphaolefin production for electric vehicle fluids, research into bio-based base oils for sustainability goals, and the development of long-term supply agreements with independent lubricant blenders.
Key Market Developments
- In January 2024: Chevron began transitioning its Delo® Heavy Duty Engine Oil portfolio toward synthetic blend and full synthetic formulations. The company phased out three conventional HDEO grades and introduced Delo 400 XLE SB SAE 15W-40, strengthening product supply reliability and supporting the shift toward higher-performance lubricant formulations for commercial fleets.
- In May 2024: ExxonMobil introduced SpectraSyn™ MaX 3.5 PAO, a next-generation Group IV synthetic base stock developed for advanced electric-vehicle thermal management and drivetrain lubrication. The product was engineered after extensive molecular testing, establishing improved oxidation stability and performance for emerging EV fluid and high-efficiency lubricant applications.
- In September 2025: Bapco Refining advanced its Sitra refinery modernization project in Bahrain, expanding processing capacity from roughly 265,000 barrels per day to nearly 400,000 b/d. The upgrade improves diesel and jet fuel output while strengthening the Middle East’s role as a major exporter of refined products and base oil feedstocks.
Companies Covered in Base Oil Market
- CNOOC Limited
- PetroCanada Lubricants Inc.
- Petroleum & Chemical Corp.
- PETRONAS Lubricants International
- PT Pertamina
- PetroChina Co., Ltd.
- Exxon Mobil Corporation
- Abu Dhabi National Oil Company
- Chevron Corporation
- Shell plc
- Indian Oil Corporation Ltd.
- BP p.l.c.
- Saudi Arabian Oil Co.
- Sepahan Oil Company
- Bahrain Lube Base Oil Company
- SK Enmove Co., Ltd.
- Calumet Specialty Products Partners
- Neste Corporation
Frequently Asked Questions
The global Base Oil market is estimated to be valued at US$ 31.1 Billion in 2026 and is projected to reach US$ 40.1 Billion by 2033, growing at a CAGR of 3.7% during the forecast period, supported by automotive lubricant specification upgrades, industrial demand growth, and expanding refinery capacity in Asia Pacific and the Middle East.
The most critical demand driver is the regulatory-mandated transition from Group I to higher-specification Group II and Group III base oils, driven by the EU's Euro 7 standards, U.S. EPA CAFE regulations, and OEM lubricant approval requirements from Toyota, Volkswagen, and General Motors, all demanding lower-viscosity, higher-performance engine oil formulations.
Group II base oils hold the leading position with approximately 42% market share. Produced via advanced hydroprocessing technology, Group II base oils deliver superior oxidation stability, lower volatility, and higher viscosity index compared to Group I, making them the universal standard for API- and ACEA-compliant automotive engine oils and industrial lubricants globally.
Asia Pacific leads the global Base Oil market with over 40% of total demand, anchored by China's ongoing Group I-to-Group II refinery upgrade programs, India's expanding vehicle fleet, and the region's dominant share of projected global refining capacity additions, which the Asia Pacific Energy Research Centre (APERC) confirms will reach 3.2 mb/d through 2030.
The development of synthetic Group IV PAO base oils for electric vehicle thermal management is the highest-value opportunity. ExxonMobil's SpectraSyn™ MaX 3.5 PAO, developed through testing of over 200 molecules, exemplifies the technology pathway, while the global EV fleet surpassing 40 million vehicles provides a confirmed and rapidly growing demand base for premium synthetic base stocks.
Leading participants in the global Base Oil market include Exxon Mobil Corporation, Shell plc, Chevron Corporation, BP p.l.c., Saudi Aramco, SINOPEC, PetroChina, ADNOC, PETRONAS Lubricants International, PT Pertamina, Indian Oil Corporation, PetroCanada Lubricants, CNOOC Limited, Bahrain Lube Base Oil Company (BAPCO), and SK Enmove, among others.


